February 11, 1970: Japan puts its first satellite into orbit.
September 12, 1970: Timothy Leary escapes from a California jail.
February 27, 1973: Wounded Knee, South Dakota, is occupied by Native Americans.
CHRISTMAS DAY 1974: AUSTRALIAN SUPERCYCLONE TRACY TOUCHES DOWN.
April 26, 1976: Pan Am begins regular New York–Tokyo flights.
September 9, 1976: Mao Zedong dies, Beijing.
November 8, 1979: The Chilean Communist Party is founded.
I am the Rider of the wind
The Stirrer of the storm.
—LORD BYRON, Manfred, 1817
At first there seemed little reason to fret. Darwin was a tough little frontier town, a hard-drinking, broken-jaw kind of place—Australia in the raw, ready for most kinds of trouble. Over the years it had suffered gamely through a variety of storms, natural and man-made. During the war, more Japanese bombs had rained down on Darwin than on Pearl Harbor, and the scores of subsequent Japanese raids made for a certain proudly held resilience of spirit, still evident today in this far “top end” of Australia. That, and the weather—perpetually hot and humid; and during the summertime rainy season, which the locals still call “the wet,” it is often ripped apart by frequent and spectacular tropical thunderstorms.
When a gathering storm was first noticed out in the Arafura Sea, at the start of Christmas week of 1974, no one thought it was anything special. Cyclones were part of the usual patter of midsummer weather. It was coming up to the centenary of the opening of the Port Darwin cable station, which had first connected Australia to Java and the rest of the world, and over all the years since then, fierce tropical cyclones had regularly barreled in from the seas to the north and hammered the crude government shacks in which the first hundred had lived, and now hammered the tin-roof shanties that were home to most of the forty thousand present-day Darwinians. Old-timers would tell of the unique sounds of a Darwin cyclone—of the screechings of thousands of corrugated-iron roofs being gale-blown along the roadways, of the noise of breaking glass, of the endless howls of wind, of lashing rains, and, as basso continuo, of the furious pounding of ocean.
That was not likely to happen this time. Christmas 1974 would surely be hot and steamy, but peaceful enough. The storm out in the sea was just a small one, and it was heading south, well away from the city. It would press on down through the Joseph Bonaparte Gulf and make eventual landfall in the Kimberleys. There would be rain in western suburbs, perhaps, and fine displays of lightning. But that wasn’t unusual: Darwin always had rain and lightning at this time of year. Each season had a full dozen cyclone alerts, and each time the ABC sounded its sirens, the announcer went on the air with the usual warnings about tying down loose objects and filling the bath with emergency water. Everyone heard, but few listened. The ABC was crying wolf, people grumbled.
The weather bureau tracked the storm as it passed slowly to the west of Bathurst Island, heading south. Most in town remained complacent—it was Christmas, after all: there was church to attend, presents to wrap, trees to decorate, children to persuade to sleep.
This time, though, a very few suspected that something was up, mainly because the air in town felt somehow different. “Jerky” was how a Chinese shopkeeper described it. The songbirds had fallen strangely quiet; and according to the long-grass dwellers, the Larrakia aboriginal peoples who (then, as today) liked to camp in the tall grasses outside town, all the usual populations of green ants they would normally have seen seemed to have vanished. “Something dreadful is going to happen,” a woman named Ida Bishop said to her boss, the manager of a fleet of prawning boats. The gathering quiet was ominous. The clouds were too high, were strangely shaped, and were vivid with purples and greens, and with other bizarre colors that just shouldn’t be there. Some reported seeing what they described as a black velvet cloud hanging in the air five miles above the sea, rolling and pulsing, and blotting out the sun.
Then, out at sea, the storm changed direction. Quite unexpectedly, it made a sharp right-angled swerve to the east. At exactly the same time, it contracted, like a tightening sphincter, and to the growing consternation of officials, it began to bear down with withering accuracy toward the dead center of Darwin.
The storm was called Cyclone Tracy, and there has never been a more dreadful and destructive event in recorded Australian history. Once the Meteorological Office forecasters had confirmed the approach, ABC radio turned on its sirens. The chief announcer, a man named Don Sanders, whose voice was known for its confidence-inspiring depth and richness, was brought in to warn of the coming danger. It may have saved lives. It didn’t save the town.
When the storm hit shore a little after midnight, it crushed building after building like a giant’s hand. Ten thousand houses (80 percent of the city) were totally destroyed. They were near-instantly demolished, reduced almost to matchwood and pulverized concrete. The process was identical, house after Christmas-decorated house: First, the roof was ripped off its stanchions and whirled away into the rain-soaked night. Then the windows shattered, slicing people with slivers of glass. The walls next blew out, one by one—people would speak of running in darkness and panic from room to room, locating by feel the bathroom doors and racing inside in the belief that the smallest room would be the strongest—only to find the outside wall gone and only the darkness beyond, a terrifying frenzy of gales and oceans of pounding hot rain.
Darwin was brought to its knees. Everything failed: The telephones were out. Electricity was down. Antennas were blown flat. Aircraft had been tossed about like chaff, smashed beyond recognition. Ships broke loose in the harbor and either sank or drifted far from their moorings, useless. Scores of people who might have been useful were away for the Christmas holiday. The broadcast stations had only skeleton crews, but no light or water—though one of them, the local ABC affiliate, did have a generator, and managed to get a message out to a remote sister station in the Queensland outback. This tenuous link provided the only communication Darwin had with the outside world for the first three days after the catastrophe.
Word got out late on Christmas afternoon. It was then that the rest of Australia came to realize that its most northerly capital city had been laid waste by a terrible storm. Ministers in Canberra, and others in Sydney and Melbourne and Brisbane, were roused from turkey- and mince pie–induced lunchtime slumbers to be told of the ruin and devastation thousands of miles away.
And when the first rescuers got there, they all made the same comparison: Hiroshima, or Nagasaki. The comparison is invidious, of course; the casualty tolls were incomparable—seventy-one were killed by Tracy, not even one-tenth of a percent of those who died in Japan—but the physical destruction of Darwin was total, and the images more than amply resembled the familiar photographs of the two postnuclear cities. Roads were no more than pathways through scores of square miles of broken rubble and splintered timber. People were wandering around glassy-eyed, bewildered. Hundreds of dogs, frightened and unfed, emerged from the ruins to forage, and the first rescuers to arrive were struck by their snarling presence, adding to the menace in the air. There was a real threat of typhoid and cholera. Police had to find guns (shotguns, mainly, from the nearby sheep stations) to deal with looters.
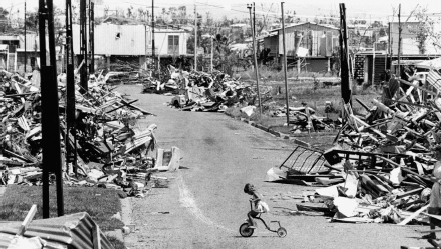
The near-total destruction of the city of Darwin by the unforgotten Cyclone Tracy, which struck on Christmas Day. Storms of this size and power are increasing in frequency and ferocity in and around the Pacific.
Newspix/Getty Images.
In the end, almost the entire city had to be evacuated. Forty-one thousand of the forty-seven thousand were without home, shelter, water, food, medicine, or communication. The government arranged shuttles of aircraft—slowly at first, because the ruined Darwin airport could accommodate only one flight every ninety minutes. Over the next five days, a total of more than thirty-five thousand people were flown or driven out of the city—and by the time the year ended, it had been all but emptied. More than half of those who left never came back.
Darwin is a wholly rebuilt city now, slick and modern, with most of its high-rise buildings apartment blocks rather than the banks and insurance companies that usually dominate downtowns. And everything now is claimed to be cyclone-proof—because, if nothing else, those who live at the top end of Australia learned from the disaster of the 1970s that the Pacific can be a place of extraordinarily violent weather.
There is more. The storms created in this ocean are coming to be recognized as the harbingers of the weather in the rest of the planet—the very first indicators of, maybe even the generators of, the swirls of wind, pressure, and humidity that sweep from west to east as the world turns beneath them. Since these cyclonic storms* are said, both anecdotally and statistically, to be becoming ever more furious as the earth and its seas warm up, as the climate changes, as the oceans rise, the consequences for the world are at the very least potentially troubling, maybe even dire.
Time and history have their understandable ways of turning tragedy into statistics, and in matters such as storms, earthquakes, and eruptions, statistics often boast superlatives, turning contemporary misery into historical pride. The people in Darwin who were forced to hide for hours under their bathtubs in their utterly ruined homes and to fend off starving dogs as they tried to keep themselves safe and alive may not quite see it that way, but the fact remains that theirs was the most lethal miniature storm ever recorded.
For, in areal span, it was very small: it extended over only 24 miles, side to side and through its eye. It was quite Lilliputian when compared with monsters such as Hurricane Katrina, which was 400 miles across when it struck New Orleans in 2005. It was minuscule when set against Typhoon Tip, which roared across the tropical Pacific in 1979 with a record-breaking diameter of 1,380 miles and an eye not much smaller than the entirety of Cyclone Tracy, which could have been pushed inside it quite handily.
Pacific storms have clearly been getting ever more menacing in recent years. Cyclone Tracy in 1974 was close to the beginning of this development: Typhoon Haiyan, which struck the Philippines in November 2013, suggests how truly ferocious things can get. The four decades between these two storms saw two developing trends: bigger and increasingly troublesome storms and an ever-greater accuracy in pinpointing where they might make landfall. More lives were at risk from the storms’ gathering power; more lives were saved by the gathering boon of science.
Typhoon Haiyan makes the point well. It was first spotted far away, by observers in Hawaii. The four duty officers who arrived for their night shift on the early evening of Friday, November 1, 2013, in the drab Pearl Harbor building that houses the offices of the Joint Typhoon Warning Center were the first to notice something unusual. The satellite images for their routine sweep of the far western Pacific (where it was already the afternoon of the next day, Saturday) were just scrolling onto their monitors. And while most of the ocean was quiet—just a single disorganized cluster of squalls, a small and nameless tropical storm, that was wandering aimlessly westward toward Mindanao—a new pattern of clouds had just sprung into view in the central ocean, and this one had an ominous look about it.
The proto-cyclone, if that is what this was, must have been developing rapidly during the day, for the earlier shift had reported nothing from the satellite when it last transmitted pictures six hours previously. But now, quite clearly, wisps of cloud had arranged themselves in a manner suggesting that a definite and organized pattern was forming, about two hundred fifty miles to the southeast of the tiny island of Pohnpei, in Micronesia, and that it was changing its appearance fast. Real-time imagery then showed that it was assuming the all too familiar, vaguely swirling cyclonic appearance that betokens danger. The suddenness of its appearance and the fast lowering of pressure beneath the cover of clouds all struck the weather analysts as noteworthy, at the very least.
They promptly sent a message across the road to the operations room of Pacific Fleet headquarters: U.S. Navy ships in the area might want to know that wind and rain could well affect any vessels heading for that quarter of the sea. A routine message. No alarums and excursions. Not yet.
By November 3, the Japan Meteorological Agency outside Tokyo had assigned the now swirling wisps of cloud a number, Tropical Storm 31W. By the next day, the swirls had grown very much more powerful, and the storm had been upgraded to full typhoon status. It was given the preassigned name Haiyan, the Chinese word for “petrel,” a bird that in mariners’ lore is often associated with foul weather. The fast-gathering beast by now appeared to be moving in a westerly direction, traveling directly toward the barrier wall of the Philippine Islands, where the local weather agency, following its own naming rules, had confusingly decided not to follow the international rules, but to call the storm Yolanda.
The situation was becoming alarming. The American and Japanese weather forecasters, and later those watching the big weather radars in China and Hong Kong, knew this was going to be a monster storm. They began to issue warnings to the civil defense agencies in the southern Philippines—the accuracy of their forecast allowing them to offer some days of preparation for the onslaught of what was now clearly going to be a storm of a power seldom seen before at sea, and perhaps never before experienced on land. Evacuations were ordered, and people began to stream away from the country’s southeastern coasts, where the storm was predicted to land.
The forecasts were right, nearly to the minute. Typhoon Haiyan struck head-on into the eastern Philippines, hitting the islands of Samar and Leyte almost simultaneously, at about 9:00 a.m. on Friday, November 8. By the time it reached land, it had become the fiercest typhoon to have done so in the world’s recorded history. When the northern eye wall of the storm struck the village of Guiuan, such anemometers as hadn’t already whirled off scale recorded wind gusts of 196 miles per hour—greater by far than anything previously known.
The physical and human damage was terrifying in its extent and consequence, although the warnings and the precision of the forecasts certainly helped keep down the total of human casualties. Sixty-five hundred people were killed, twenty-seven thousand were injured, and more than a thousand were missing. Just as in Darwin forty years before, whole cities were flattened, every building reduced to mere debris as if by an earthquake or an atom bomb. The city of Tacloban, the biggest in the region, was almost unrecognizable after first being hit by the full force of the storm, and then being swamped by the corrosive seawaters of the thirteen-foot storm surge that followed.
There was an uncanny coincidence in the Philippines that did not pass unnoticed. Landfall in 2013 of Haiyan, the most savage of all the world’s storms, was made along the coast of Leyte Gulf, the site in 1944 of the most savage of all the world’s naval battles. Two of the nearby villages have since been named for Douglas MacArthur, the general being a great hero in these parts. His famous “I Shall Return” promise is commemorated by a bronze statue depicting him and his staff striding through the ankle-deep waters to resume control of the Philippines; it stands by the beach where the event took place, in the tiny town of Palo. All three of these places, Palo and the two villages called MacArthur, were savagely damaged by the violence of the typhoon.

Typhoon Haiyan, which devastated much of the Leyte Gulf region of the southeastern Philippines in late 2013, brought a massive international response, most notably by the U.S. military—a classic demonstration of Washington’s use of “soft power.”
Jacques Descloitres/NASA.
American military forces were quite as heavily involved in dealing with Haiyan’s violence now, seventy years after the Battle of Leyte Gulf. Thanks once again to the accuracy of the forecasts, U.S. Marines and U.S. Navy ships were already on standby in Japan and Okinawa, or they were out at sea. Once the signal came that the State Department had agreed to respond to Manila’s official request for help, the well-oiled machinery of a full-blown American-led rescue operation got under way.
Operation Damayan, the $21 million quick in-and-out rescue operation, formally began the next morning, Saturday, November 9. The night before, however, when a stunned Tacloban was still crawling out from under the storm’s wreckage, a small flotilla of helicopters quietly brought in members of a U.S. Special Forces team that was already in-country, secretly helping to deal with a long-running insurgency.* They set up radios and began talking to the incoming armada of ships and the waves of marines who would soon fill Leyte Gulf with as many vessels as had been there seventy years earlier, during the legendary naval battle.
More than eight hundred U.S. Marines from the Third Expeditionary Brigade in Okinawa were on the ground in the Philippines by the Saturday afternoon. A survey ship already working in the gulf was on station the next day, and then a submarine tender, filled with emergency supplies and drinking water. The high point, at least cinematically, was the arrival on the Thursday of the huge nuclear-powered carrier USS George Washington, with her attendant strike group of destroyers and frigates. She anchored in the bay and, for the next eight days, served as a floating headquarters for a relief operation that ultimately involved twenty-two hundred U.S. military personnel, thirteen warships, twenty-one helicopters, and the distribution of two thousand tons of American food, blankets, tents, generators, water purifiers, and myriad other kinds of aid invariably needed in the aftermath of such a calamity.
The sight of this vastly impressive, hulking, broad-shouldered behemoth of a warship, and of the squadrons of lesser vessels anchored around her (these later included two British ships, a destroyer and a carrier) was at once powerful, comforting, reassuring. It served as a reminder, important in the propaganda wars, that American military influence in the world is predicated not only on war and the projection of hard power. This was so-called soft power projection at its most effective—and once the immediate storm crisis was over and the American carrier had weighed anchor and slipped off back into patrolling the China seas, Washington propagandists publicly pointed out how little the Chinese had done to help. Beijing had initially offered a laughable $100,000. Only when stung by the world’s response to their seeming niggardliness did they increase the aid to $1.6 million, and send down from Shanghai a new hospital ship, on what turned out to be her maiden voyage. She arrived too late to be of much use.
Beyond the melancholy dramas of their immediate impact, storms like these have proved of great use in recent studies of the world’s climate. They and their kin offer in particular many clues for understanding one thing and for realizing another. They have allowed for an ever-greater understanding of the dramatic recent changes in the planet’s atmospheric environment. And they and their like have served to offer a confirmation of something long suspected but never firmly proved: that whatever the changes in the earth’s climate may be, it is and always has been the Pacific Ocean that is the generator, the originator, of much of the world’s weather.
Tracy and Haiyan were more than simple events, however individually tragic and dramatic. They were bookends to a catalogue of atmospheric occurrences in the Pacific Ocean that have been getting steadily more ferocious in recent years, and to some they tell a much greater and more significant story—a story that many are now beginning to relate with ever-greater urgency.
In March 2013, for example, six full months before Haiyan hit the Philippines, Samuel Locklear III, the American four-star admiral who was then in charge of all U.S. forces in and around the Pacific (three hundred thousand navy, army, marine, and air force personnel, ranged around more than half the world), detected a pattern in the frequency and violence of recent Pacific typhoons, and then made what seemed to many an eccentric prediction. His initial observation was factually unremarkable: “Weather patterns are more severe than they have been in the past,” he declared at a meeting in Boston. “We are already on super-typhoon 27 or 28 here in the Western Pacific. The annual average is about 17.”
The conclusion he drew from the trend, though, was quite unanticipated. In spite of the tensions between China and Japan, between North and South Korea, between Beijing and Washington, the admiral declared his belief that it was actually changes to the climate—changes that were powerfully suggested by typhoon clusterings that he and his weather analysts had observed—that posed the greatest of all security threats in the region.
“Significant upheaval related to the warming planet is probably the thing most likely to happen . . . and that will cripple the security environment. Probably that will be more likely than the other scenarios we often talk about.” A ripple of amazement coursed through Washington. Significantly, no one in the White House or the Pentagon, however, chose to challenge the admiral’s view. It was clear that he spoke with gazetted authority.*
Not that the admiral’s stated concern over the number of storms that gathered within his AOR (navyspeak for “area of responsibility”) was meant to imply that storms in the other, lesser oceans were any less daunting. Notorious monsters such as Katrina, Camille, Andrew, Ike, Sandy, Hugo, Wilma, Rita, the Labor Day hurricane of 1935, the Okeechobee hurricane of 1928—all these were great Atlantic storms of truly historic proportions, and all were hugely destructive and frightening.
“Destructive” and “frightening” are not true measurements, however. Nor is the most commonly used metric of a storm’s financial cost. In America, Atlantic hurricanes tend to be popularly described by their eventual price—the quoted losses for the insurance companies of $108 billion in and around New Orleans in 2005 have made Katrina come to be seen as the absolute worst storm in American history. But cost can hardly be a neutral descriptor: Storms that strike American cities are expensive because they wreck expensive things. Storms that strike isolated cities in the eastern Philippines may cause just as much devastation, but in dollar terms are much less costly. Human damage, of course, is different—still, that is not neutral, either, since a typhoon hitting a crowded slum will kill far more than one that sinks ships and swamps atolls in the middle of the ocean.
We do have scales to measure storm intensity, but they are not perfect. Most use wind speed as a categorizing device because wind is what does the greatest damage. It also suggests the overall energy (the kinetic energy of a fast-rotating body of air) of the storm as a whole. Critics reasonably complain also that it is imprudent to ignore the amount of rainfall dropped by a storm, or the speed with which the storm develops, or the surge it creates in the sea. They insist that a wind-only classification is of somewhat limited use—at least, beyond the television news.
Arguably the most ideal and neutral way to describe a storm is much simpler, if hardly telegenic, and that is according to the lowest pressure in the storm’s eye. The lower the pressure, the more intense the storm. The more numerous the isobars, and the more tightly these imaginary lines of equal atmospheric pressure are wound together, the more vicious is the weather below.
This measurement of a storm’s minimum central pressure—something that was not always easy to acquire in the days before satellites and storm-hunting aircraft, and even today often requires that a dropsonde be trickily inserted into the storm’s eye—makes comparison much easier. It makes it possible to measure one ocean’s violence against that of another, for instance. It makes it simpler to compare the storms of one year with those of previous years, to range decades against earlier decades. In short, and therefore most usefully, it allows climatologists to spot and identify real climatic trends.
By employing this one measure, scientists are able to determine that the apparently biggest and costliest storms do in fact, and much as expected, tend to be the deeper and more isobarically intense ones. By this same measure, oceans can now be compared with other oceans. And recent data show that most Atlantic hurricanes, when measured according to the lowest pressure in their eyes, yield overwhelmingly in their strength, power, and destructiveness to those gigantic storms (such as Tracy and Haiyan) that now regularly cannonade across the broad reaches of the Pacific.
The key number that the World Meteorological Organization has chosen as a baseline for assessing a storm’s strength is 925 hectopascals, or what used to be called millibars (mbar). Any storm eye with a pressure measured as less than 925 mbar is one for the books, intense enough to be worthy of record.* And when one looks at the Pacific Ocean using that measure alone, it becomes swiftly clear that this body of water is beyond any other when it comes to playing host to a number of the world’s truly intense tropical storms.
The figures are telling. In the Atlantic since 1924, just nineteen hurricanes made it into the list of storms with eye pressures of less than 925 mbar. Just one out of five of those (the hurricanes known as Labor Day 1935, Allen, Gilbert, Rita, and Wilma) were superintense, with eye pressures of less than 900 mbar. Neither Camille nor Katrina managed to figure below the 900 mbar number. Hurricane Sandy, infamous in recent New York and New Jersey history, did not even make the World Meteorological Organization cut, registering a comparatively benign 940 mbar in its nonspinning center.
In the western North Pacific, however, atmospheric violence as measured by intensely low eye pressure is much more common, almost routine. Since 1950, there have been fifty-nine fully formed typhoons north of the equator, and in the western South Pacific and off Australia there have been twenty-five similarly rated cyclones since 1975. In the Atlantic, the rate of occurrences of the sub-925 mbar storms runs at about one every five years. In the western Pacific they are much more numerous, with about one every single year.
Moreover, the large, sprawling, ultra-low-pressure storms occur five times more often in the Pacific than elsewhere in the world. They are generally much more intense, with thirty-seven of the northwest Pacific’s fifty-nine having pressures lower than 900 mbar. Typhoon Tip, the deepest of them all, recorded an eye-watering low pressure of just 870 mbar—and enjoyed the unique distinction of being both the deepest and the widest of all tropical storms on record, with an edge-to-edge spread of 1,380 miles—meaning that if superimposed on the United States, it would have extended from the Mexican border to the Canadian border, and from Yosemite to the Mississippi River, with its eye directly above Denver.*
The best explanation for why the Pacific storms are now more numerous and violent has much to do with the ocean’s vast size and, most crucially, with the near-unimaginable amount of heat that its waters collect from the sun. And this, it seems, is key to everything else: if the Pacific Ocean is the principal generator of the world’s weather, then the ultimate source of all the Pacific’s extreme meteorological behavior is the initial presence of its massive aggregation of solar-generated heat. This changes the long-term phenomenon we know as the climate. The climate in turn brings about the short-term phenomena we know as the weather.
The Pacific Ocean is broiled by the sun, whatever the season. Given the tilt of the planet, the 23.5 degrees offset from vertical of the axis around which the world spins, the ocean’s northern parts are broiled in the northern summer, and the southern parts in the southern summer. The immense region of sea that lies between the Tropics of Cancer and Capricorn are being broiled all the time.
The heat, the thermal energy, that blasts endlessly down on the planet is dealt with differently depending on whether it strikes solid or liquid below. When intense sunshine radiates down onto the solid earth, the rocks become very hot very quickly—but then, because of the immutable physics of solids, they release this heat equally fast, return it to the atmosphere, and retain little. To a wanderer in the desert, a rock at nighttime can be blessedly cool.
It is different when the same intense heat is radiated down onto the ocean. Initially the water warms slowly, but then, and crucially, it retains the heat it has absorbed for some long while. Because it is a liquid, mobile entity, it then shifts this captured heat about, three-dimensionally. Under the influence of its currents and its surface winds, it drives the captured thermal energy either laterally, from east to west, or from north to south. Or else, by way of a pattern known as thermohaline circulation, it shifts the heat deep downward into its depths. Since the Pacific is by far the deepest ocean as well as the broadest and longest, the amount of heat it can incorporate within is almost beyond imagination.
Heat, in immeasurable quantities, is stored in the world’s oceans generally. The Pacific, which occupies one-third of the planet’s entire surface area, is responsible, then, for storing a very great deal of it. Much of this stored heat then warms the atmosphere. It does so most especially where the sea is subject to the most intense solar heating, along that wide band of ocean between the tropics and along the equator, a band that shifts to the north and the south as the seasons change.
Within this well-defined area, the intense heat causes the seawater to evaporate and the warm air above it to rise—so gigantic banks of cloud form and billow skyward. As they do so, they lower the air pressure in the void they leave behind them. Cooler and heavier air then pours into the low-pressure zone, from the north and the south. Thanks to the west-to-east spinning of the earth, this air tracks in a more or less westerly direction as it cascades inward: the air from the north heading toward the southwest, the air from the south tracking to the northwest. Since it is the custom to name winds for the direction from which they are coming (whereas currents, confusingly, are named according to where they are traveling to), these inrushings of cool air become the famous trade winds: the northeast trades in the Northern Hemisphere, the southeast trades below the equator.
A great deal goes on within this specific area, where the world’s climatic business begins. It is where the trade winds blow. It is the site of the so-called Intertropical Convergence Zone, where the hot, humid, and (infuriatingly, for those traders who used sailing vessels) windless doldrums lie. It is where all the cyclones, hurricanes, and typhoons are born. It is where the monsoons begin their lives.
In the Pacific portion of this tropical area (which is by far the world’s largest portion, since the Pacific is the sea of greatest extent), a series of curious atmospheric and oceanic events occurs, and which now seems to be most crucial of all to both the marking and the making of cycles of the world’s weather. These events, long known, were once reasonably predictable, and were gathered under the general rubric name of El Niño. Now, though, such occurrences seem to be becoming both more frequent and increasingly irregular. Their timing these days is perhaps somehow linked to the undeniable warming of the ocean, as the global climate (for whatever reason, man-made or not) continues to alter.
These oceanic events have long been marked initially by sudden strange changes in the business of fishing. They have been long recorded, and scrupulously so. As far back as the late sixteenth century, Peruvian fishermen working out of ports in the north of the country (from Tumbes, on the Ecuadorian border, to Chimbote, close to Lima) would make careful note of the changes in the local fish population, since their livelihoods depended on what was taking place.
Chimbote was once known as the World Anchovy Capital, because of the small, silvery, and memorably pungent anchoveta fish that were to be found in staggering abundance in the cold waters just twenty miles offshore. Few fish have ever known such a boom as the Peruvian anchoveta: from the early settlement of the country, fisheries would spring up in every possible harbor along the coast, and thousands of men would work the waters, eventually making the anchoveta the most exploited wild fish in the world. Thirteen million tons of it were hauled into nets in 1971. Most of it was ground into fishmeal and sent off to fertilize fields and feed livestock all across the world.
The abundance of the fish was a fitful thing, though, as the Chimbote fishermen came to know all too well. Once every five or six years, with some ragged regularity, and most usually in November or December, the anchoveta would all but vanish. One day there would be darts of quicksilver shoals all around; the next, nothing but the blue silence of the deep. And there was another thing: the cold waters offshore, which would bring in the evening fogs so welcome in seaside desert towns such as Chimbote, would at the same time become mysteriously warmer. The fogs would vanish, too, and the skies would magically clear.
The want of catch would frustrate the fishermen, to be sure, and they would curse their empty nets. The absence of fish had an effect that then spread insidiously all the way up the food chain. The gannets, cormorants, and pelicans that fed on the anchovies died, or else they flew long distances in search of food, abandoning their nests and leaving their waiting chicks to die in their stead. Squid, turtles, even small sea mammals would pass away also, either because of their intolerance of the warmer water or because of the sudden strange voids in the food chain, spawned by the lack of anchovies. Then, compounding the misery, large numbers of these dead creatures would float to the surface and create small islands of decay, the foul gases they emitted so acidic as to blister the hulls of the fishermen’s boats.
The loss of anchovies was an economic disaster; the smorgasbord of other deaths and absences made the event curious and more sinister. Because the happenings invariably arrived around the anniversary of Christ’s birth, the fishermen would name it, with a bitter and sardonic humor, El Niño de Navidad, the “Christmas Child.”
The term El Niño first appeared in the English language at the end of the nineteenth century—and not so much because of the fishermen’s melancholia, but as a name for the change in the current in the waters below. What happened was that the cold waters of the Humboldt Current, part of the normal pattern of Pacific circulation that powerfully sweeps Antarctic waters northward up along the South American coast before the waters head west along the equator, become on occasion mysteriously disrupted. Instead they are replaced, or nudged farther out to sea, by an irruption of warm water that bullies its way down from the equator—and in the case of the anchoveta, this warm water smothered the upwelling of nutrients on which the little fish fed. The fish then went elsewhere, well beyond the ken of the Peruvian fishermen. They simply vanished from Peru.
Early on it was nothing more than the change of current, this unusual warming of the sea, that came to be named El Niño—and it remained so until oceanographers and climatologists in the mid-twentieth century realized that the change of currents off Peru was just one of many features of a much larger and more important phenomenon, one that had its impact across the entire breadth of the ocean.
Many names are associated with the research that confirmed this. One in particular belongs to a civil servant in British India, Gilbert Walker, who had a meteorological epiphany in 1924 that helped secure what would become the Pacific’s reputation as weather maker for the world.
Sir Gilbert Walker, described in the closing paragraph of his 1958 obituary as “modest, kindly, liberal-minded, wide of interest and a very perfect gentleman,” was a classic of his breed, a polymath of the old school. He was first and foremost a Cambridge mathematician—no less than the 1889 Senior Wrangler, meaning that he had achieved his country’s greatest intellectual achievement of the year. But he was many other things besides: a designer of flutes, a keen student of the boomerang and of the flight paths of ancient Celtic spears, an authority on the aerodynamics of birds’ wings, a passionate advocate of the sports of skating and gliding, a wizard in the more arcane uses of statistics, and a recognized expert on the formation of clouds.
He loved India and the Himalayas, and when he was appointed director-general of observatories in India, he spent twenty years trying (in vain, as it happened) to figure out a mathematical means of predicting monsoons. He had been led to this obsession by a monsoon failure in 1890 that caused a terrible famine. His frustrated quest might well have caused him to leave India somewhat deflated—except that, as it happened, Walker’s work on the monsoon prompted him, during his retirement years, to come up with quite another and rather more globally significant discovery.
He was a habitual collector of what turned out to be colossal tonnages of meteorological statistics. His exhaustive analysis of these, of decades of weather records from all across the British Empire, allowed him to demonstrate incontrovertibly that the El Niño events occurring off the Peruvian coast—the fishermen’s phenomenon was by now well known to scientists around the world—were part of an enormous and all-encompassing transpacific set of weather patterns. These patterns turned out to be mirror-image combinations, in which precisely opposite meteorological manifestations were occurring on one side of the ocean or the other, in one season or another, for one extended period or another.
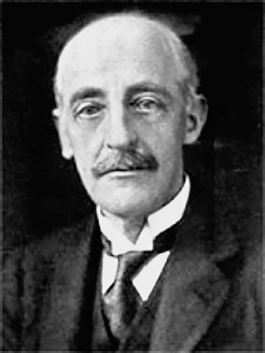
Sir Gilbert Walker, a British meteorologist based for decades in India, is memorialized by one of his discoveries, the Walker Circulation, a main driving atmospheric force behind the making and unmaking of the cyclical El Niño phenomenon.
Periods of warming here led to episodes of cooling there. The Peruvian sea starvation during a locally warm-sea El Niño event would in time be followed by a local sea cooling and return to abundance, and that would be called (keeping to the Christmas-themed naming practice) a La Niña time. Floods on one side of the ocean led to droughts on the other. There were periodic swings in weather and in the human response to it. There were times when there were more cyclones and times when there were fewer. Some years when the Indian monsoon never happened, the fields were parched and crops failed. Other years were marked by luxuriant summertime drenchings. There were years of famine and years of abundance, of dust bowl summers and harvest-rich autumns, years of concomitant prosperity and ruin, periods of consequent peace and turmoil—within the Pacific, around the Pacific’s coasts, and even, perhaps, beyond them and around the globe.
And all of it—Sir Gilbert Thomas “Boomerang” Walker realized through all his Renaissance man amusements of flutes and bird flight and skating techniques—was due to a hitherto unseen natural phenomenon. Walker declared that what drove the regular and dramatic changes in the Pacific weather must be some kind of repeating mechanism high up in the atmosphere. Whatever it was, this pattern of invisible winds and movements seemed to him to operate as a kind of unseen atmospheric seesaw, a beam engine balance around a central pivot lying somewhere smack dab in the center of the ocean.
The axis seemed to hover where the International Date Line crossed the equator, in the middle of that sprawl of limestone specks then known as the Gilbert Islands and the Phoenix Islands, now the Republic of Kiribati. Up on one side of this fulcrum meant down on the other; high pressure here meant low pressure there; hot here, cool across the other side; cruelly wet in this place, bone dry in that. It had a beautiful logic to it; and measurements taken over the years that followed have proved that Walker was exactly right.
This transpacific atmospheric wind pattern he discovered was in time to be named, and in his honor, the Walker circulation. This was the engine, the mechanism, that then produced what Sir Gilbert himself went on to name, for the back-and-forth, hot-and-cold, wet-and-dry, stormy-and-serene periods that appeared to dominate the tropical Pacific’s weather: the Southern Oscillation.
ENSO—the acronym is formed from the combined initials of the El Niño and the Southern Oscillation—denotes what today is recognized as undeniably the planet’s most important climatic phenomenon. If the Pacific is truly the generator of the world’s weather, then ENSO represents the turbines that give it the power to do so. And the Walker circulation is the force that sets the turbines spinning in the first place.
The Walker circulation’s basic structure is made up of long-lasting cells of pressure in certain places around the ocean. The eastern Pacific generally has high atmospheric pressure. Correspondingly, the western Pacific generally has a large low-pressure area, most notably around the sea-spattered islands of Indonesia and the Philippines, the area that oceanographers and meteorologists like to call, if oxymoronically, the Maritime Continent. The air above the ocean then moves, as physics demands, from the high-pressure area to the low—in other words, from east to west. The trade winds at the surface, which blow nearly constantly in this direction, are of course this movement’s very visible and familiar manifestation.
As the winds blow in this manner, they help push the warm waters of the tropical seas below them in the same direction. Incredible though this may sound, the sea then piles up very slowly and deliberately as a huge wave of water passes steadily across and into the western reaches of the ocean. The western Pacific can sometimes be a full two feet higher than the waters in the east. Some of this warm water evaporates as the huge cyclonic storms and typhoons, such as Tracy and Haiyan, form over the western seas. Some of it dives deep back into the ocean, cools, and is returned to the east by the work of deep ocean currents. In a normal series of years, this pattern is repeated again and again: the Walker circulation of the air above, the migration of the seawater below, the explosive growth of storms in the far western Pacific, the return of the cool and dry air and upwelling cool water (and with them the anchovies) to the Pacific east. As a result, calm and stability reign.
But sometimes, and for some still unexplained reason, the Walker circulation changes. The trade winds weaken or falter or even reverse their direction, and then an El Niño period occurs, and the system changes with it, and dramatically. It can sometimes strengthen in the opposite manner and with equal drama—and then the reverse, the phenomenon of La Niña, dominates the weather picture instead. Tracking and measuring the arrival of the two phenomena, El Niño and La Niña, have lately become major elements in worldwide weather forecasting and climate modeling. It is safe and reasonable to say that in the computation of the planet’s weather, all eyes are on the happenings in the Pacific and the behavior of the Southern Oscillations. For as the Pacific oscillates, so oscillates the world.
These days the Southern Oscillation that Gilbert Walker defined is measured by the careful tracking of the atmospheric pressures and the sea temperatures in the region. Pressure is measured at two key points: one in Tahiti, the other down in Darwin. If the pressure in Tahiti falls significantly below what is normal, and at the same time the pressure in Darwin rises above what is normal, then an El Niño period is declared to be under way. The American and the British weather services also like to measure sea temperature along the narrow equatorial zone that is (in more ways than one) central to the development of an El Niño. If the water temperature in the eastern part of this region (that closest to the South American coastline) rises by half a degree Celsius, and if, in accordance with the British weather researchers’ rules, it then holds that temperature for nine full months, then an El Niño is declared to be under way.
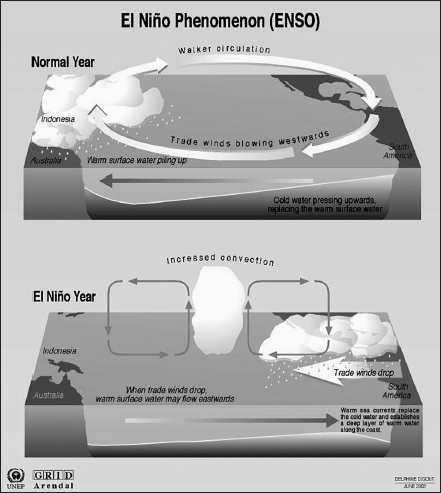
The El Niño Southern Oscillation, ENSO, is a still unpredictable and irregularly cyclical movement of waters and winds in the Pacific Ocean south of the equator, and a factor that determines much of the world’s major weather patterns.
National Oceanic and Atmospheric Administration (NOAA).
The Japanese government in particular is investing millions in its own studies of El Niño, and for good reason. Japan has historically been a magnet for highly destructive Pacific typhoons, storms that, along with the earthquakes, tsunamis, and volcanic eruptions that bring regular ruin, have helped forge the national character traits of stoicism and mutual philanthropy. Forecasting such traumatic occurrences would of course be a fine thing, for the national economy, for the nation’s morale. The recent accelerating ability to forecast the eruptions of volcanoes may still not have been matched by an ability to predict earthquakes. But to balance that, a major effort is now being made in Japan to fine-tune global long-term weather forecasting, and in particular to investigate the possibilities of predicting when an El Niño—with its clustering of typhoons—is most likely to occur.
This task is being handled by what has been claimed variously to be one of the world’s largest, most powerful, fastest, and most efficient supercomputers. It is grandly known as the Earth Simulator 2, and it is sited in a suburb of Yokohama, west of Tokyo, in the offices of JAMSTEC, the Japan Agency for Marine-Earth Science and Technology.
As a record breaker, the Simulator has recently been knocked off its perch by a new superfast machine in China, but it is still a remarkable and home-built device, which keeps being improved and upgraded: currently it can calculate at the rate of 122 teraFLOPS (122 trillion floating-point operations per second). A recent live test—which was conducted in its building with no more than the usual electrical hummings and air-conditioning whirs and the flashing of thousands of light-emitting diodes, and with only the operators squinting rather tensely at their terminals hinting at any anxiety—showed that the contraption can produce global weather analyses of witheringly complex detail: several times a day it can produce a three-dimensional map of the world’s atmosphere, showing the climatic details every three miles horizontally and through more than one hundred slices of the atmosphere vertically.
It is so costly a creation, and Japan is so seismically unstable an island chain, that its guardians protect it as if it were the Mona Lisa or the Hope Diamond. It has its own building mounted on gimbals and rubber feet; metal-mesh ceiling nets to diffuse lightning strikes; and special metal shields to keep stray magnetic fields at bay.
Swaddled in care, Japan’s Earth Simulator quietly crunches away at the numbers of what it sees. Its operators continue to try to divine, as do many others in similar laboratories around the world, whether the onset of an El Niño or a La Niña can be declared not merely under way but about to happen. Can it be predicted, in other words, just like any other weather forecast?
Most recently the Japanese team working on El Niño has been able to show that the onset of an ENSO warm phase is often preceded by a machine-gun-like series of small and intense storms north of Australia, in the waters off Papua New Guinea. The storms are small enough to be known as westerly wind bursts; and though for a while they were dismissed as random events, unconnected to the happenings on the far side of the ocean, nowadays scientists believe they may be linked. But as to whether they indicate the onset of an El Niño, or whether they are the result of the onset of an El Niño, is a matter of much debate in the meteorological community.
No one yet has come up with a way to forecast the onset of ENSO—which is a major concern at a time when the worldwide weather has become such a worldwide obsession. For El Niños wreak havoc everywhere.
Locally, their effects have been noticed for centuries. The first is familiar, but it bears repeating: the inflow of warm water in the eastern Pacific halts the cold upwelling rush of nutrients; all the anchovetas vanish from the waters off Peru; other sea creatures die; noxious gases from rotting marine carrion bubble up from the sea; boats have their paint blistered by the scum of acidity.
Globally, a host of other phenomena can develop in tandem, all probable knock-on effects of these particular changes in this, the world’s biggest expanse of seawater. The expanse, it is worth restating also, of heat-catching seawater—for the catching of solar heat is ultimately what this meteorological drama is all about.
So during an El Niño* there can be, among other things, major flooding on the South American west coast (with the current-warmed humid breezes rising above the Andes, the humidity condensed and then precipitated out as rain or snow). During this phase, there can be droughts in northern Brazil, but severe rainstorms near Rio. Cyclones and typhoons tend to form in the Pacific more centrally than usual during an ENSO warm phase, and since the storms spend longer times tracking their way westward over larger expanses of warmer seas, they can grow and accelerate and deepen, and thus can be much more violently destructive when they finally reach land.
The 1982–83 El Niño, one of the strongest ever known, was memorable for its cascade of events. The trade winds weakened. Sea levels in the eastern Pacific began to rise (up to a foot higher along the coast of Ecuador). Eastern sea temperatures shot up. Fur seals and sea lions began to die off the coast of Peru. Deserts in eastern South America were drenched with rain, grasshoppers swarmed, toad populations went through the roof, mosquitoes came in clouds, and malaria cases skyrocketed. There were droughts and forest fires in Java, terrible storms wracked the coastline of California, there was flooding in the American Deep South, ski resorts in the American Northeast reported warmer weather and lackluster business. All told, the economic cost of the 1983 El Niño was estimated by the U.S. government at eight billion dollars—and of course for every malaria-related death in Ecuador or for every village burning in Sulawesi, boundless misery.
That was an extreme event. Even during a modest El Niño the effects can be widespread and unexpected. Drought can affect Hawaii, drastically lowering the sugar crop (and before 2009, when Dole pulled its business out, the pineapple crop, too). Forest fires can and do sweep across Borneo; monsoon-dependent crops can wither and fail in India. Sea lions and elephant seals die in the waters off California; unanticipated fish and squid appear in the waters off Oregon and British Columbia. A supposedly moderate El Niño in 1877 triggered a two-year drought in China and the deaths of nine million people from starvation. The polar jet stream can be nudged farther southward during an El Niño event, making winters in Canada more acutely cold, forcing more rain to fall in the southern states, cooling everything down—and shortening the growing season for Florida oranges. Northern Europe is colder and drier, Kenya wetter, Botswana drier. The effects are legion, the lists endless (and at times, seemingly contradictory), the concerns global.
And the matter of global warming is a constant concern, underpinning or overlaying everything. The differing scales of the events involved are irksome to those employing statistics to help spot trends and links. The wildly complex mechanics of an El Niño oscillation occur over fairly short intervals, for instance. The best-known parts of that equation, the Walker circulation and the ENSO, operate at fairly short intervals, in three- or four- or five-year cycles.
It can become very much more complicated than this. Yet other, more arcane atmospheric and oceanic phenomena—such as the Kelvin waves and Rossby waves that move quantities of ocean hither and yon around the subsea boundary between warm and chill waters known as the thermocline—are similarly swift in their operation. As are the so-called Hadley cells and their more northerly cousins, the Ferrel cells, which operate in the atmosphere rather than the sea, and which bring much rain, and swirl about under the majestic impress of that westward and world-dominating force which was discovered in Victorian times by the Frenchman Gustave-Gaspard Coriolis, and which bears his name today.
All these named phenomena operate in relatively rapid, time-lapse motions. As does a final main, named component of the entire Pacific process, and perhaps the fastest of them all: it is known as the Madden-Julian Oscillation. This is best described as a traveling wave of unusual atmospheric behavior. When functioning as normal, it brings periods of hot storms and blustery rains to the tropical western Pacific, and it does so every thirty to sixty days.
Global warming, though, operates with very much more languor than this. Most mathematical models suggest that the central tropical Pacific will not rise in temperature by three degrees Celsius* until the end of the twenty-first century. At the same time, the level of the sea will have risen between one and three feet, according to the Intergovernmental Panel on Climate Change. How will those two long-term changes affect, or else be affected by, the El Niño warm phases expected during the remaining decades of the century? It would be at least convenient to know this, because the world’s weather is entirely born of this phenomenon, and substantial changes like these either are caused by it or are the cause of it.
Little is certain, though the computers hum. One recent observation that has produced consistent enough results to be called a discovery is that the Walker circulation, Sir Gilbert’s lasting legacy, has steadily weakened over the last sixty years. Moreover, it has done so, with weakening trade winds its most obvious demonstration, at a rate that is entirely consistent with the rising temperature of the Pacific’s surface. And as will be recalled, a weaker Walker circulation is linked with the start of an El Niño warm phase—which suggests, to put it most crudely, that if this trend persists, the world could find itself in a state of more or less permanent El Niño conditions.
And that, with its corollary of ever more extreme weather events in the western Pacific and over the North American continent (to say nothing of a total permanent collapse of the Peruvian fishmeal industry), could cause long-term changes to human behavior, to the siting of cities, to the planting of crops. But little is certain. Thanks to the new computers, and to the fascination with Pacific weather, global forecasting is less of a crapshoot than once it was. But out in the Pacific it remains a mystery of daunting complexity.
Yet a consensus of a sort appears to be building. It is all to do with heat, with the radiation from the sun, and with the manner in which the planet deals with it. Not a few climatologists are coming now to believe that because of its immense appetite for absorbing the solar heat, the Pacific could in time actually be seen as the savior of the world’s living creatures. It will be so by taking in all that destructive heat from the sun and from the excesses of carbon emissions and, rather than allow it to scorch dead the inhabited earth, employ it to warm itself up, slowly and sedately, as befits the dominant entity on the planet, and thereby enable itself to carry the world’s heat burden on its own.
The effects of all that absorption of warmth will be locally dramatic, for sure. As the American admiral fretted, there will be bigger and more destructive typhoons; there will be more super Tracys, more stupendous Haiyans. There will perhaps be a more urgent need to evacuate islands that will be inundated more swiftly than was thought. Maybe there will be bigger snowfalls in the Cascades and the Sierra. Maybe no anchovies will ever be caught again off Peru. Maybe the forests of Sarawak will be consumed by fire.
Locally, there will be mayhem. But globally, less so. The planet, perhaps, will manage to heal itself. The world and its creatures will survive, and all will eventually allow itself to come back into balance, just as the geologic record shows that it survived and returned to balance after any number of previous cycles of excess and danger. And once that happens, the Pacific Ocean will be seen, uniquely, for what many climatologists are coming to believe it to be: a gigantic safety valve, essential to the future of the planet
The ocean’s monstrous size puts it in a position to let the planet go thermally wild for a time, to wobble dangerously. But then, like a formidable gyroscope, the Pacific will dampen the excess, will help bring sanity back, and will restore calm, serenity, and normality.
The Pacific Ocean as the world’s pacifier—the thought is maybe born of all too little science. But it is a thought endowed with poetry, and is now held by many. And in the gloom-dimmed world of today, even such a thought is surely a most welcome one.