We head over to terminal now and then go to the e-commerce-app folder. Navigate to the online-store folder and start the gateway application in dev mode:
> cd online-store
> ./gradlew
This will start our Gateway application on port 8080. Let's open http://localhost:8080 in our favorite browser:
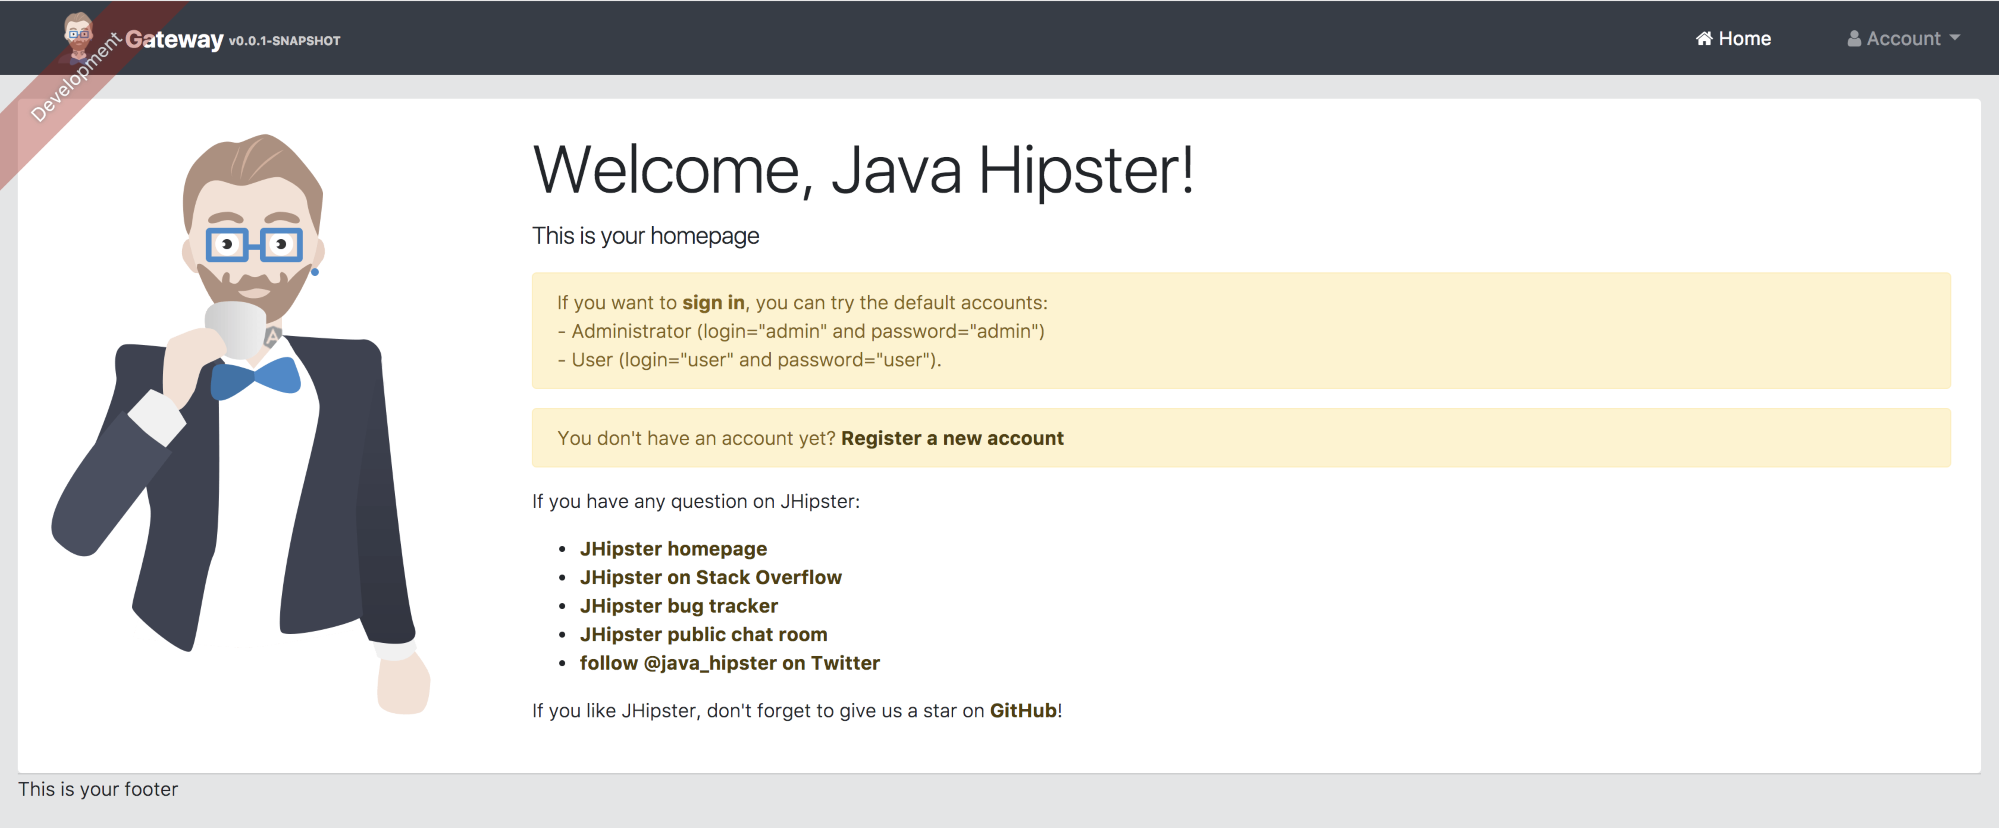
Then we can click on the sign in button on the home page or Account/sign in from the top menu, and then enter the username and password as admin and admin respectively.
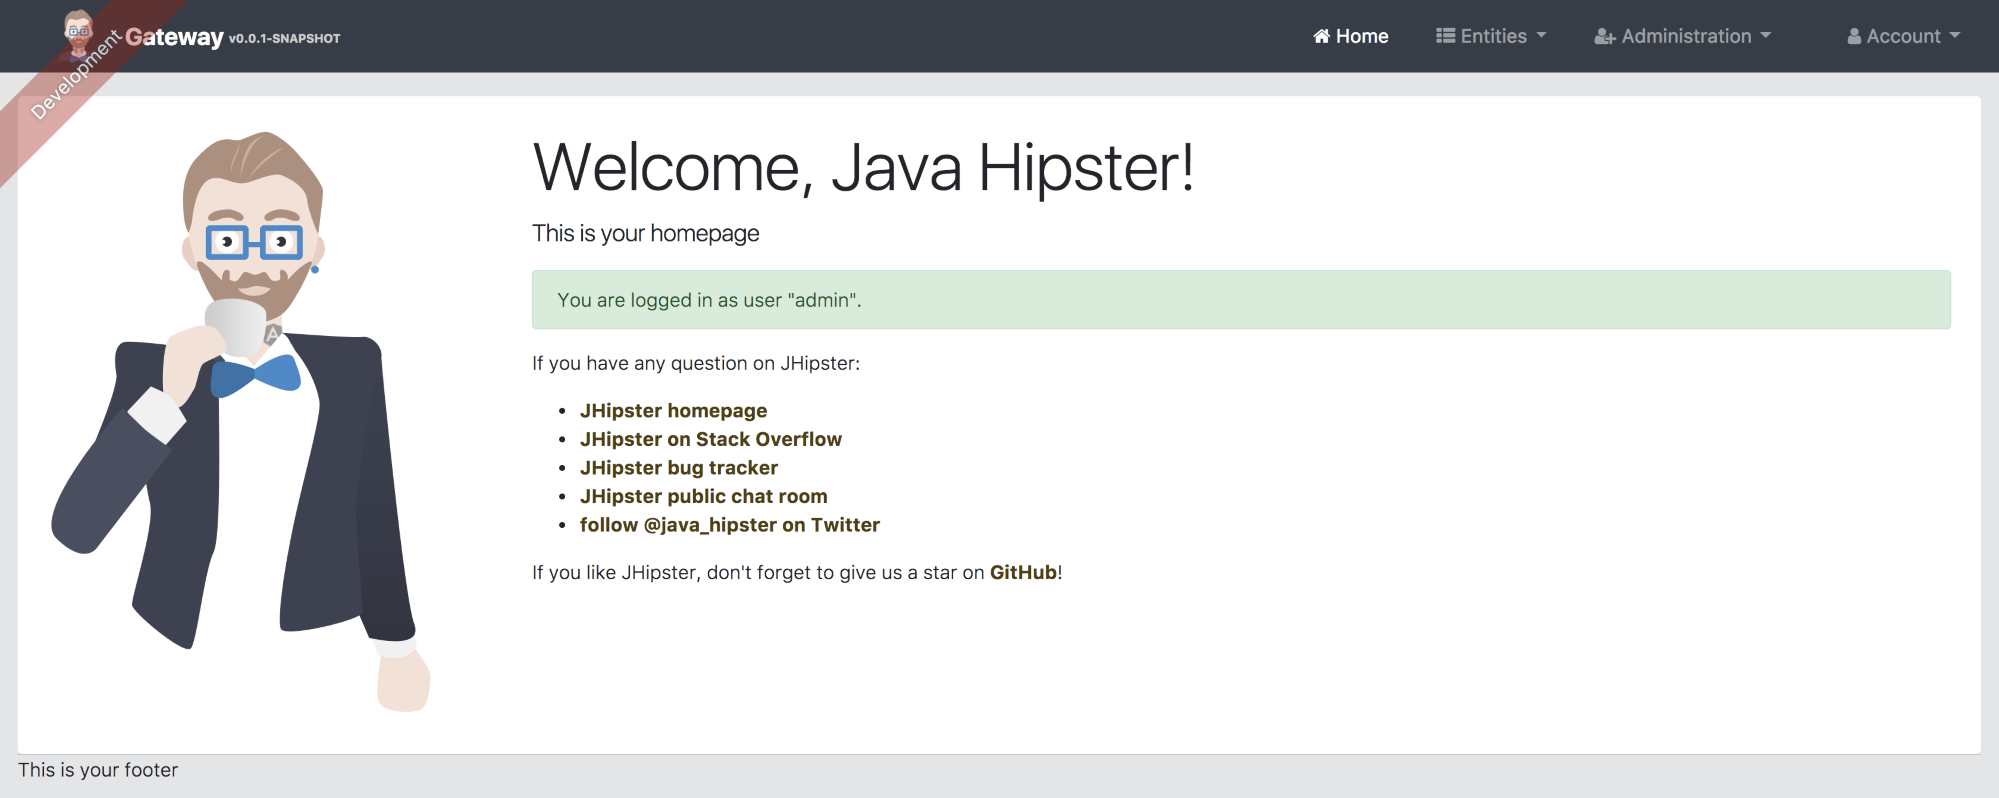
Once logged in as an admin user, you can see the administration menu:
In the administration menu, you can find the following pages:
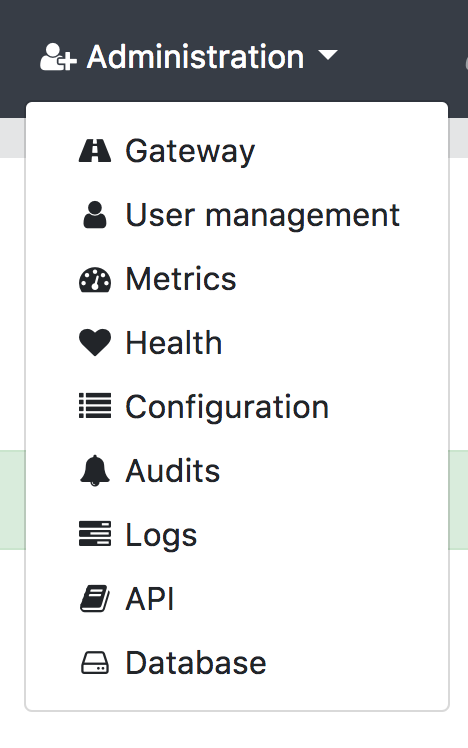
This includes the following:
Gateway: The Gateway page will show the list of microservice applications for which this application acts as a gateway. It will also show the routes and the services that handle the route, and the available servers for the route:
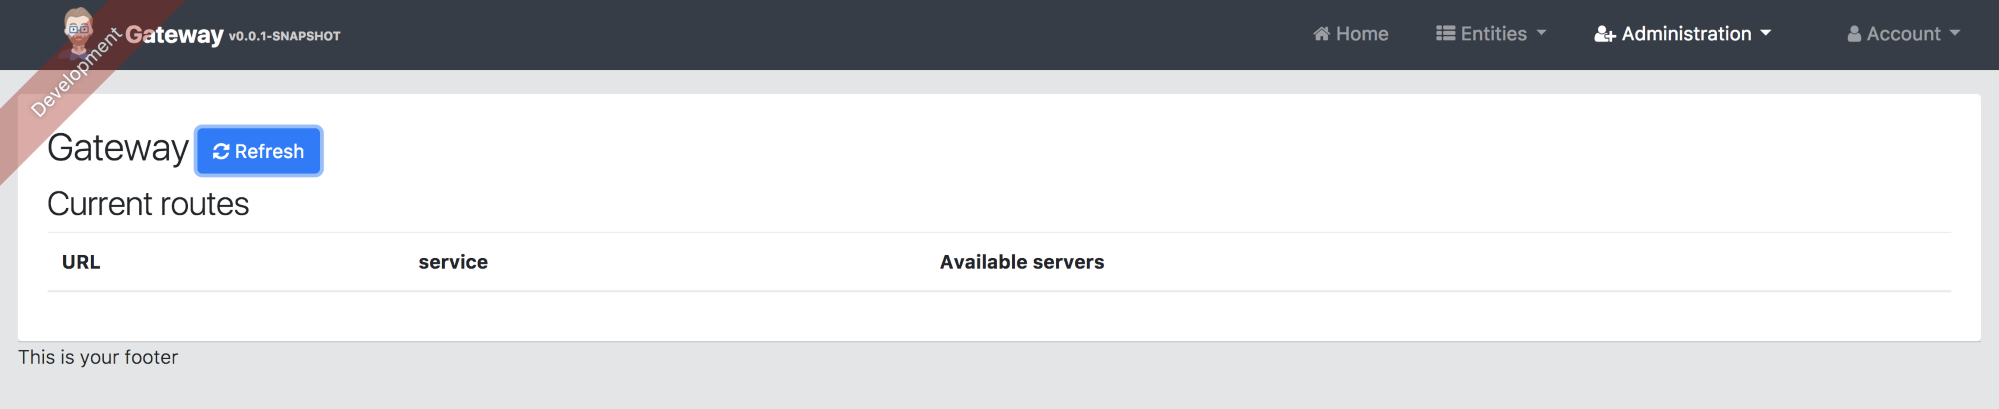
Currently, there is no microservice application booted up, so the page is empty. We will see how this page is changed once we start our notification and invoice services.
User management: This is similar to monolithic user management and holds the basic user information and management.
Metrics: The Metrics page holds the information about JVM metrics and service/DB statistics. This is, again, similar to the monolithic application. Added to that, this also shows the metric statistics for the microservice applications registered.
Health: The Health page shows the basic health information of the various services that we have in our application:
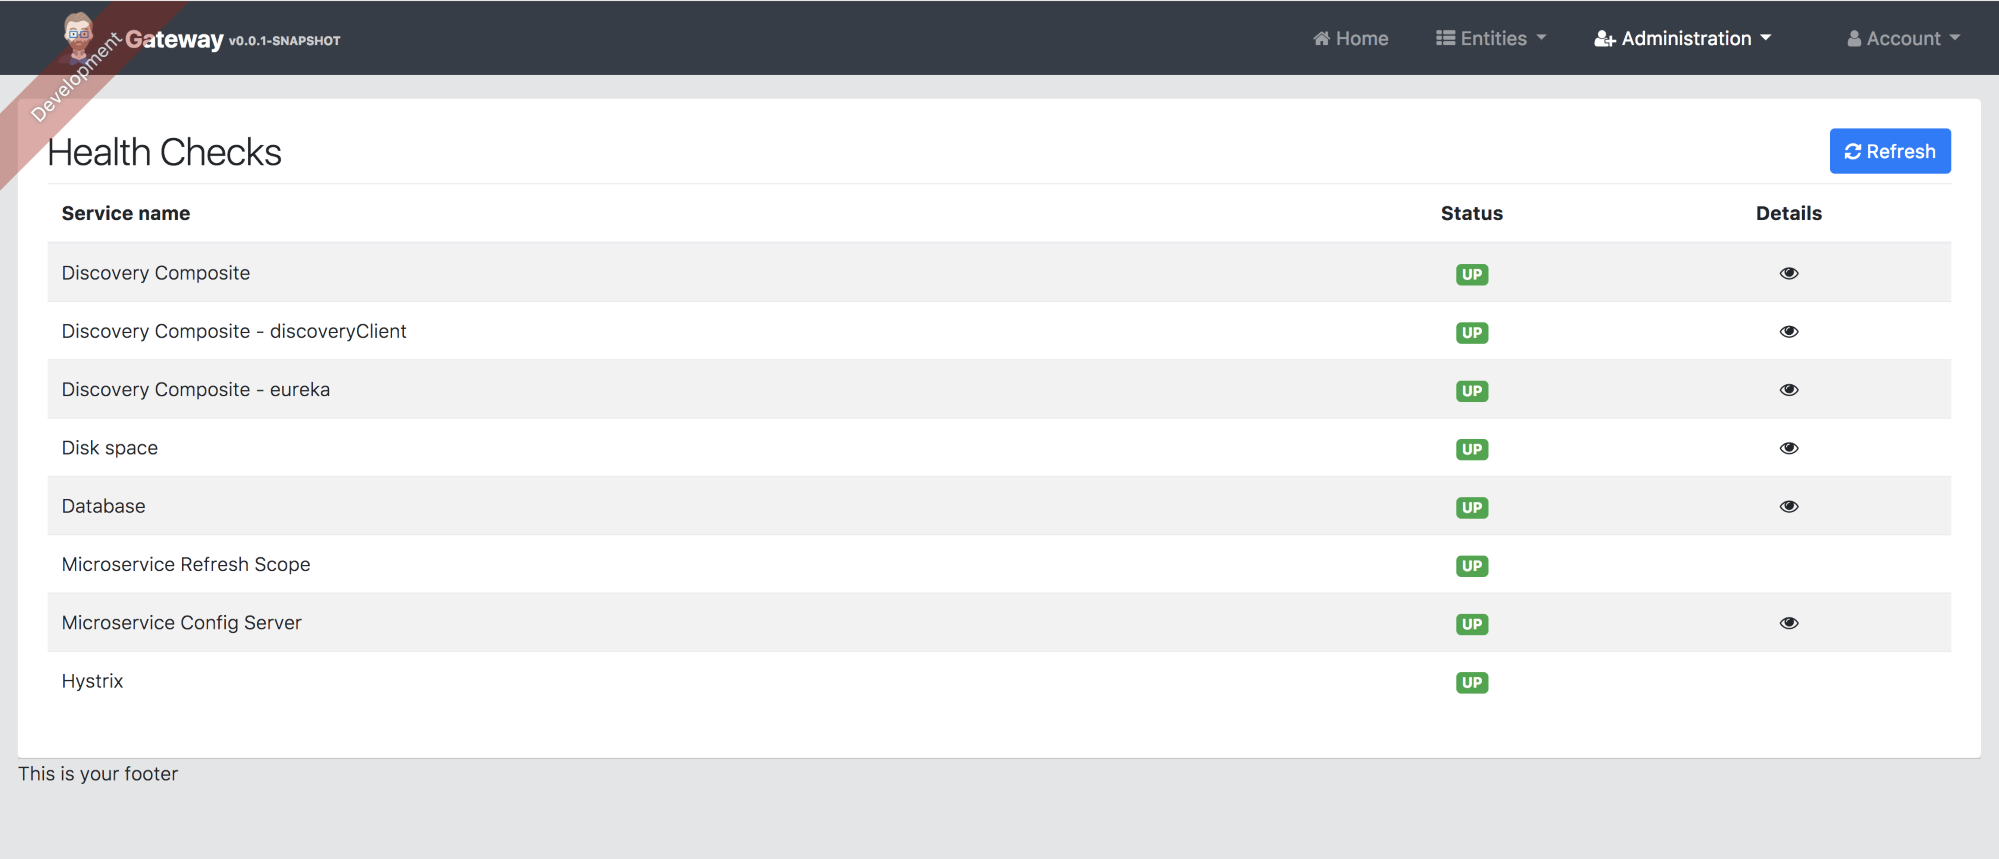
Similar to the monolithic application, it shows Disk space and Database. But added to that it also shows the health of the Discovery network (that is, the discoveryClient and the Eureka server). It also shows the microservice config server's health, which is spring-cloud-config-server, and then shows the health of the circuit breaker we use (Hystrix).
Configuration, Audits, Logs, and API pages are similar to the monolithic application we saw earlier.