JHipster also provides a console application based on the ELK stack, which can be used for logs and metrics monitoring of the application. JHipster Console is another open source application. It is really useful and provides some nice dashboards to visualize the application. As with other JHipster products, it is much easier to get started with the JHipster Console.
Let's go back to our book folder, and then clone the JHipster console project from GitHub (https://github.com/jhipster/jhipster-console):
> git clone https://github.com/jhipster/jhipster-console
Before we start our console, we need to make our applications log the metrics and log into the console. To make that happen, we need to change a few settings in our applications and then restart them.
Let's go to our application-prod.yml file in all the applications (gateway and microservices application) and enable the logstash and logs:
metrics: # DropWizard Metrics configuration, used by MetricsConfiguration
    ...
    logs: # Reports Dropwizard metrics in the logs
        enabled: true
        report-frequency: 60 # in seconds
logging:
    logstash: # Forward logs to logstash over a socket, used by LoggingConfiguration
        enabled: true
        host: localhost
        port: 5000
        queue-size: 512
Set enabled to true in metrics.logs.enabled and also logging.logstash.enabled. This will push the logs to the console application. JHipster Console will collect this information and show it in nice-looking dashboards with the help of Kibana.
Once cloned, we can go into this folder and then start the jhipster-console with the help of docker-compose:
> cd jhipster-console
> docker-compose up -d
That is it. Your console is running on http://localhost:5601.
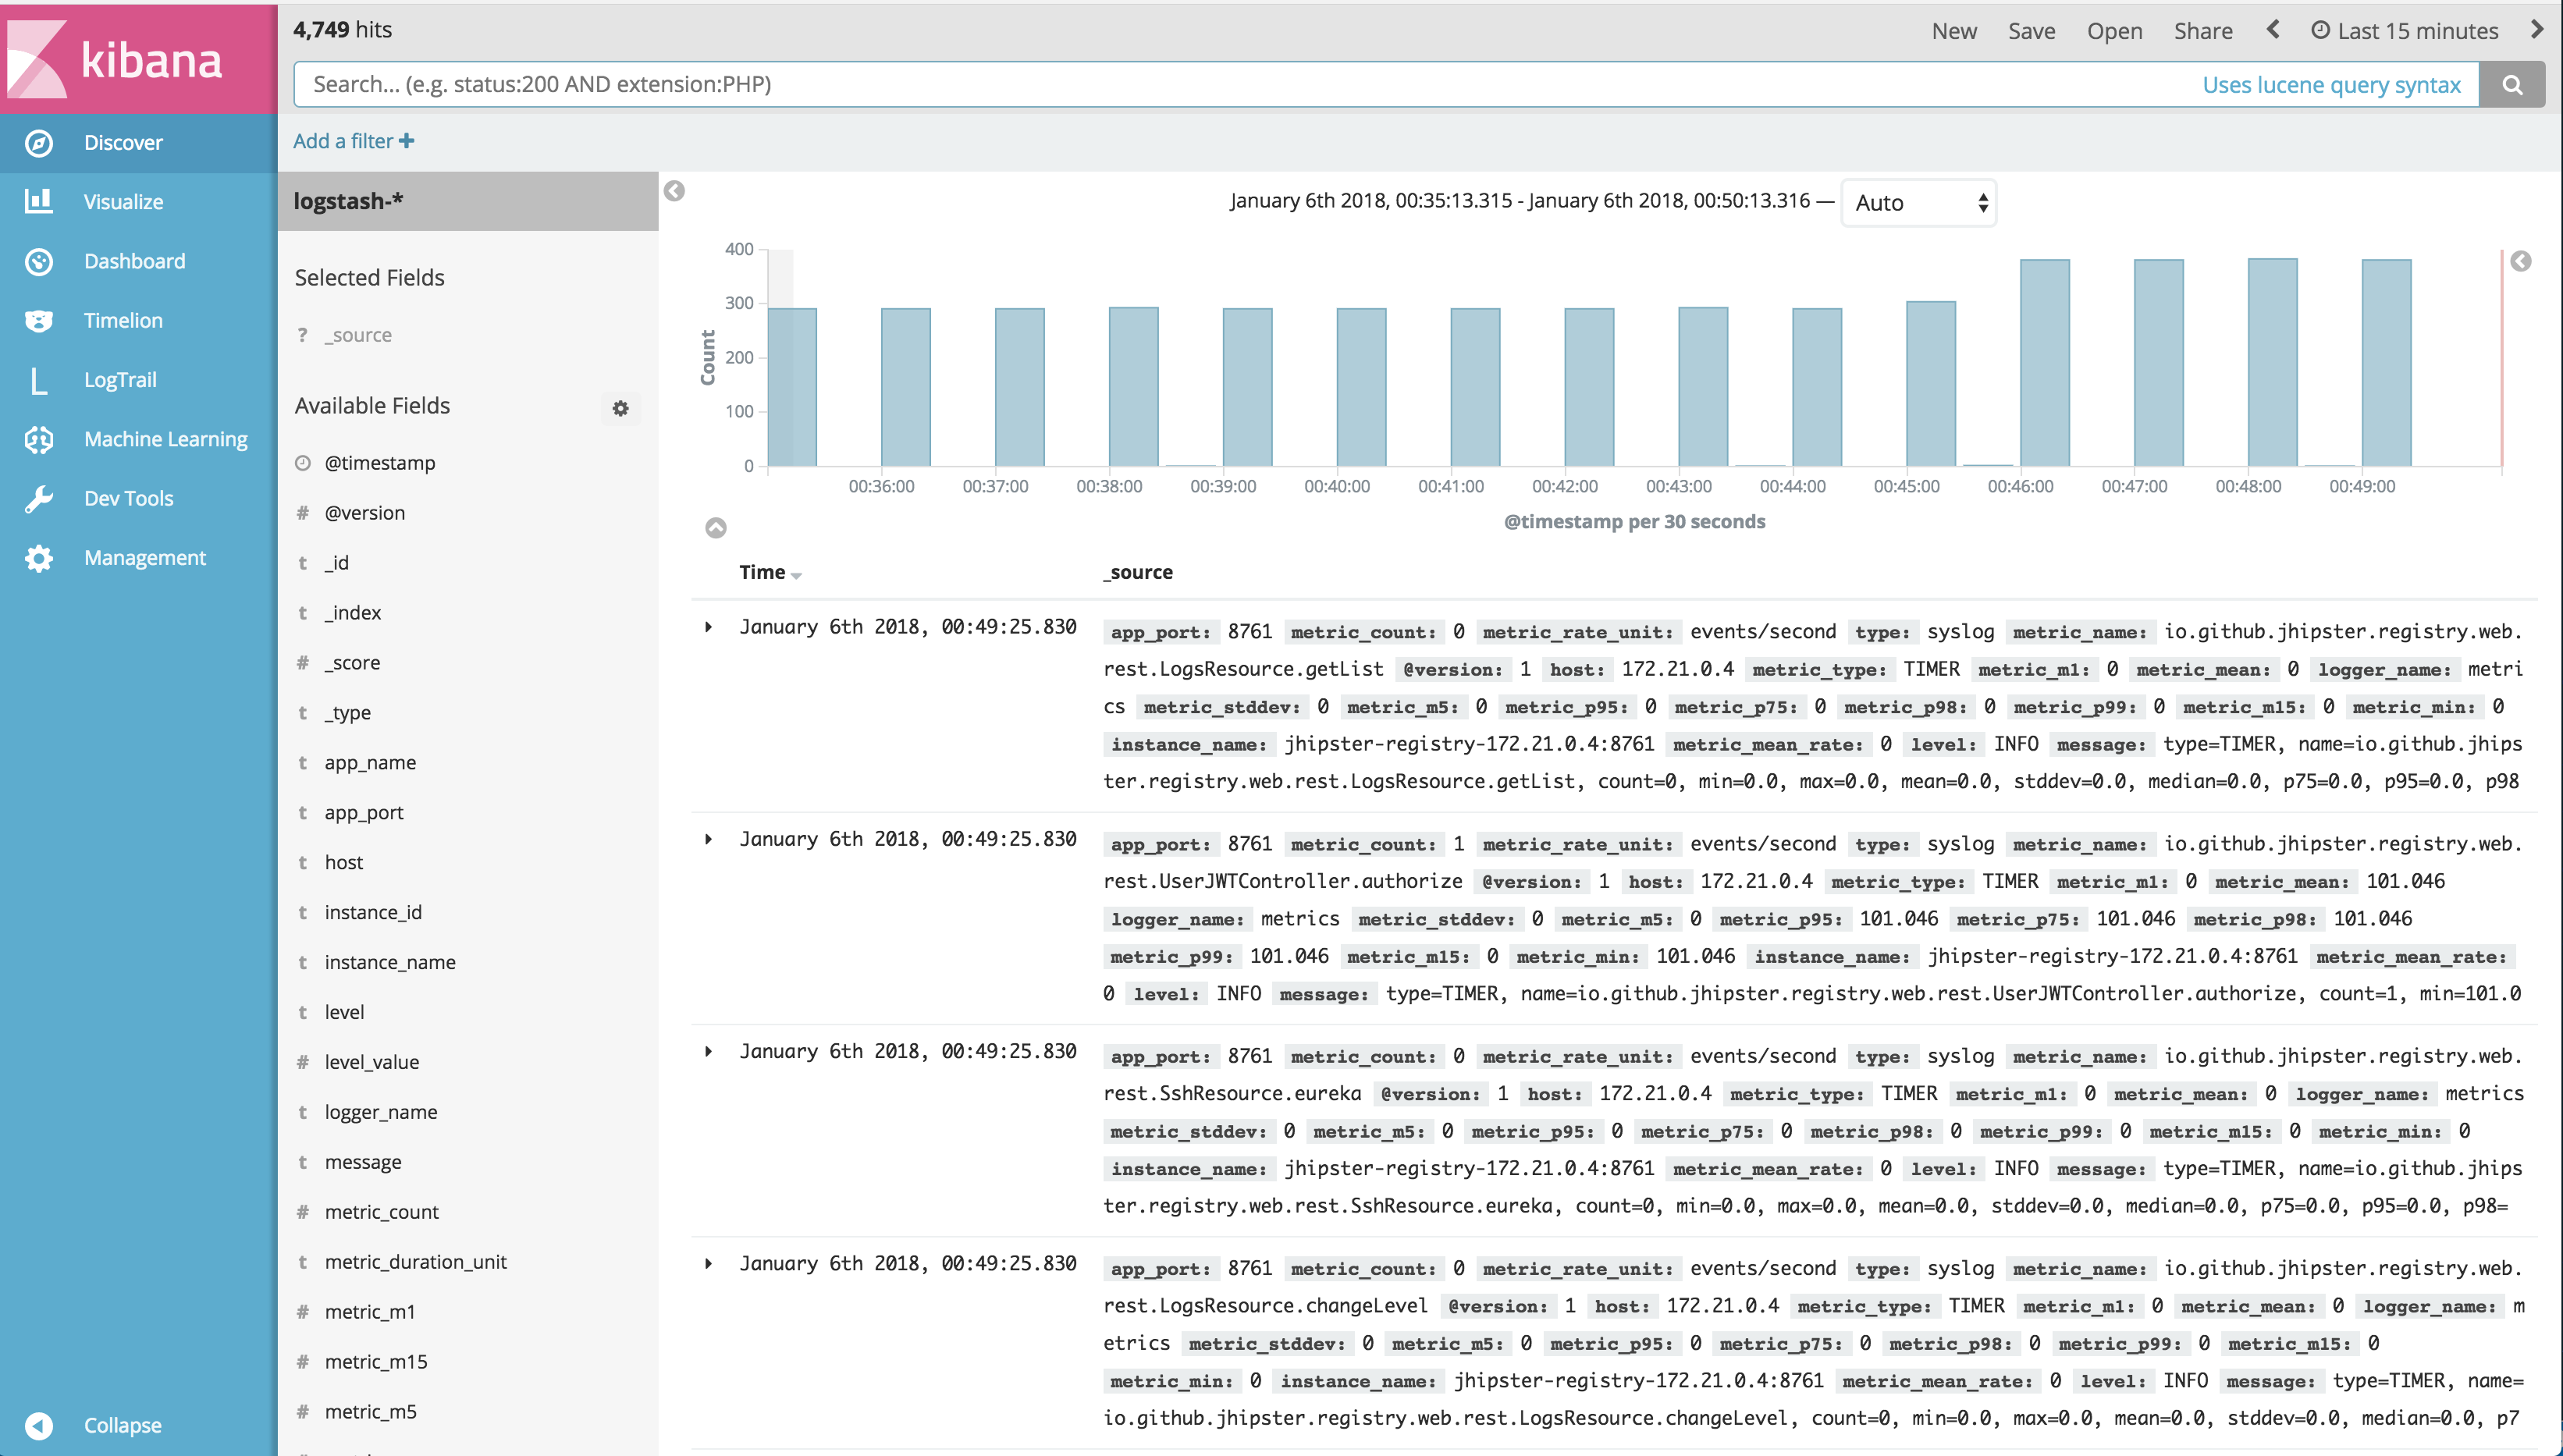
Kibana provides the following (customizable) dashboards:
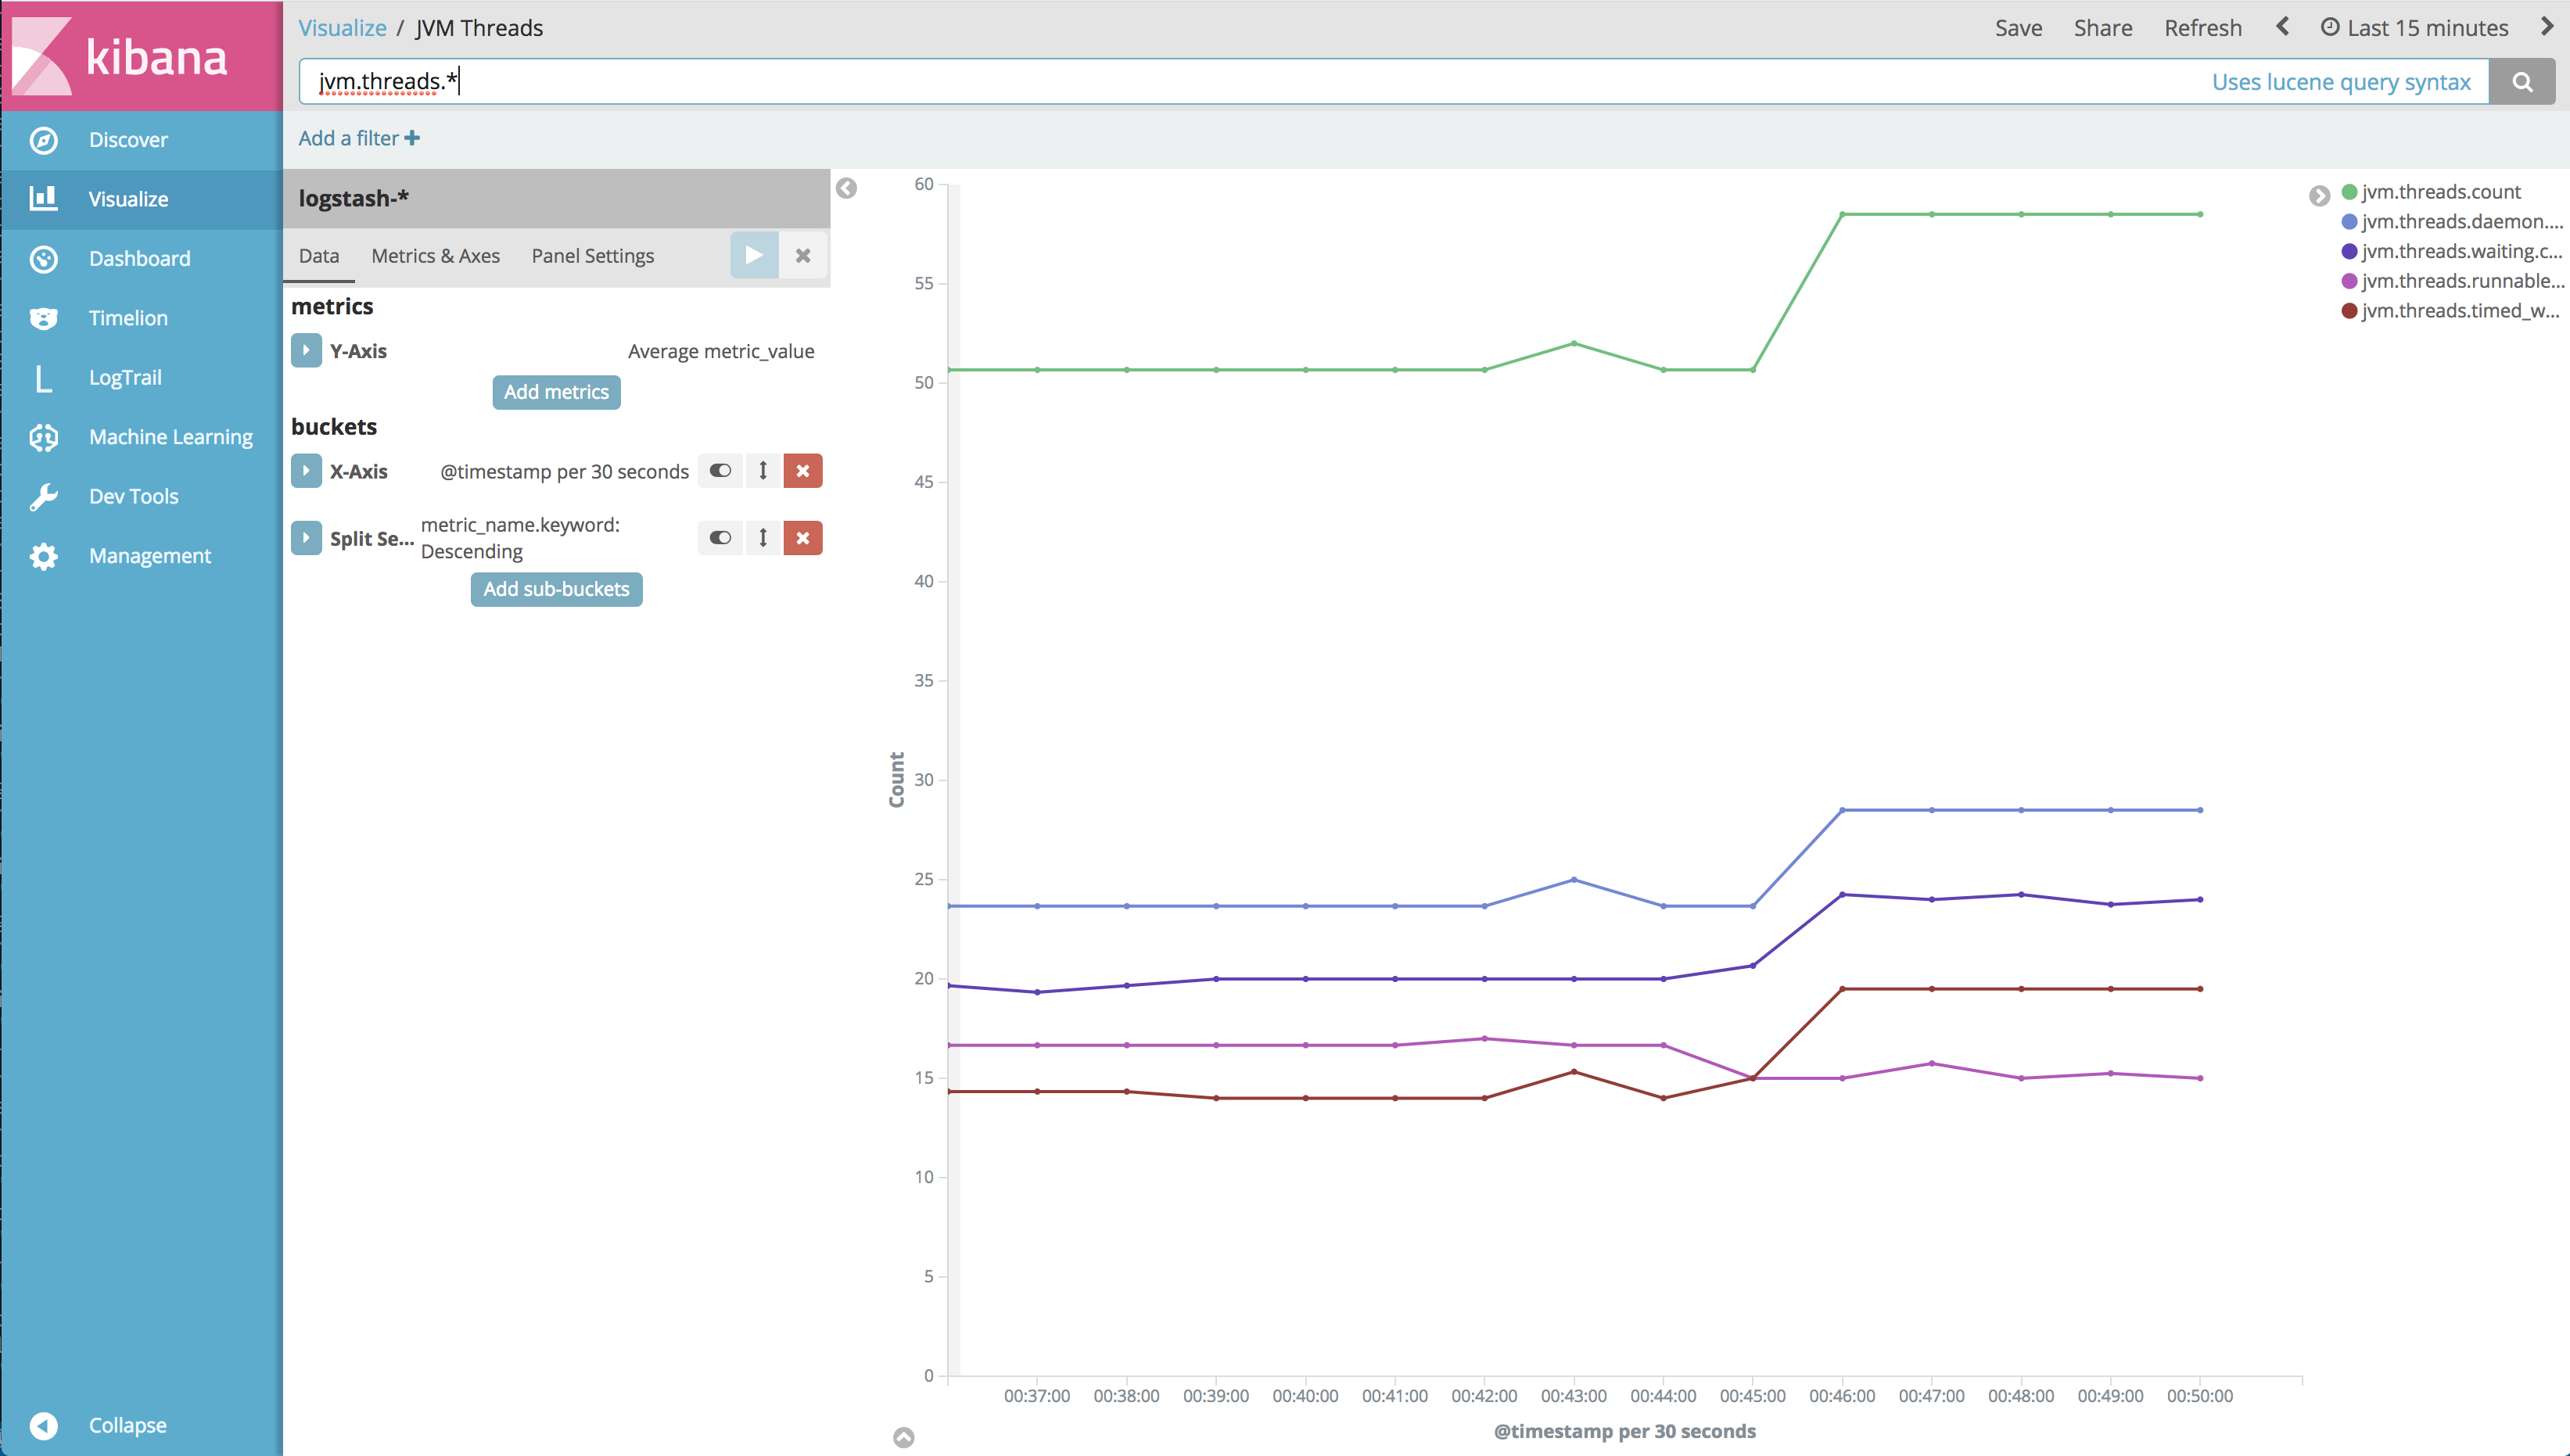
Kibana also provides application-level metrics, such as JVM threads metrics and other details:
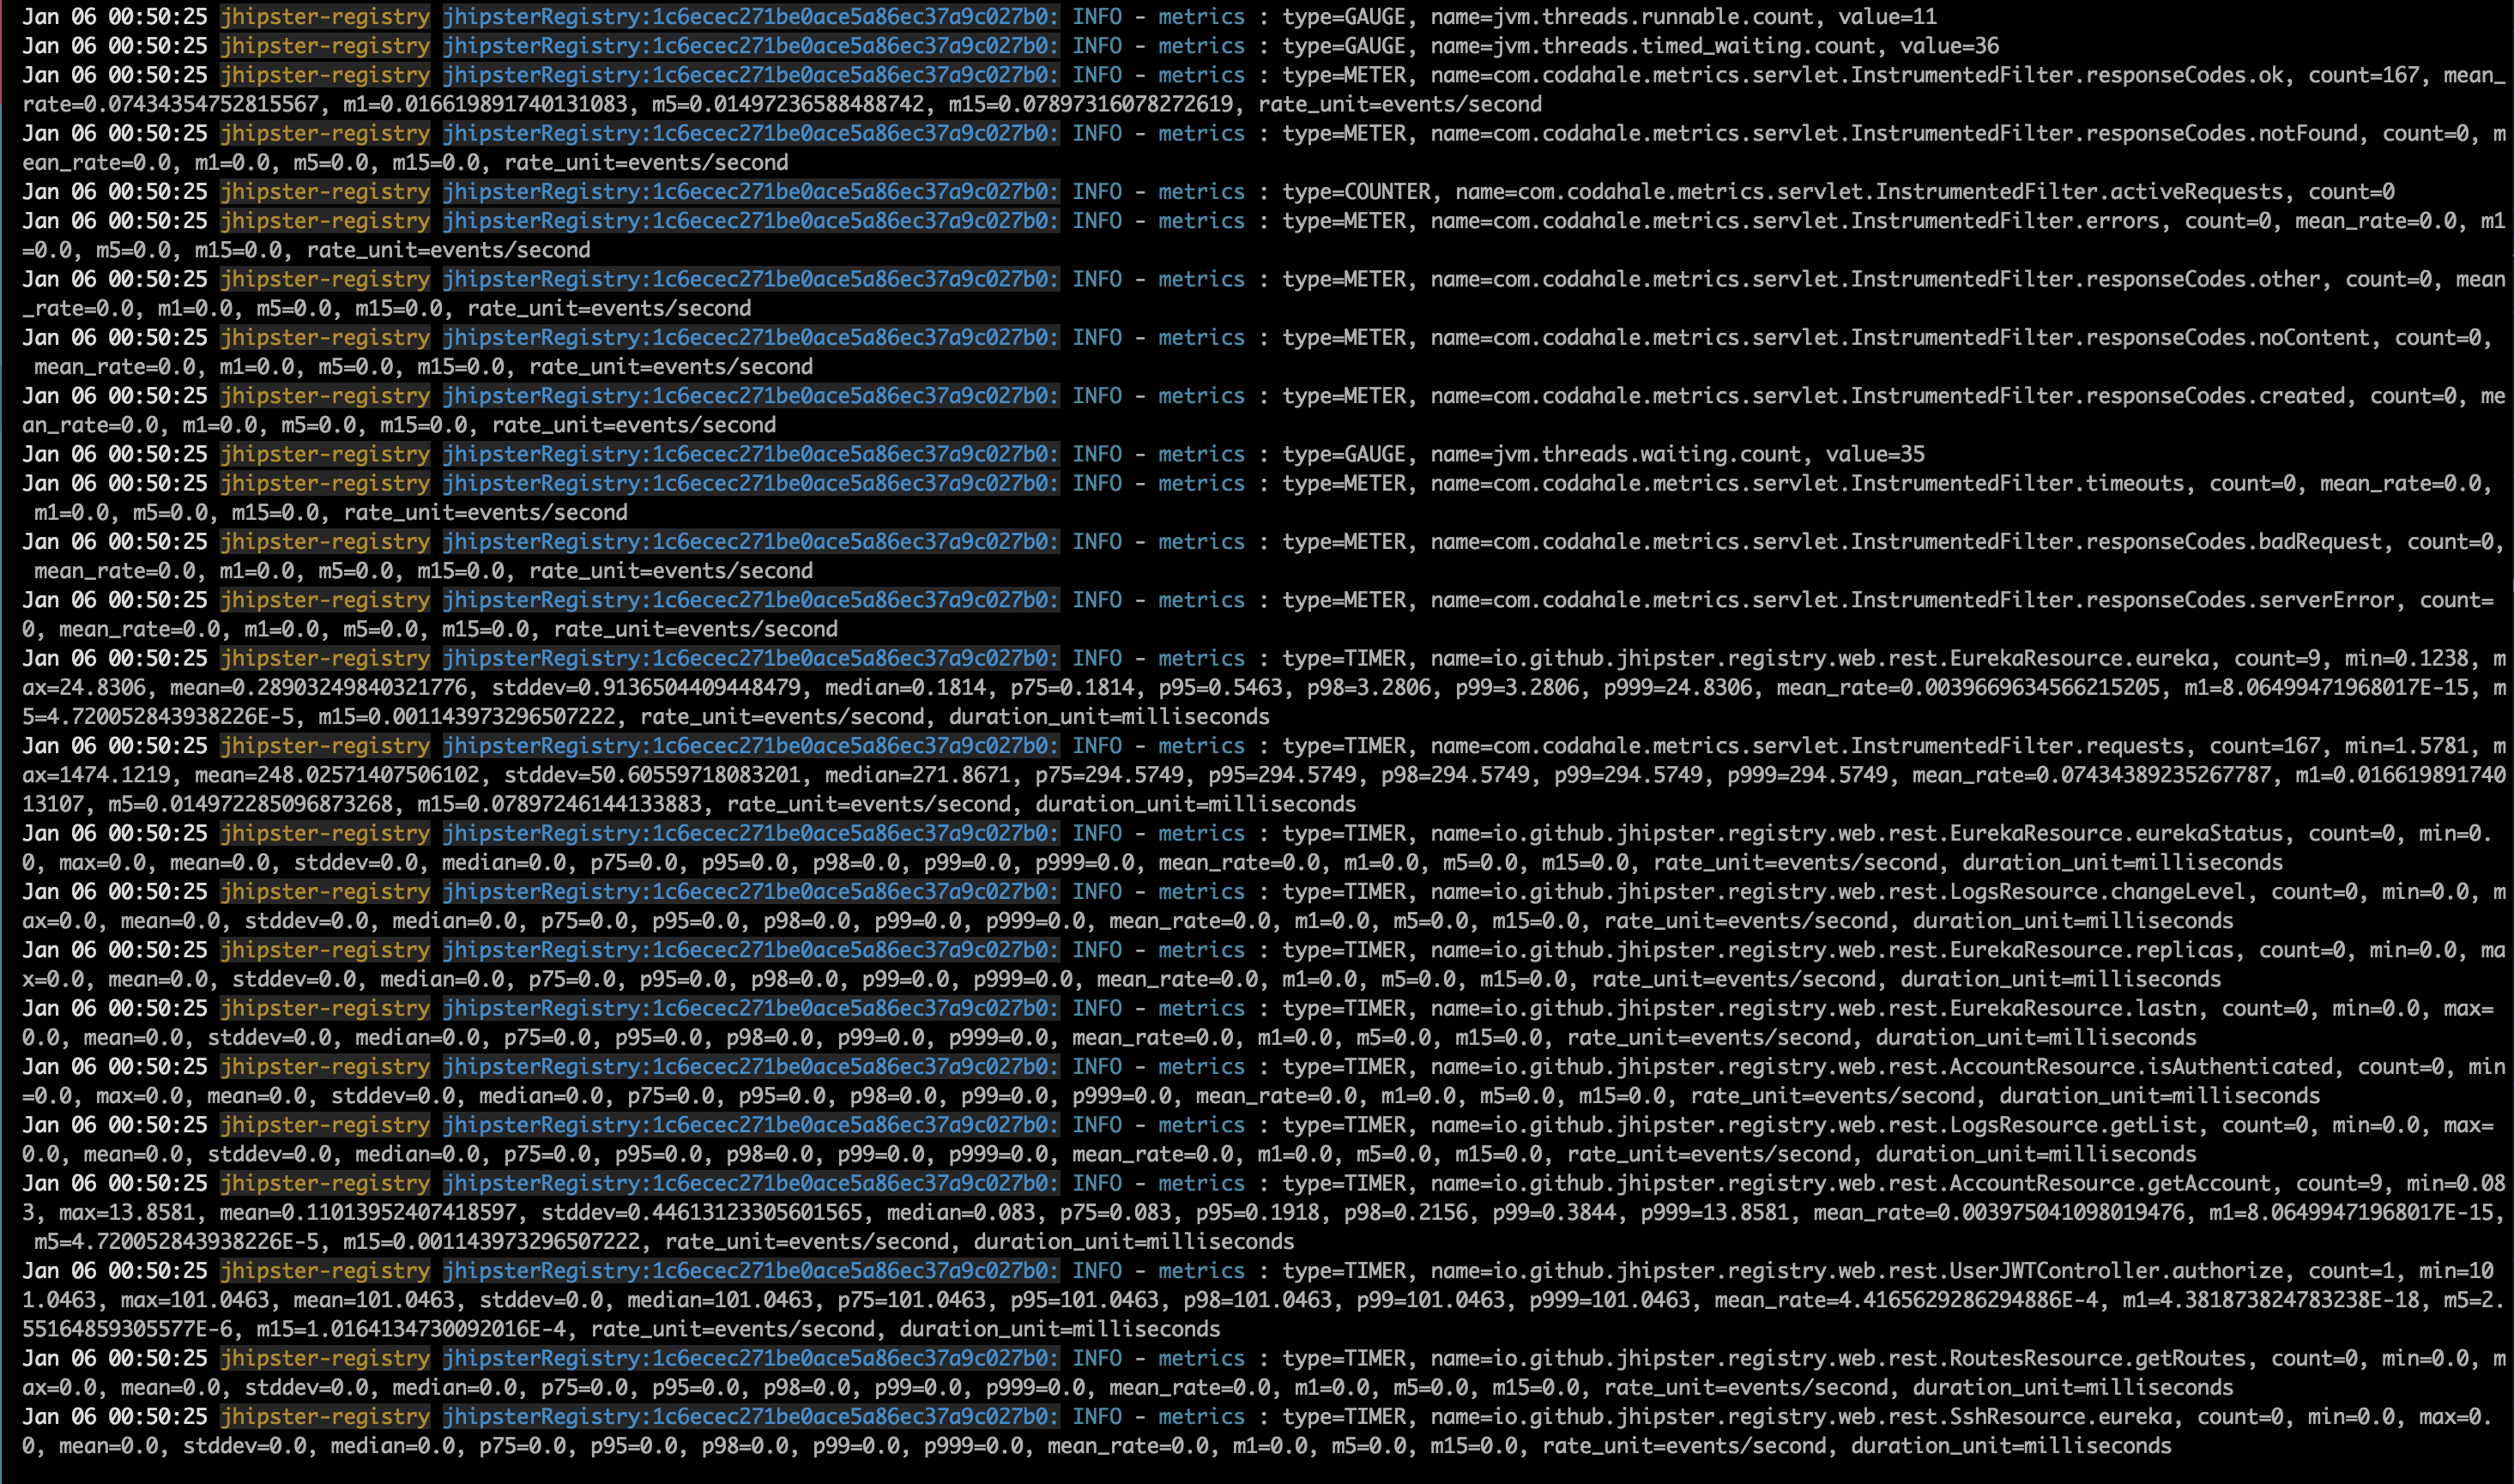
Added to this, the console also has an interface where we can see the application logs. It shows the log of all the applications deployed. We can filter and search the logs with respect to the application:
Kibana also provides a machine-learning tab where we can create a job to track the data and then choose any metric available to track it as a sum, count, high count, and so on.