Twelve
How to Outguess Manipulated Numbers
A New York–based insurance salesman had a generous expense account and the perfect swindle. In the interest of going paperless, his company instituted a policy of requiring scans of submitted receipts rather than the receipts themselves. The salesman discovered that he could change a printed 1 to a 7 or 9 with a black pen, and the modification would be undetectable in a low-resolution scan.
He thereafter went to great lengths to make sure his receipt amounts started with 1. He might order an $18 breakfast, or stay in a hotel where the room cost $178. Then he’d doctor the amounts, getting reimbursements for a $98 breakfast or a $778 hotel bill.
In a stroke of the pen, he was netting $70 to $800 per expense. By a stroke of bad luck, the insurance company’s audit department was an early adopter of Benford’s law analysis. In this case the first digits were enough to tip off the auditors. They found an excess of 7s and 9s and a deficit of 1s. An investigation confirmed the deception, and the company sued the salesman for full restitution.
Manipulated numbers may be a bigger problem than completely invented ones. Here manipulation refers to cases where someone adjusts an honest number upward or downward for personal gain. The adjustment need not be so bold as changing a 1 to a 7. It’s often just enough to meet a limit, goal, or threshold. Expense accounts usually have a limit beyond which expenses will not be reimbursed, or will require preapproval and/or documentation. You can expect to find that expense claims will cluster just below that limit.
“This is usual for government,” Mark Nigrini said. He investigated one agency where employees were given purchasing cards good for purchases of up to $2,500. The result: “globs of purchases at $2,500, $2,499, $2,496… Obviously these are genius people who said, ‘Don’t go for the $2,501, go for $2,496. I’m the only one, out of the entire 35,000 employees of this government agency, who knows how arithmetic works!’ However, we tend to think alike as people so we each think we’re the only one.”
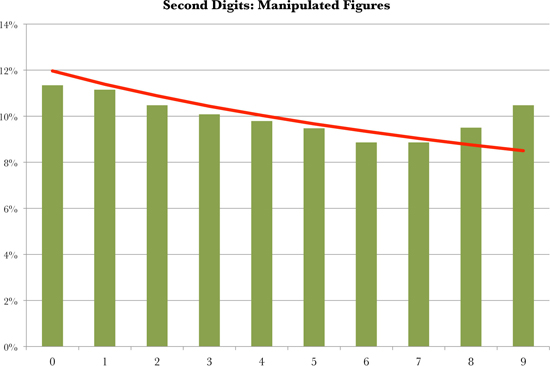
One check for manipulated numbers is the second-digit test. Count the occurrences of the ten digits in each number’s second position, immediately to the right of the leading digit. For $749.91 the second digit is 4, and you would add one to the tally for 4. Chart the results.
With honest numbers, not much variation is expected in the frequency of second digits. Benford’s law predicts that 0 will be the most common second digit, occurring about 12 percent of the time, and 9 will be the least common, occurring 8.5 percent of the time. But often you’ll see something like the chart on the next page. The line is the ideal Benford curve for second digits, and the bars are the actual tallies. It may not look like there’s too much difference, but the differences are telling. The bars show an excess of 8s and 9s and a shortage of every other digit. This can happen when there is a round-number limit like $1,000. People tend to submit expenses that are a little under the threshold.
Threshold effects are common, so don’t rush to judgment the first time you see something like this. An employee who knows that the company will reimburse meals up to $50 may try to run tabs of $49 and change. She’s not doing the company any favors, but she’s playing by the rules that the company set up.
On the other hand, an employee who overreports meal expenses—or makes them up—has reason to lurk under the threshold, too. With a result like this, you might want to check on whether the employee submitted receipts for the just-below-threshold amounts, whether they match, and whether there is any sign of tampering.
Occasionally thresholds end in 5, such as $25. In that case manipulation will produce an excess of 3s and 4s as second digits.
Kevin L. Lawrence came to investors with a can’t-lose business plan. His company, Health Maintenance Centers (HMC), was developing electronics and software to allow health clubs to monitor their members’ performance on exercise equipment. It would make every workout a stress test, allowing the club or physicians to tailor personal exercise and health regimes. Lawrence sold $74 million worth of HMC and a related security to 5,000 investors nationwide.
On January 17, 2002, the Securities and Exchange Commission filed suit against Lawrence and HMC, charging investment fraud. A promised IPO had never happened. Instead, at least $16.3 million of investors’ money had apparently been funneled to Lawrence and associates. The SEC charged that Lawrence had spent $2.1 million on twenty-three luxury cars, $1 million on boats, and $1.7 million on real estate and jewelry, including a $330,000 engagement ring for Stacy Gray, another defendant.
Lawrence probably didn’t set out to be a con artist. He was an entrepreneur who was better at raising money than deploying it into a successful business—less Bernie Madoff than Max Bialystock. The numbers in HMC’s books were real transactions. But some digit tests were highly suspicious. Those tests, unfortunately, were done only after HMC’s problems had become public (by Financial Forensics of Lake Oswego, Oregon, and separately by Mark Nigrini). Had HMC’s investors examined the digit patterns beforehand, they might have saved money and aggravation.
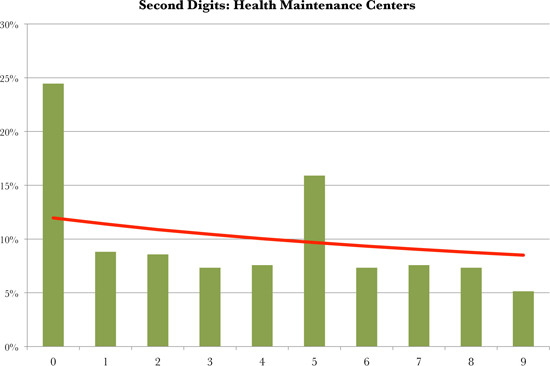
In a chart of the second digits of HMC’s payments data (next page), 0 and 5 occur far more commonly than in the Benford curve. The digit 9 was shunned, occurring considerably less often than 8. This is evidence of someone’s using round numbers like $10 (which occurred 459 times) or $15,000 (122 times) or $1,000,000 (four times). HMC often dealt in round figures.
So do Colombian drug cartels and grandmas writing birthday checks. There is nothing necessarily wrong with round numbers. You go to the ATM and withdraw a round number of dollars, like $300. You don’t know what all you’ll spend it on, so you just pick a number from the touch-screen menu of round amounts. When we make up dollar amounts, and aren’t trying to deceive anyone by making them look random, we almost always pick round numbers.
The only thing wrong with round numbers is that, in some contexts, they aren’t businesslike. Companies have a responsibility to negotiate the best deals and to buy no more than is needed. Even when a price happens to be a round number, a Brownian motion of discounts, allowances, transportation charges, and taxes tends to move the net amount away from the round number. The discipline of running an honest business exerts a gravitational pull, bringing the associated dollar values into line with Benford’s law. When the money handling is more lax or evasive, the dollar values diverge.
HMC’s principals had been using its funds like a personal checking account. Or an ATM machine, literally. A total of 111 of HMC’s payments turned out to be for $301.50. Employees had been given ATM cards to draw on HMC’s accounts. The maximum withdrawal permitted was $300, and the bank tacked on a $1.50 fee.
An excess of $10, $15, $20, and $25 charges was due to bank fees for cashier’s checks and wire transfers. These services are intended for individuals. Companies have cheaper ways to move funds. At the very least, this shows that HMC’s employees weren’t interested in saving the investors’ money. It also raises the question, why weren’t HMC’s own checks good enough?
The answer was also to be found in the numbers. Another bump came from a fee for bounced checks.
The investigation concluded that HMC was using checks and transfers to shift large round-number amounts from one dubious entity to another, most of it eventually landing in the pockets of HMC’s principals. The financial shell game was probably intended to make it hard to follow what was going on.
In the five years leading up to its collapse, Enron, the notoriously fraudulent energy company, reported these revenue figures:
| 1996 | $13.289 billion |
| 1997 | $20.273 billion |
| 1998 | $31.260 billion |
| 1999 | $40.112 billion |
| 2000 | $100.789 billion |
In hindsight, we know that these numbers were a fiction woven by chief financial officer Andrew Fastow. Enron’s managers had become mesmerized by the Pavlovian connection between revenue and stock price. The stock price was posted in the company’s elevator. Fastow found ways to report the revenues to justify the stock prices that everyone at the company desired.
Enron president Jeffrey Skilling spent much of his workday rebutting doubting Thomases. In a now-famous conference call, Highfields Capital analyst Richard Grubman remarked that Enron was the only company he knew that did not produce a balance sheet or cash flow statement with its earnings. “Well, thank you very much,” Skilling replied. “We appreciate it… asshole!”
The few figures that Enron did release were suspicious enough. When a company is on track to sell a million widgets, 998,300 will be a disappointment. Three of the five revenue figures just top a psychologically potent round number—of $20, $40, and $100 billion.
Each of Enron’s threshold-beating numbers has a second digit of 0. Benford’s law predicts that the chance of a number’s second digit being 0 is 11.97 percent. When you get several narrowly threshold-beating numbers in proximity, the odds grow longer. The chance of three out of five numbers having a second digit of 0 is about 1 in 75.
Revenue is a headline number, one likely to be featured in the financial media. There aren’t many headline numbers, but they’re the ones that drive stock prices. Another widely reported number is earnings per share. Here are Enron’s:
| 1996 | $1.08 |
| 1997 | $0.16 |
| 1998 | $1.01 |
| 1999 | $1.10 |
| 2000 | $1.12 |
Earnings were a lot less impressive than revenue. Enron was straining to make a dollar a share, and there’s scant indication of growth over five years. The outlier year was 1997. “Operating results” were said to be $.87 a share, but “items impacting comparability” whittled that down to $.16. Creative accounting allowed Enron to sweep expenses and markdowns into one big pile—the annus horribilis of 1997—and keep the other years’ earnings above $1 a share.
Enron’s pitch was that revenues mattered, not earnings. Revenues are easier to manipulate. In early 2001 Enron folk spoke of doubling revenue again, to the nice round figure of $200 billion. That fine plan was preempted by the management team’s prison terms.
It’s not just Enron. There have been studies looking at the second digits of reported earnings or revenues for all large American corporations. Because there are so many companies of so many sizes in such different lines of business, the reported numbers ought to follow Benford’s law closely. They do, with the striking exception that there are more second digits of 0, and fewer of 9, than would be expected.
Call that the Enron bump. Instead of reporting earnings of 99 cents a share, companies find a way to top $1. Studies of aggregate data can’t say which corporations are misreporting, but the fraction must be sizeable.
There’s a smaller bump for second digits of 5. Instead of reporting 24 cents a share, it’s creatively massaged to 25 cents.
Nigrini notes that you see the opposite type of fudging with losses. Here is the biggest loss ever reported by an American corporation:
$99,280 million
That was from American International Group (AIG)’s 10-K filing for 2008.
Now here is the second-biggest loss reported by an American corporation:
$98,696 million
That was AOL TimeWarner’s filing for 2002. Do you see something similar? The worst corporate losses look like the prices at the 99 cents store.
Given that big and allegedly reputable companies connive to land on the better side of psychologically important round numbers, think how much worse it is with start-ups and wannabes. Banks, venture capitalists, and investors often have to form an opinion of a new company’s credibility from limited data. The relevant numbers may not be income or even revenue but units sold, downloads, or clicks. These may be reported on a quarterly, monthly, weekly, or daily basis. Whatever the metric is, there is a temptation to top important thresholds.
A good reality check is to examine the second digits of numbers you’re given for an excess of 0s. How many barely threshold-beating figures qualify as suspicious? First count how many headline numbers you’re given. Call that N for numbers. Then count how many of those numbers have 0 for the second digit. Call that Z for zeros.
Open a spreadsheet. You’ll need to use something called the binomial distribution function. You don’t need to know what that is. It’s been built into Excel and every comparable financial program. Type this into an Excel cell:
=1-BINOM.DIST(Z-1,N,0.1197,TRUE)
Substitute the actual numbers (or links to cells containing them) for Z and N. The formula will return the probability of at least Z second-digit 0s in a list of N numbers.
Example. Say you were thinking of buying out Enron in early 2001, and the management gave you the ten numbers above, revenues and earnings per share for five years. N would be 10 and Z would be 5.
Subtract 1 from Z to get 4 and plug that in as the function’s first argument. The second argument is 10, and the third is the Benford’s law probability for 0 to be the second digit, 0.1197. Don’t worry about the “TRUE,” just type it in.
The result is 0.368 percent, or 1 in 272. That tells you that it was a serious long shot for Enron to just top all those milestone numbers, by the normal operation of chance.
What probability should cause you to walk away? No statistician can tell you that. Coincidences do happen. For a venture capitalist, the goal is not to prove that financial numbers are accurate but to target due diligence and establish a comfort level.
Here’s one comparative. When testing a new drug, a 1 in 20 (5 percent) confidence level is generally required for publication in a medical journal. The researcher needs to show that the probability that the drug’s observed effects are merely due to chance is less than 5 percent.
This 5 percent criterion is arbitrary. It need not have any relevance to the business world. Still, you might adopt it as the starting point for your conversation. Should the chance be less than 5 percent, consider it a red flag. You should then ask for more figures.
Repeat the process with the new figures and compute with the updated N and Z. Now is the chance less than 5 percent? This is something like checking out a new restaurant. Go there once and get a lousy meal, and it might be the chef’s bad day. Go there a few more times, and you’ll get a better sense of the ground truth.
Should the proportion of second-digit zeros remain high, that makes a case that the company is puffing up its figures. Is the business any good? Your call. The odds are it’s not entirely honest.
In the 1980s and 1990s the Internal Revenue Service’s most dreaded audits were those conducted under the National Research Program (NRP). A random-number generator spat out a nine-digit number. Whoever had that Social Security number won the booby prize, namely an audit from hell in which the taxpayer had to supply documentation for every single entry on the tax return. By auditing random taxpayers and checking everything, the IRS was able to learn which entries produced the most fraud. Scientifically it was perfect; politically not so much. Enough taxpayers griped that Congress pressured the IRS to discontinue the NRP audits in the mid-1990s.
With the NRP shut down, the IRS focused on analytics. Few doubt that these analytics involve Benford’s law, though the ever-secretive IRS will not confirm it. (They did not reply to my inquiries on the topic.) As far back as 1998, however, the New York Times reported, “The income tax agencies of several nations and several states, including California, are using detection software based on Benford’s law, as are a score of large companies and accounting businesses.”
Mark Nigrini was doing this long before tax collectors were. In his early work with US tax returns, he examined entries such as interest and mortgage expense, gifts to charity, capital gains, and the Schedule C expenses of small businesses. These departed from the Benford distribution in consistent ways. Small-business rent and office expenses reported on Schedule Cs were especially problematic.
Nigrini found that undocumented entries of low-income taxpayers were more suspicious than those of high-income filers. This could mean that poorer filers know their risk of audit is small and are more reckless in inventing figures. Alternatively, it might mean that the wealthy are more likely to have competent professional preparers who talk them out of doing anything too stupid.
The paradox was that Nigrini couldn’t tell which returns were misreporting. Most small businesses report a single number for rent. Some of these rent numbers are honest, and some are inflated. It was the aggregate of thousands of rent numbers that implied fraud.
This sort of finding could be immensely useful to tax collectors, not only in determining which entries and types of returns to audit but in writing regulations and influencing legislation. The IRS now requires mortgage lenders to report interest with a Form 1098, and consumer interest is no longer deductible at all. Stockbrokers began reporting the original (basis) price of securities to the IRS in 2011, and mutual funds followed in 2012. In 2011, the IRS resumed some random audits, focusing on self-employed business owners with high cash flow.
A few years ago, Inland Revenue ran digit tests on British tax returns and found that small-business owners were unusually likely to report sales starting with the two digits 14. The evident reason was that at that time Britain allowed small businesses to file a short-form return provided sales were less than £15,000. The threshold has since been raised several times. Each time the manipulations crept upward in lockstep.
Middle-income American taxpayers use a tax table to compute their federal income tax. These tables divide incomes into $50 ranges. In 2011 a single person making $71,049 in taxable income owed $13,894 in taxes. If that person made a dollar more ($71,050), she’d be bumped onto the next line of the table and owe another $12 in taxes ($13,906).
You might think that no one would bother to cheat on her taxes for $12. Nigrini charted the last two digits of taxable income and found evidence that filers were adjusting their incomes to fall just before a step. There were excesses of reported incomes ending in 48 or 49; 98 or 99. There were also fewer-than-expected incomes falling at or just above the step (ending with 50 or 51; 00 or 01).
To prove that this was conscious evasion, Nigrini compared tax-table returns to those of higher-income filers, who are instead required to multiply their taxable income by a marginal rate. Their digits showed no sign of this manipulation.
Taxable income is calculated from other entries and can’t be changed on its own without creating a math error. A filer who’s just over the tax threshold would have to go back and find a way to add a couple of dollars to a deduction, or shave a few dollars off income. To put the best possible complexion on that, it could indicate a taxpayer with a sharp pencil who racked her mind and remembered a deduction she’d forgotten about. Less optimistically, it might mean that a taxpayer is willing to cheat a little when the chance of detection is small.
The IRS’s audit formula is generated by predictive analytics. Statistical correlations allow it to predict which returns are most likely to be dishonest and to yield the most additional tax on audit. The IRS computers have all back returns to draw on, and surely they do make use of that information. It may be coincidence that your taxable income is a dollar below the threshold this year. If it’s been just below… 00 or… 50 every year for the past ten, it’s no coincidence.
Threshold effects offer a simple honesty test. It’s entirely conceivable that the test figures in the audit formula. It’s not that tax agencies care so much about a few dollars. But should a taxpayer consistently game the tax thresholds and show other red flags, like a Schedule C business or large charitable deductions, that would raise the suspicion level.
The best advice is to be scrupulously honest in small things. The outguessing machine is watching, and it knows more than you think.
The political blogosphere has latched onto Benford’s law in a big way. It has acquired a reputation as a magic black box that needs only precinct level vote counts—available to any blogger working in his mother’s basement—to uncover electoral fraud. The result is a growing number of claims of rigged elections. A charge of a stolen election, dressed up with statistical jargon that few understand, will be picked up by the next tier of supposedly more responsible journalists. On the Internet, errors can be refuted but never retracted. The next thing you know, there’s a new, partisan conspiracy theory.
Too many of these claims are based on first-digit tests only. The first-digit test is never definitive and can be utterly meaningless. One ought to compare this election’s digit patterns to those of previous elections. That is rarely done.
Partisan bloggers can also succumb to data mining. There are thousands of precincts in a state or national election. Comb through enough of them and you are sure to find some in which the statistics look suspicious. They’re not suspicious when you look at the big picture, but the big picture is precisely what’s missing in the mind of a zealot.
The idea of checking election results through digit analytics is credited to Alexandar Sobyanin. He studied Russia’s notoriously corrupt 1993 parliamentary elections. Sobyanin proposed several statistical tests, one based on Benford’s law and all founded on the idea that invented numbers would be different from authentic numbers. Sobyanin claimed that his tests of the 1993 election showed fraud. The conclusion, at least, was incontestable. Many such claims have followed. After Iran’s 2009 election, reelecting Mahmoud Ahmadinejad, Nigrini looked at the precinct totals and found evidence of fabrication.
A recent article by Joseph Deckert, Mikhail Myagkov, and Peter C. Ordeshook has the title “The Irrelevance of Benford’s Law for Detecting Fraud in Elections.” The authors caution that there hasn’t been much research on how well honest election results fit Benford’s law. One unknown is how much precinct sizes vary. One would like to think that election boards split up districts more or less evenly and avoid huge disparities in precinct size. Unless there’s a partisan reason for gerrymandering… who knows?
Imagine a stretch of Iowa farm country in which the precincts are laid out as regularly as the cornfields, with 5,000 voters in each. This is a uniformly conservative region favoring Mitt Romney over Barack Obama, 70 to 30 percent. Romney averaged 3,500 votes per precinct, and Obama averaged 1,500, without too much variation for either. The first digits of Romney’s totals would be 3s and Obama’s first digits would be 1s. The magic black box lights up red! But nothing’s wrong. It just means that we’re looking at a region where the precincts and the politics are pancake-flat.
In this scenario, both candidates’ results would generate false alarms. More troubling are cases where only one candidate’s results would look falsely suspicious. It’s common for one candidate to do better in cities and another to do better in rural areas. Precinct size might vary more in urban areas than rural communities (or vice versa). Either could cause one candidate’s results to fit Benford’s law better than the other’s.
In order to use digit patterns to detect fraud, it’s vital to have some theory of how election fraud happens. In some parts of the world, corrupt apparatchiks sit down and invent a list of numbers to be passed off as precinct counts. In Russian elections, many precinct counts are shamelessly rounded, ending in 0(s), with no attempt to cover up the inexactitude. “There has been fraud of course,” admitted Vladimir Shevchuk of Russia’s 2000 presidential election, “but some of it may be due to the inefficient mechanism used to count ballots.… To do it the right way they would have needed more than one night. They were already dead tired so they did it in an expedient way.” Shevchuk sat on Tatarstan’s electoral commission.
In the annals of American corruption, cheats may register names from the local cemetery and use them to stuff ballot boxes with forged votes for their candidate, or they may “lose” ballots for the opposition candidate. The net effect of much ballot fraud is to multiply a candidate’s count by an approximate factor: however much the cheats think they need to win. This would be difficult to detect by Benford’s law. One of the law’s properties is that you can multiply a set of numbers by any factor and the numbers will still conform to the Benford distribution.
Tests of last digits are better for detecting invented totals. It probably wouldn’t be one person inventing the numbers, though. Should an army of corrupt poll workers invent a single number each, the group effort would eliminate any personal signatures. You would have to rely on relatively universal features of invented numbers.
In a 2012 analysis of Nigerian elections, Bernd Berber and Alexandra Scacco suggested looking at doubled last digits (00, 11, 22, through 99). As we’ve seen, these are usually less common in invented numbers and can be useful in raising a red flag for further investigation.
The troubling thing about digit analysis of elections is that partisans often aren’t interested in a search for truth. They want any anomaly to be taken as instant proof of fraud. Should investigation in the field fail to substantiate wrongdoing, partisans may want to claim fraud anyway, based on the digits alone. Such claims need to be taken with a grain of salt.
All of the applications of digit analytics are based on the assumption that the bad guys don’t know about it. So far this has largely been true, but someday it won’t be.
There was a time when only a few criminologists knew about fingerprints. Now the dumbest burglars know to use rubber gloves. There are ways to defeat digit analysis, and they’re not that difficult.
Nigrini has made the optimistic case that wider knowledge of Benford’s law would be a deterrent, just as knowledge of fingerprints and DNA analysis is. Those who decide to commit fraud would first have to plan the misrepresentation and then adjust the figures to conform to the Benford distribution. That’s more work; the adjustment would tend to diminish the amount of fraud, or require additional actions that could lead to detection, or both.
The problem is that criminals are not easily deterred—that’s what makes them criminals in the first place. They are people who have trouble understanding the long-term consequences of their actions. That cuts both ways. Everyone’s seen CSI shows, yet forensic technology remains useful because most crimes are done on the spur of the moment, with little planning. That’s true of many financial and electoral crimes, too. An embezzler starts because he lost the rent in Las Vegas. A would-be entrepreneur “enhances” a balance sheet for a meeting with an investor. A ruling party cheats at the last minute because it looks like it’s losing.
In any application, it’s worth asking yourself: How likely is it that the person reporting the figures is aware of Benford’s law, expects that the figures might be subjected to forensic analysis, and has the mathematical skills to pull off a countermeasure?
Recap: How to Outguess Manipulated Numbers
• The second digits of financial numbers can help uncover manipulation. When there is an incentive to top a round number, manipulators will produce relatively more second digits of 0 and relatively fewer of 9.
• When there is an incentive to fall under a round number, manipulators produce more second digits of 9 and fewer of 0. This is common with expense accounts.
• Digit analysis cannot “prove” anything by itself. Its value is in flagging data meriting investigation by a good auditor. Be skeptical of claims (of election fraud, say) based on first-digit Benford tests.