Visual Studio Code is a convenient editor for developers with a lot of extensions, including for the Rust language and the LLDB debugger support. Let's try to use it.
First, you have to download and install Visual Studio Code from here: https://code.visualstudio.com/. After this, you need to install two extensions—rust-lang.rust and vadimcn.vscode-lldb. The first adds Rust support while the second integrates VS Code with LLDB.
The integration with Rust is based on the Rust Language Server (RLS) project that, which provides information about Rust code for IDEs.
Open the router microservice project with File > Add Folder To A Workspace... and choose the folder with a project. When it's open, set a breakpoint—set a cursor to the desired line and choose Debug > Toggle Breakpoint command. Now, we can start debugging with the Debug | Start Debugging command. On the first run, it takes some time to prepare LLDB, but when debugger starts, it prints some information to the Output tab.
Open a browser and try to open the http://localhost:8080/comments URL that activates the breakpoint of our comments handler:
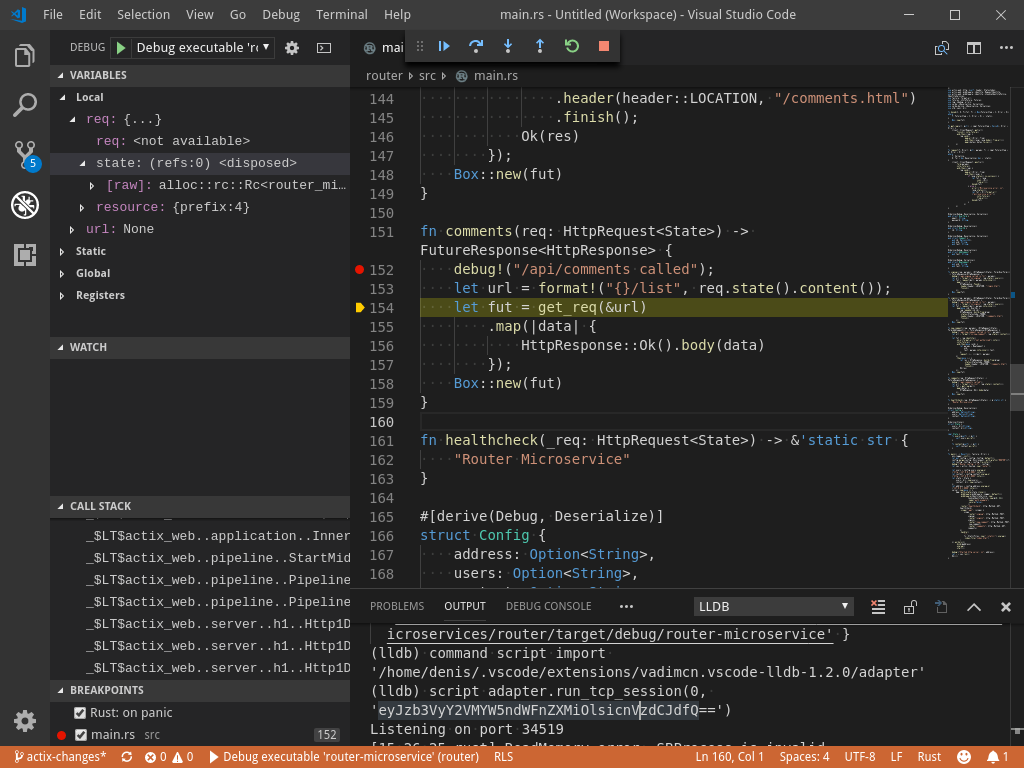
Use the bar at the top to move the execution pointer to the next line. With a GUI debugger, you can explore variables and the call stack. It's simple and useful. But not every case can be fixed with debugger, because there's types of bugs (called Heisenbugs) that disappear at the moment of debugging or studying them. The only thing that can help with that is logging.