Chapter 10
General Conclusions
The main goal of this book has been to determine how well the predictions of the demographic-structural theory map onto empirically observed patterns in the historical societies we studied. We focused on four fundamental variables: population numbers (in relation to carrying capacity), social structure (specifically, the numbers and consumption levels of the elites), the strength of the state (typically measured by its fiscal health), and sociopolitical instability. In our empirical investigation we attempted to measure as best as we could the dynamics of these variables. Where possible we looked at data that directly demonstrated the dynamics of the key variable, and where this approach was impossible we searched for proxies. Secular cycles also affect many other aspects of historical societies, and where such data were available, we included them in the analysis. Our empirical investigation looked at eight secular cycles in four countries. In this concluding chapter we summarize our results and delineate promising future avenues of research.
10.1 Population Numbers
The match between theoretical predictions about population dynamics and empirical patterns was quite good. Generally speaking, integrative phases were characterized by sustained long-term population growth, although this ascending trend could be interrupted and even temporarily reversed when factors not taken into account by the theory intruded. The most conspicuous example is the population declines in Republican Rome during the First and Second Punic Wars. Where our data are particularly good, as in the case of early modern England, we observe much smaller fluctuations, for example, during the 1560s in England (see figure 3.1a). The general rule is, nevertheless, that the effect of such setbacks during the expansion phase is temporary, and any losses are made up quickly.
Disintegrative phases were generally periods of population decline or stagnation. Dramatic population declines took place during the crisis phases of the Plantagenet, Capetian, Principate, and Muscovy cycles. We argue that the Republican cycle also ended with a population decline in Italy, but this remains controversial. In two cycles, the Tudor and Valois, absolute population numbers declined less dramatically, and the general trend was stagnation rather than collapse. However, in the Tudor case, population pressure on resources (population relative to the carrying capacity) exhibited a very substantial decline (by 35 percent between 1650 and 1750). We would not be surprised to learn that a comparable decline affected the population pressure in the Valois cycle. Finally, our examination of the Romanov cycle stopped at the crisis stage, and therefore we do not offer estimates of how population pressure declined over the course of the complete disintegrative phase (we will pursue this question in future work).
Among the various economic trends that could serve as proxies for population dynamics, the most useful, without any doubt, is the real wage. Where our data are good, the inverse relationship between the population pressure on resources and the real wage is very tight (see, for example, figure 3.10). However, this relationship holds only before the Industrial Revolution. After 1800 in England the relationship between population and real wages was completely transformed.
There are some early indications that a most useful noneconomic proxy for population pressure may be the average height of populations (Komlos 1990, Steckel 2004, Koepke and Baten 2005). The basic idea of the approach is that population pressure on resources results in reduced levels of nutrition. Inadequate nutrition of growing human beings (infants and juveniles) results in stunted adult stature. Thus, it should be possible to observe population fluctuations indirectly by measuring how average heights of individuals changed with time (figure 10.1).
In our earlier work (Nefedov 1999, Turchin 2003b) we proposed a tentative chronology for secular cycles in Western Europe (table 10.1). There is a remarkable degree of congruence between this chronology and the fluctuations of average heights in Europe (the data in figure 10.1 were not used in any way to construct the chronology of the secular cycles). Interestingly, the relative height of peaks in the graph corresponds well with what we know about the relative height of population peaks achieved during various secular cycles. Thus, the population peaks during the Roman period were much higher than during the Middle Ages. The drastic population collapse of the sixth century in particular is very well reflected in the remarkable increase in average stature. On the other hand, population peaks of the last medieval (Capetian) and the first early modern (Valois) cycles matched and even exceeded those of the Roman times.
10.2 Elite Dynamics
Data on elite dynamics were harder to obtain than general population data, and we were often forced to rely on informed judgments by specialists. Nevertheless, quantitative estimates of elite-commoner ratios were available in the Plantagenet, Tudor, Capetian, and Muscovite cases. Less quantitative estimates in other cases were in agreement with the predictions of the theory regarding the development of elite overproduction (peaking during the crisis phase) and its abatement (with the trough occurring during the expansion phase of the next cycle). We found that various measures of conspicuous consumption provided useful proxies for the expansion and contraction of elite numbers and appetites. One proxy variable that should be available in many cases is the rate of construction of temples or churches (for example, figures 2.5 and 6.1). Consumption rates of such luxury goods as wine in England (where commoners drank beer) can sometimes give us an excellent insight into how the “footprint” of the elites changed with time (between 1300 and 1460 the amount of wine drunk by the English elites declined fourfold; see section 2.5).
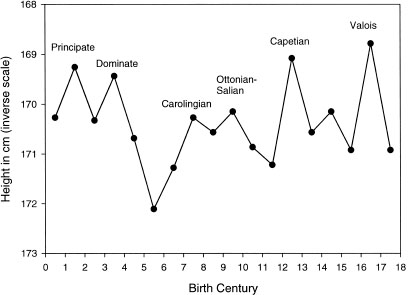
Figure 10.1 Average height of Europeans during the two millennia CE. Data are from skeletal material (Koepke and Baten 2005). Heights are plotted on an inverse scale, so that the peaks in the graph correspond to population peaks (because periods of high population density should correlate with low average heights).
One apparently ubiquitous feature of elite overproduction is growing economic inequality. We were able to obtain time-series measures of inequality (by looking at the ratio of top fortunes to contemporaneous mean or median incomes) for the Plantagenet, Valois, and Roman Republic cycles. Certain indicators of intraelite competition that have been proposed in the context of the Tudor-Stuart cycle turned out to be useful in other case studies: litigation (the Muscovy cycle), education (the Romanov cycle), and the dueling rate (the Valois cycle).
TABLE 10.1 |
||
Summary of the chronological sequence of secular cycles in Western Europe |
||
| Secular cycle | Integrative phase | Disintegrative phase |
| Republican Rome | 350–130 BCE | 130–30 BCE |
| Principate | 30 BCE–165 CE | 165–285 |
| Dominate/Merovingian | 285–540 | 540–700 |
| Carolingian | 700–820 | 820–920 |
| Ottonian-Salian | 920–1050 | 1050–1150 |
| Capetian | 1150–1315 | 1315–1450 |
| Valois | 1450–1560 | 1560–1660 |
| Bourbon | 1660–1780 | 1780–1870 |
Note: This chronology focuses on the dominant state in Western Europe: first the Roman Empire, then the medieval German empires, and finally France. |
||
10.3 The State
Data on the fiscal health of states were available for every studied cycle, although their quality varied from case to case. Nevertheless, the data were good enough to yield several surprises. It is true there was at least some evidence of fiscal difficulties associated with the crisis stage in all case studies. However, this is not a very strong result, because preindustrial states constantly overextended themselves under the pressure of war, and state fiscal difficulties, even bankruptcy, did not necessarily result in state breakdown. In one case study, that of Republican Rome, there is no evidence of serious fiscal difficulties until after the civil war broke out. Republican Rome was also one case in which the state had the least degree of autonomy from the elites, the senatorial class. As we noted in section 6.6, the theory needs to be modified to take such cases into account.
Furthermore, although in some cases we observed declining real revenues during the stagflation phase (the Plantagenet and Tudor cycles), in others (the Romanov and, probably, the Musocovite cycles) the state was actually able to continue raising per capita real taxes until the moment of the crisis (and in the Muscovite case, such exactions were an important factor contributing to triggering the crisis). However, what is important is not whether the revenues declined in absolute terms but whether they declined relative to expenses. For example, Goldstone's (1991, 2008) study of what we have called the Bourbon cycle showed that both real revenue and per capita taxation grew until the eve of the French Revolution. However, the fiscal collapse of the state was one of the clearest elements of the late eighteenth-century crisis in France. The problem was that the state expenses grew much faster than revenues, owing to a vastly expanded cadre of elite officeholders and rising military expenses.
The fiscal dynamics during the disintegrative secular phases, however, yielded some surprises. Our initial expectation was that during these periods, states should be uniformly incapable of acquiring enough revenue to function. Instead, we found that the typical dynamics of state revenues went on a veritable roller-coaster ride. Periodically, rulers succeeded in persuading the populace and elites to accept high taxes, but such episodes of internal accord did not last very long. As a result, we observed wild swings in revenues during the disintegrative parts of the Plantagenet (figure 2.6), Tudor (figure 3.3), Valois (figure 5.2), Muscovite (figure 8.3), and Romanov (figure 7.7) cycles. These revenue swings are apparently associated with the father-and-son dynamics. Civil wars not only induce, after a lag, a powerful desire for social peace, they also make the elites more amenable to compromising with the state over the need for taxation. The next generation (which did not directly experience civil war) is much less willing to yield to the state's demand for revenue. The growing antagonism between the state and the elites is one of the factors that may bring about another round of civil wars.
10.4 Sociopolitical Instability
Sociopolitical instability is a key variable of the demographic-structural theory, and it is gratifying that we were able to obtain quantitative estimates of its dynamics for all the studied cycles. The simplest method for quantifying sociopolitical instability is to plot the number (per unit of time) of “instability events,” such as peasant uprisings, regional rebellions, coups d'état, and civil wars. In making these estimates we were greatly aided by the previous work of authors such as Pitirim Sorokin (1937) and Charles Tilly (1993). We present such graphs for the Plantagenet (figure 2.7), Capetian and Valois (figure 5.3), Republic (figure 6.5), and Principate (figure 7.5) cycles.
Indices of instability based on the analysis of the written sources have the advantage that they can be developed for any period for which we have a sufficient density of sources. The drawback of this approach, however, is that it is inherently subjective. Actual instability occurrences are first filtered through the perceptions of contemporaries and later affected by the various biases of compilers of historical chronicles; finally, the modern investigator has to decide whether any particular disturbance qualifies as “major” to be included in the list of instability events. We need a better, more objective method for quantifying instability, and it is fortunate that an excellent proxy variable is available in the frequency of coin hoards. We have been able to use compilations of coin hoards to estimate instability dynamics in the Plantagenet (figure 2.7), Tudor (figure 3.4), Capetian (figure 4.2), Republic (figure 6.5), Principate (figures 7.6 and 7.7), and Muscovite (figure 8.1) cases. It is gratifying that the instability indices based on written sources and the coin hoard proxy are largely in agreement. When two sets of numbers, obtained in a completely independent manner, show similar patterns, our confidence that both methods generate reasonable results is boosted.
In one case, the Romanov cycle, we decomposed generic instability into three component processes: peasant disturbances (figure 9.9), worker strikes (figure 9.11), and revolutionary activity as indicated by the number of “named executions” (table 9.7). For a number of case-studies (see figures 2.9, 2.10, 3.6, and 9.10 and table 4.4) we were also able to locate data on violent crime. We should note, however, that the crime rate, being usually an expression of violence between individuals, is a variable distinct from sociopolitical instability (intergroup violence), and these two variables do not have to fluctuate in synchrony.
In summary, we have a rich database on the dynamics of sociopolitical instability. These data show that the dynamics of instability are complex and evolve on at least two distinct temporal scales. At the scale of centuries, there was a marked tendency of instability events to be bunched in some periods but not others. These instability waves recurred with a period of roughly two (sometimes three) centuries, so that a century of high instability would be followed by a century of lower instability. The pattern is most clear where we have long-term data. For example, between 1150 and 1700, there were three instability waves in France, arriving roughly every two hundred years (figure 5.3; see also coin hoard trends in figure 4.2). Additionally, there are multicentury hoard compilations for two European regions that exhibit a very similar pattern (figures 10.2 and 10.3). The graphs show clear instability waves during the late medieval period and the seventeenth century.
As we show in chapters dealing with specific cases, the instability waves were dynamically associated with demographic dynamics, but there was a phase shift between the two variables. Stagflation phases, when population numbers peaked, were relatively peaceful and orderly, and instability reached a peak during the following phases of crisis and depression. This empirical pattern is precisely what the demographic-structural theory predicts.
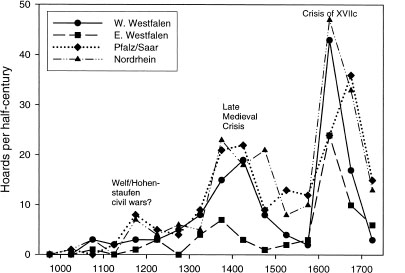
Figure 10.2 Temporal distribution of coin hoards found in northwestern Germany (Ilisch 1980: Table 6). The four curves show the number of hoards per halfcentury found in four regions: East Westphalia, West Westphalia, Pfalz/Saar, and Nordrhein.
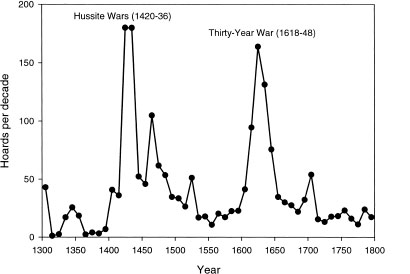
Figure 10.3 Temporal distribution of coin hoards found in the Czech Republic (Bohemia, Moravia, and Silesia) (Nohejlova-Pratova 1955).
TABLE 10.2
Instability events per decade during the population growth and decline secular phases: The seven complete secular cycles studied in this book
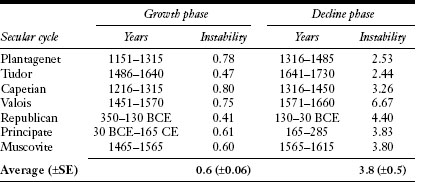
Can we make the above statement more precise and quantitative? Given the limitations of historical data and the complexity of the dynamical pattern (variability in oscillation periods and phase shifts, as well as such complicating factors as the fathers-and-sons cycles), we need to employ an appropriately coarse-grained procedure. This question, then, can be approached as follows. First, we identify the population growth and decline phases. Although quantitative details of population dynamics for historic societies are rarely known with any precision, as we saw in the preceding chapters, there is usually a consensus among demographic historians as to when the qualitative pattern of long-term growth changed. Second, we count instability events, using the indices of instability based on the written sources (we do not do it here, but the same approach can be also applied to instability proxy data, such as incidence of unrecovered coin hoards). Finally, we compare the incidence of instability events per decade between the population increase and population decrease phases. The results of applying this procedure to all seven complete case-studies (omitting the Romanov cycle) are shown in table 10.2. The empirical regularity is very strong: in all cases, instability is greater during the declining phases than during the growth phases (t-test; P  .001).
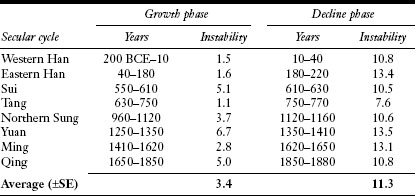
This is a striking result, and apparently one not limited to the secular cycles studied in this book. For example, we can apply the same procedure to the more than two millennia of Chinese imperial history. We used the population data from Zhao and Xie (1988) and the instability data from Lee (1931) (for a more detailed discussion of these data series, see Turchin 2003b: Section 8.4). Focusing on the periods when China was unified under one dynasty, we obtained the results shown in table 10.3. Again, the pattern is consistent and striking.
Thus, when instability is examined on an appropriately coarse temporal scale (essentially centuries), there is an excellent match between theoretical predictions and observed empirical patterns. However, the complicating factor is that instability also fluctuates on a finer time scale, that of human generations. This pattern is especially clear during the disintegrative phases of secular cycles, when peaks of particularly intense internal warfare recur at an interval of fifty years, give or take ten, with periods of fragile peace between them. Such “fathers-and-sons” dynamics, to a greater or lesser degree, occurred during the disintegrative phases of all eight cases that we examined in this book. In addition, fathers-and-sons cycles were discernible during integrative phases in medieval England, where baronial rebellions tended to occur every sixty years between 1100 and 1500 (figure 2.7), and in nineteenth-century Russia (figures 9.9 and 9.10 and table 9.7).
TABLE 10.3
Instability events per decade during growth and decline secular phases: The Chinese dynastic cycles.
Finally, there was a class of instability events that did not fit either secular or fathers-and-sons rhythms. The examples include the mid-first-century crises in the Principate (most notably the “year of three emperors,” 68–69 CE), the mid-Tudor crisis (between 1539 and 1563), and the Pugachev rebellion in Russia (1773–75). These crises were not predicted by the demographic-structural theory, and their occurrence underscores the point we have made repeatedly: the theory does not describe historical dynamics in all of their complexity. Clearly, mechanisms other than overpopulation and elite overproduction can bring about political crises, rebellions, and outbreaks of civil war. On the other hand, these “nondemographic-structural crises” were milder both in intensity and, especially, duration than the demographic-structural ones. Thus, although the theory does not explain all instances of instability, its prediction of alternating secular trends of stability versus instability is supported in all eight empirical case studies.
10.5 Are There General Laws of Historical Dynamics?
We end the overview of empirical results on a more speculative, even provocative note (in the sense that we wish to provoke controversy). There is a longstanding debate among scientists and philosophers as to whether history has general laws. In the nineteenth century some thinkers, emboldened by spectacular successes in physics and biology, argued that the scientific study of history, which means searching for general laws, is possible. For example, in the epilogue to his novel War and Peace, Leo Tolstoy proposed that the laws of history could be discovered by employing methods similar to those used in statistical physics or evolutionary biology, and this view was shared by many nineteenth-century historians (Beard 2002). During the twentieth century the opinion among the philosophers and historians swung in the opposite direction. For example, the philosopher Karl Popper (1957) thought that historical processes were too complex and history was too different from natural sciences to have general laws such as those discovered in physics or biology.
The general thrust of our research program goes very much against this consensus. A basic premise of our study is that historical societies can be studied with the same methods physicists and biologists used to study natural systems. We started with a general theory, which has been formalized in our previous work by translating it into mathematical models (e.g., Turchin 2003b: Chapter 7). As a result of this formalization, we have a set of specific and quantitative predictions about a suite of demographic, economic, social, and political variables (detailed in chapter 1; see table 1.1). As discussed earlier in this chapter, not all predictions of the theory have been borne out by the data. Such an outcome should be expected, since theories in natural sciences are also not expected to be right all the time. For most variables, the match between model predictions and empirical time series was quite impressive. Furthermore, where the theory failed (as in its prediction of revenue dynamics during the disintegrative phases), it did so in an interesting way. Instead of the theoretically predicted pattern we saw another one, and where there are recurring patterns, there may be general processes underlying them. In other words, the observed regularities suggest how the theory could be improved. Such an iterative approach—in which theoretical predictions are compared with the data, the theory is modified in light of the obtained results, and then new data are brought in to test the predictions of the modified theory—is at the heart of making scientific progress in both natural and social sciences, and, we believe, in historical applications as well.
The general implications of our results, then, are that some sort of general regularities of the historical process appear to exist. At the present time we cannot state them in the same precise form as formulations of many physical laws, with defined mathematical forms and universal constants. Perhaps “laws of history” will never attain the same level of precision as that achieved in some areas of physics; the future will show. But it is possible to formulate some of the general principles of the theory that have received broad empirical support, if in a more qualitative fashion. Here is our preliminary attempt at doing so, with the understanding that the proposed generalizations are tentative and likely to be improved with subsequent empirical and theoretical research.
One generalization can be called the neo-Malthusian principle: during periods of sustained population growth, if the output of the agrarian economy does not keep pace with the population, a number of relative price trends will be observed. One trend is rising prices for basic foodstuffs, energy, and land. Another one is falling real wages for labor. These trends are simply a consequence of the law of supply and demand. Thus, as the supply of labor increases, and if the demand for it is limited (which it is in agrarian economies), the price of labor inevitably decreases. We saw this pattern in all empirical studies with a greater or lesser degree of clarity, depending on the quality of the data. The most striking illustration of this principle is figure 3.10b, which shows a very close relationship between the population pressure on resources and real wages in England, 1150–1800.
Another generalization, dealing with the elite dynamics, is also a consequence of the law of supply and demand. The principal kind of wealth in agrarian societies is land. The elite landowners profit from overpopulation in two ways. First, they are consumers of labor: they need peasants to work their land, servants to carry out domestic chores, and craftsmen and artisans for producing items for status consumption. Second, their property, land, produces food and other commodities, such as fuel and raw materials, the demand for which increases together with the growing population. Because the items they consume become cheaper while the items they produce increase in value, the elites greatly profit from overpopulation. The process, however, is dynamic, and a favorable economic conjuncture for the elites means that, first, their numbers increase from both biological reproduction and upward social mobility, and second, they become accustomed to ever greater levels of consumption. In the end, elite numbers and appetites outgrow their “carrying capacity” (based on the labor of commoners). Just as overpopulation results in large segments of commoner population becoming immiserated, elite overproduction similarly results in large segments of elites becoming impoverished (not in absolute terms, as with common populace, but relatively to the standards of consumption needed to maintain the elite status). This generalization thus may be called the principle of elite overproduction. One consequence of this dynamic is that the rate of elite overproduction should be shifted in phase (should lag behind) the rate of general population growth. The case studies in this book provide ample empirical support for this model prediction: whereas population growth rate peaks during the expansion phase, elite overproduction develops during the stagflation phase.
A third possible generalization deals with the causes of sociopolitical instability. The demographic-structural theory proposes three principal causes of the onset of a disintegrative trend (that is, a lengthy period of heightened instability): overpopulation, elite overproduction, and a fiscal crisis of the state. As we discussed in section 10.4, however, some causal factors are relatively more important than others. In particular, a factor that appears to be always associated with high instability (at least in the eight cases we examined) is elite overproduction. Overpopulation, by contrast, results in popular immiseration and discontent, but as long as the elites remain unified, peasant insurrections, slave rebellions, and worker uprisings have little chance of success and are speedily suppressed. Furthermore, when the population declines during the disintegrative periods, there is often a substantial lag time between population density reaching a low level and the restoration of internal peace and order. The third component, the fiscal crisis of the state, is usually present but sometimes is missing as triggering factor leading to civil war (see section 10.4). Thus, overpopulation and fiscal crisis are important contributing factors, but the dominant role in internal warfare appears to be played by elite overproduction leading to intraelite competition, fragmentation, and conflict, and the rise of counterelites who mobilize popular masses in their struggle against the existing order.
The three generalizations we have just discussed are only a sample from many more potential generalizations arising from recurrent patterns that we noted in the historical cases we studied. For example, there may be a general principle underlying the shifts in social mood from a desire for change to a yearning for peace and stability, which appears to play an important role in creating relatively peaceful interludes during the disintegrative trends (what we termed the fathers-and-sons cycles) and in ending the disintegrative trend, a reversal that starts the new secular cycle. It is possible that this pattern can be quantified, perhaps by analyzing the content of speeches, political writings, and newspaper editorials, but this remains a task for the future.
Our concluding thoughts are these. We believe it is possible to obtain quantitative empirical estimates for many variables that are needed to test theories of historical dynamics. Furthermore, our models, and the demographic-structural theory in particular, have matured to the point where they can be used to make quantitative and testable predictions. Many of these predictions are supported by the data. Others failed, but often in interesting ways that suggest further development of the theory. The historical process is very complex, and we have to live with severe data limitations; nevertheless, it is possible to apply the standard scientific approach to the study of history. We are optimistic about the future prospects of history as science.