You can achieve even more sophisticated statistical analysis leveraging Tableau's ability to integrate with R or Python. R is an open source statistical analysis platform and a programming language with which you can define advanced statistical models. Python is a high-level programming language that has quickly gained a wide following among data analysts for its ease of use, especially for data cleansing and manipulation as well as statistical functions.
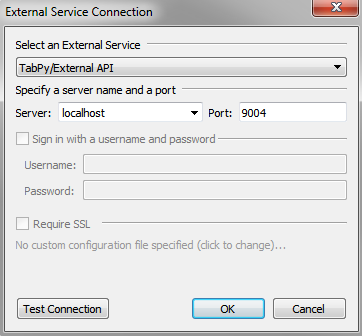
Once you've installed an R Server or TabPy, you may configure Tableau to communicate with the platform. From the menu, select Help | Settings and Performance | Manage External Service Connection. This will give you options for making the connection to the R Server or TabPy:
At this point, you may create calculated fields that invoke R and Python functions. Special table calculations (all of which start with SCRIPT_) allow you to pass the following:
- Expressions and values to a running R Server, which will evaluate the expressions using built-in libraries or custom-written R scripts and return results to Tableau
- Full Python scripts to TabPy to execute and return results to Tableau
For example, you might create a calculated field named Book Title to use Python script to transform the values of the title field from lowercase to uppercase:
SCRIPT_STR("import re

exceptions = ['a', 'an', 'of', 'the', 'is', 'for', 'in', 'into', 'to']
return_list = []

for title in _arg1:
    word_list = re.split(' ', title)
    capitalized_title = [word_list[0].capitalize()]
    for word in word_list[1:]:
        capitalized_title.append(word if word in exceptions else word.capitalize())

    return_list.append(' '.join(capitalized_title))

return return_list

", ATTR([title]))
The entire Python script is wrapped in the SCRIPT_STR() function, which also takes in the attribute of the field title and then returns a string value having transformed it to title case.
Both R and Python may be used for far more than statistical analysis. You can implement predictive models, data cleansing, spatial transformations, and more! The possibilities are endless.