As we have seen in the last chapter, short-termism is a key risk to your long-term performance. In fact, I think that short-termism is the number one performance-killer for most private and professional investors. This is the reason why almost every financial planner and institutional investor in the world will tout the benefits of long-term investing.
I am no different. Not only am I a long-term investor, but I have a particular bias towards value investing and contrarian investing, two disciplines that require the investor to stay committed to a given investment over long time frames, often years. With these investment styles, the investment will often decline significantly before it recovers and lives up to its promise, so investors need to be prepared to hold on for the long run.
However, long-term investing can sometimes go very wrong as well; there are risks to performance from being the wrong kind of long-term investor. But, since I would never make such mistakes (or at least not publicly admit to them), let me tell you the story of a friend of mine.
Assume this friend of mine invested in the shares of a company that seemed extraordinarily good value. Nobody liked the business model of the company, and the consensus amongst investors was that the company would struggle to remain profitable in the face of rapid technological change. As a result, the valuation of the stock was very attractive and the expected future growth was low. The investment provided the holy grail of contrarian long-term opportunities: low valuation, a pessimistic growth outlook and shunned by the market.
So, my friend bought the shares and watched them… drop in price. Obviously, my friend, being the long-time investor that he is, did not panic. This had happened to him before and the investment case was solid. Then the shares dropped more, and then even more.
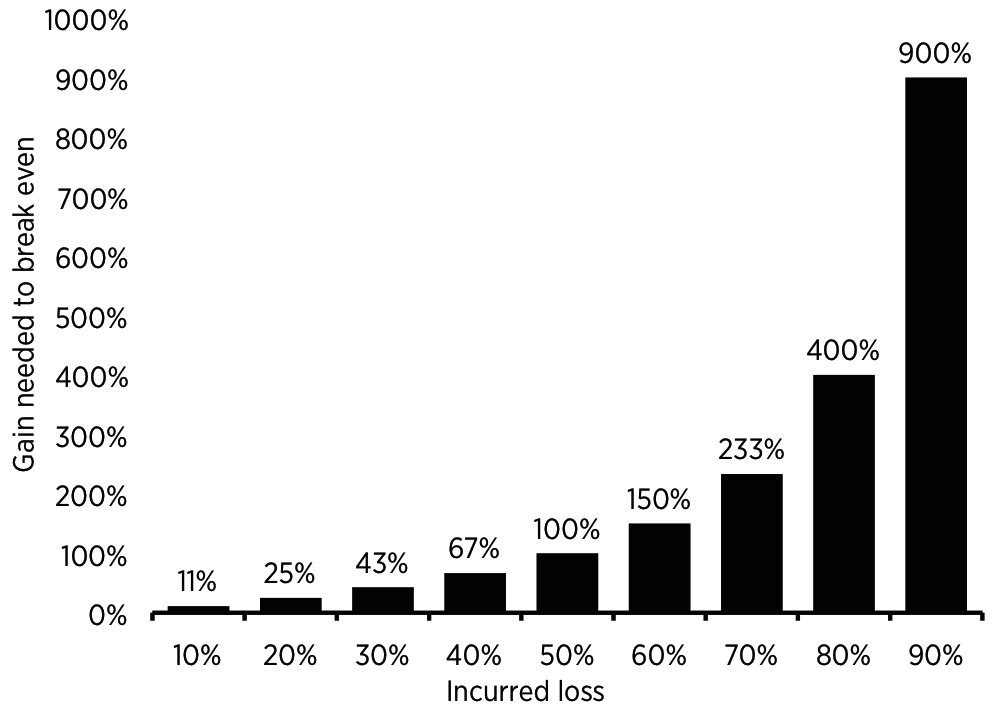
Figure 3.1 shows the percentage gain needed to recover a given loss in an investment. When the investment was down 10%, my friend needed an 11% rally in the share price to recover all his losses. When the investment was down 50%, he needed a 100% rally (or a doubling of the share price) to break-even. And when he finally had enough and sold the investment at an 80% loss, he needed a 400% rally to recover his losses.
To be sure, there are circumstances in which a company increases its share price by a factor of five, but these cases are like winning the lottery. Normally, to get to a 400% return requires not years but decades. And after all that waiting, my friend would still not have made any profits on his investment. Obviously, this was a long-term investment that went horribly wrong. But where was the mistake? Was it the contrarianism? Was it the value approach? Or was it something else?
Figure 3.1: Percentage gains needed to recover losses
Source: Author’s calculations.
Contrarian investing for the long run
There are many ways to superior long-term investment performance. The simplest and, in most cases, best way is to invest in low-cost index funds and ETFs that replicate the performance of a given market, or asset class, and hold on to them for a long time. This will provide investors with the average return for these markets and asset classes and, if they hold on to these investments for many years, then the power of compound interest will grow their wealth exponentially over time.
In my personal investments, I have a core portfolio of index funds that are well diversified and allocated to different asset classes in such a way that I have a good chance of achieving my long-term investment goal of retirement security.
But, just like most investors, I am not content with average returns. I want to have above average returns and outperform the stock market with some of my investments. And I am overconfident enough in my abilities as an investor that I think I can do this by selecting single stocks or bonds, or specific themes in an asset class or market, that will give me superior performance in the long run.
These satellite investments are where things get interesting and require active management of my portfolio. The number one thing every investor has to realise is that if they want to generate superior performance, they have to take on a contrarian view to the market consensus in these investments. As the investment legend Howard Marks so succinctly put it: “You can’t do the same thing as others do and expect to outperform.”
This simple fact can be empirically verified. Investors know that the average actively-managed mutual fund underperforms its benchmark. Thus, if an investor buys the same stocks or bonds that most of the fund managers buy, he should expect to get a similar performance than the average fund manager; that is, a performance below the market average.
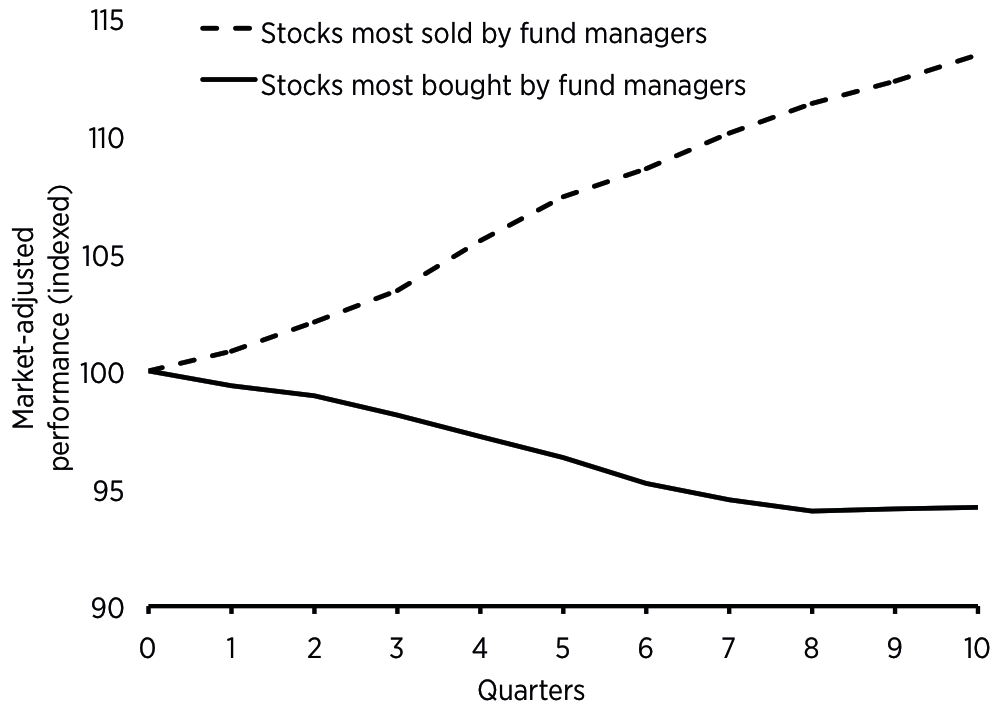
Figure 3.2 shows an analysis of the stock portfolios of 1,130 institutional investors from 1983 to 2004. These investments totalled more than $2trn. The researchers looked at the stocks and who owned them. Then, they grouped the stocks into different categories depending on how common it was for investors to buy these stocks into their portfolio, or how common it was for these stocks to be sold out of a portfolio. They tracked the performance of the stocks most commonly bought and sold.
Over the subsequent ten quarters, the stocks that were most commonly sold outperformed the most loved stocks by 18%. In other words, if you want to outperform the average institutional investor, just buy the stocks they are selling.
Figure 3.2: Performance of shunned and loved stocks
Source: Dasgupta et al. (2011).
Contrarian investing versus momentum investing
Contrarian investing is hard because often it requires the investor to buy stocks or bonds that have gone down in price. This decline will have been the result of some fundamental reason, which is why many investors shun these stocks. Thus, contrarian investing often, though not always, equates to doing the opposite of a momentum investor.
Momentum investing is the domain of short-term investors and can be a highly successful strategy. In fact, momentum investing is one of the examples where – to use the terminology of the last chapter – the long term is indeed the sum of short terms. Momentum investing has been proven to be a reliable market factor that generates superior returns in the long run.
Yet, if we look at momentum funds, both in the mutual fund and hedge fund space, their performance relative to their benchmark, and after adjustments for size, style and other factors, is very low (Figure 3.3).
Figure 3.3: Performance of contrarian and momentum funds

Source: Grinblatt et al. (2011).
In the case of momentum-driven mutual funds, they tend to underperform their benchmarks by 0.4% per year on average. I don’t know exactly why the performance of momentum-driven funds is so poor when the academic research points to a significant outperformance of momentum stocks over the market in the long run, but I suspect it is a combination of too much trading (hence ramping up costs) and trying to overcomplicate the trading rules with additional quirks that eventually cost performance.
But, whatever the reason for the poor performance of momentum-driven funds, Figure 3.3 shows that contrarian funds outperform momentum-driven funds both in the mutual fund and hedge fund space. Thus, I conclude that it wasn’t the contrarianism that cost my friend his performance.
Value investing for the long run
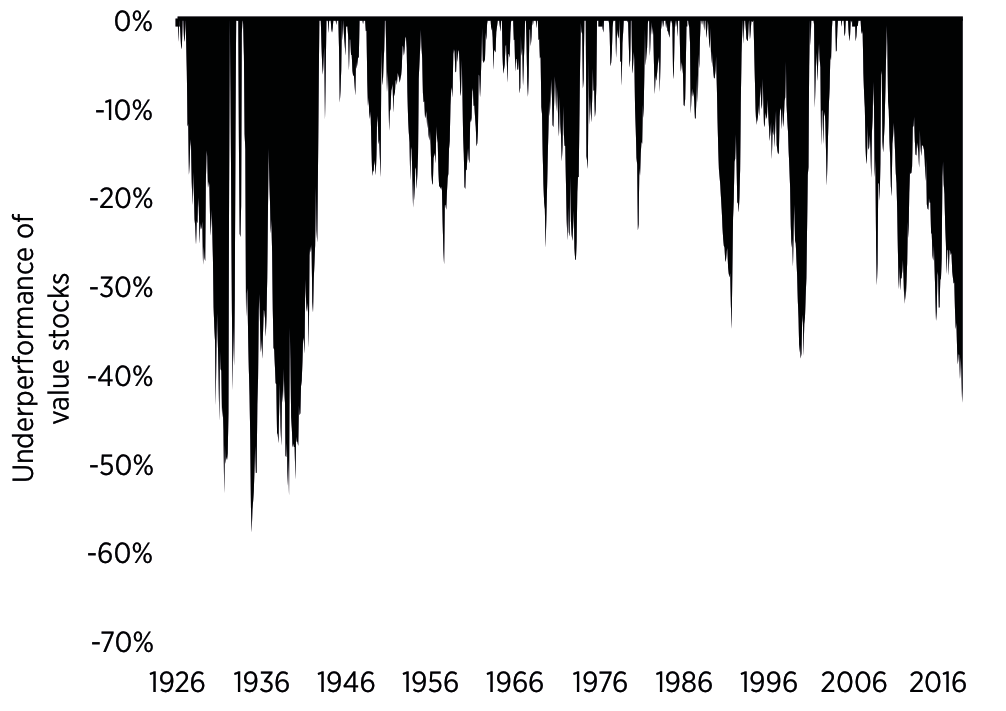
Maybe it was the value approach that led to the significant underperformance of my friend? After all, value stocks can underperform growth stocks for a very long time. Figure 3.4 shows the length and size of the underperformance a value investor would have to endure if she bought the 20% cheapest stocks in the US stock market relative to the 20% most expensive stocks. On average, buying the 20% cheapest stocks would have outperformed the 20% most expensive stocks by close to 5% per year, but as the figure shows, there have been long periods of large underperformance.
Figure 3.4: Periods of underperformance in value stocks
Source: K. French website.
If an investor had purchased the cheap stocks in 1927, he would have underperformed the expensive stocks pretty much all the way until 1944 and, at one point, his portfolio would have lagged by 58%. Similarly, value stocks have underperformed the most expensive stocks since 2007, and the underperformance has been as large as 43%.
In other words, it might take more than a decade for value stocks to show their superior performance. We know from the academic research of Campbell Harvey and his colleagues that the outperformance of value stocks is real and above suspicion but, unfortunately, it is not consistent. There are long periods of massive outperformance of value stocks interspersed with equally long periods of underperformance.
On top of that there is the challenge that all investment styles face: how to define value. Just like there are many different approaches to momentum investing, there are many different approaches to value investing.
Amongst the most prominent valuation indicators is the PE ratio, where the price of a stock is divided by its earnings per share. Here, the discussion starts with the question of which earnings per share to use. Should we use the earnings of the last 12 months, which may not be a good indicator of future earnings? Or should we use the earnings per share that analysts expect to materialise in the next 12 months? As you might recollect, I am a strong advocate against using analyst estimates of future earnings and would only use earnings per share of the preceding (trailing) 12 months.
But there are other approaches to value. In the academic literature, value is often measured using the price-to-book ratio, where the price of a share is divided by its book value of common equity. This has the advantage of avoiding the embarrassing situation where a company loses money and earnings per share become negative. After all, what is a PE ratio of −10 supposed to mean?
Another approach to measuring value that has been popularised by Robert Shiller of Yale University is the Cyclically-adjusted PE ratio (CAPE). The idea behind this ratio is to divide the current price of a share by a long-term average of past earnings per share that spans an entire business cycle. This way, the investor averages out good times and bad times over a cycle, and gets a better understanding of the long-term average profits a company is able to generate.
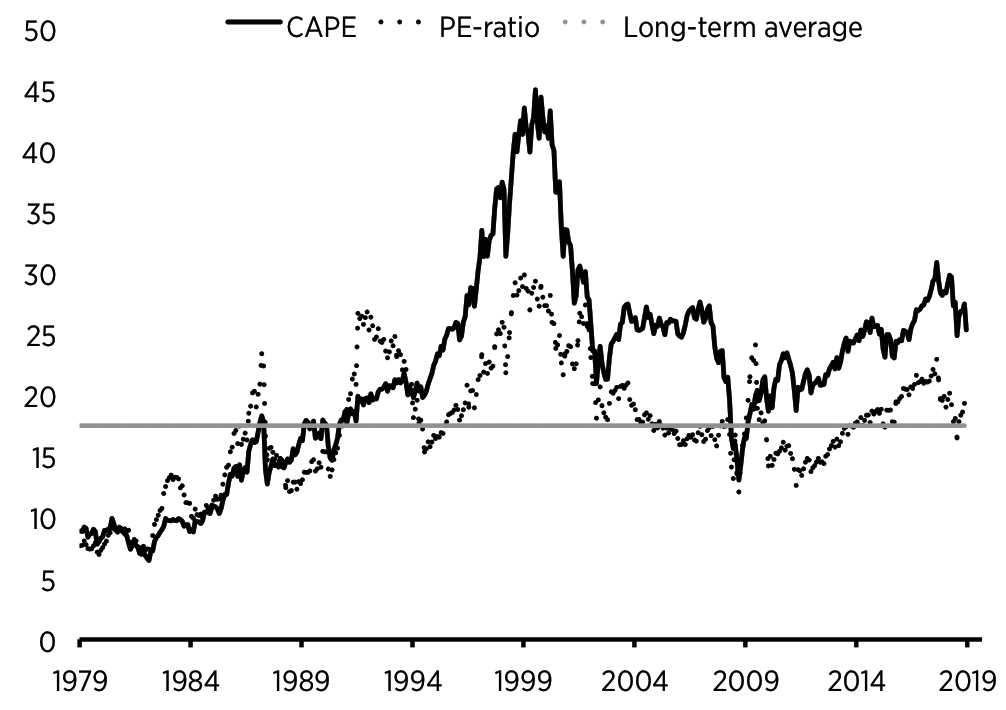
Historically, the CAPE ratio can be traced back to the founder of value investing, Ben Graham, who used a seven-year average of past earnings per share. However, today, most investors follow the convention of Robert Shiller, who uses a ten-year average. Figure 3.5 shows the CAPE and PE ratios for the US stock market since 1979, as well as the long-term average for the PE ratio over those five decades, which is 17.5.
Looking at the figure, you can see how stock markets appeared very cheap in the late 1970s and early 1980s. Back then, the US was in the grip of runaway inflation and stocks had basically moved sideways for about a decade. Investors were so disillusioned that some people wondered if this was the death of stocks. Of course, it wasn’t, and investors who purchased US stocks in the early 1980s would have enjoyed the longest and strongest bull market in history, culminating in the tech bubble of the late 1990s.
In 1999, both PE and CAPE ratios reached their highest valuation levels ever recorded. But it was only if you looked at the CAPE ratio that you could start to grasp the immense magnitude of the stock market bubble in the late 1990s. At levels above 40, the CAPE was more than twice as high than it had been on average over the previous hundred years.
When the tech bubble burst in 2000, and the global economy experienced a recession in 2001 and 2002, stock markets fell deep. The S&P 500 index in the US lost about half its value while the tech-heavy Nasdaq Composite Index dropped more than 80%. Remember Figure 3.1 above? When the S&P 500 was down 50%, an investor needed a 100% rally to recover their losses. Indeed, it took until May 2007 before the S&P 500 would surpass its highs of early 2000. The Nasdaq, on the other hand, would need a 400% rally to recover its losses, and it took until 2015 to surpass the high of 2000.
One of the reasons why the CAPE has become much more prominent as a valuation indicator in recent years is that, unlike the regular PE ratio, it warned investors of the financial crisis of 2008.
Figure 3.5 shows that, in 2007, the CAPE was still significantly elevated while the PE ratio had been hovering around its historic average for some years. The advantage that the CAPE had at that time was that it put less weight on the most recent earnings and more weight on the low earnings of the recession in the early 2000s. Thus, while the PE ratio was artificially low, due to the excessive and unsustainably high earnings of banks in the housing boom, the CAPE indicated that these high earnings would not be sustainable if a recession came. Investors who paid attention to the CAPE would have reduced their equity exposure before the financial crisis hit.
Figure 3.5: US stock market valuation
Source: Bloomberg.
Figure 3.6 shows the performance and assets under management (AUM) of a US mutual fund run by an investor who paid attention to the high valuations of the CAPE before the financial crisis. This is a fund that invests in US stocks only and follows a long-term investment strategy that aims to outperform the market over a cycle or more.
In keeping with this long-term orientation, the manager uses the CAPE, and other long-term valuation measures, as a guide to his equity exposure. If the market seems overvalued, the manager tends to hedge the downside risks of equity investments to some degree, or, in extreme cases, completely (effectively turning the fund into a money market or equity market neutral fund).
If, on the other hand, markets seem cheap, the hedges are removed and the fund gets full exposure to US stocks.
Figure 3.6: The danger of being too long-term oriented

Source: Bloomberg.
Before the financial crisis, the fund was quite successful and had about $3bn AUM. And, while the fund lagged behind the S&P 500 in 2006 and 2007, the fund manager was vindicated in 2008 and 2009 when markets collapsed but the fund had only minimal losses. At the height of the financial crisis in early 2009, the fund had achieved its goal of outperforming the S&P 500 over a cycle. In the preceding five years, the stock market had gone all the way from the aftermath of a recent bust, to a boom, and back to bust again. Meanwhile, the fund avoided both the extreme boom and bust to create a much smoother ride.
This success by the fund manager did not go unnoticed and, in the aftermath of the financial crisis, the fund increased its AUM to almost $7bn. And the fund manager did exactly what he was supposed to do. He stuck with his proven long-term investment approach and looked at stock market valuation through the lens of the CAPE.
But look at Figure 3.5 again and the signal the CAPE sent since 2009. It was constantly in overvalued territory. Hence, the fund manager concluded that the stock market was still a risky investment and could experience another significant decline any moment. As a result, the fund manager kept the hedges and downside protection in his fund in place.
The result was devastating for the performance of the fund. In the ten years between March 2009 and March 2019, investors in the fund lost 52% of their investment, while the S&P 500 index gained 338%. No wonder investors eventually gave up on the fund manager and withdrew large amounts of assets. In March 2019, the assets under management of the fund had shrunk to just $326m – less than one twentieth of the assets at its peak.
To make matters worse, if the fund manager wants to catch up with the S&P 500, the market would have to drop by almost 90%, while his fund remained fully hedged and incurred no losses at all. This would be a decline bigger than any we have ever seen in the history of the S&P 500. Even during the Great Depression, the US stock market did not drop by that much.
Learning from short-term investors
And this provides a clue to the mistake my friend from the beginning of the chapter made. The mistake wasn’t with his contrarian investment position nor his value approach, it was his stubbornness. A long-term investment approach is highly recommendable, but there comes a point when losses in the interim become so large that it is virtually impossible to ever break-even again. If you then still stick to your investment, you are no longer a long-term investor, you are just stubborn.
Long-term investors – and especially value investors – like to look down on traders who allegedly ‘trade on noise without a fundamental understanding of the investments they buy or sell’. Be that as it may, long-term investors can learn some important lessons from professional traders and other short-term investors.
First of all, traders tend to be agnostic about the reason why a stock or bond rises or falls. They buy a stock when they see additional demand for it in the market, or when the price momentum is up and looks like it is going to remain intact. They don’t care if a stock climbs due to its attractive valuation, its great profits in the last quarter, or because it just announced a change in CEO.
They also don’t care to find out why the stock, at some point, stops its climb. They couldn’t care less, they just sell the stock, bag the gain, and move on to the next investment. Similarly, if a stock declines, they don’t care why it does so, they just sell the stock and stay away from it, or they short the stock and hope to make a profit as the share price continues to decline. And at some point, they might reverse their position and buy the stock again but, until then, they don’t really care what is driving the price.
Long-term investors, on the other hand, tend to follow an investment philosophy like value investing. This is the correct approach for them because, without a strategy, the risk is that the long-term investor will fall prey to short-term fluctuations – selling investments after a short-term setback or buying investments after a short-term bounce. In other words, for a long-term investor, the investment philosophy, and the strategy for implementing that philosophy, prevents them from falling prey to the temptations of short-termism.
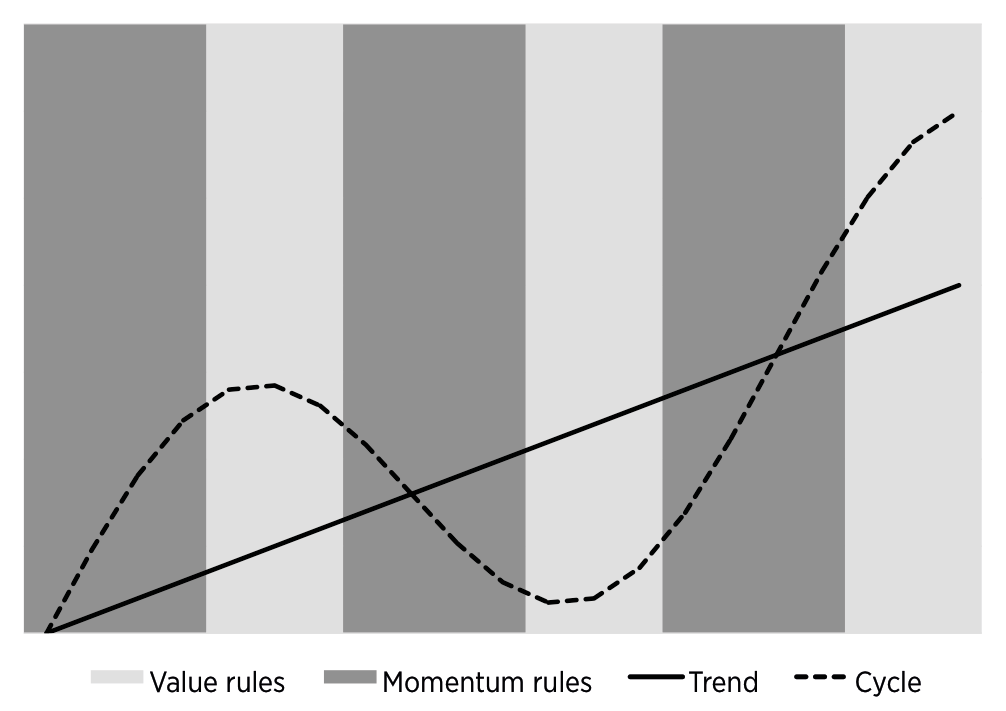
But the problem is that there is no investment strategy that works all the time. As markets go through the ups and downs of a cycle, there are phases when momentum investing is the most successful approach, and phases when value or contrarian investing are more successful (Figure 3.7).
Figure 3.7: Contrarians and momentum investors in the cycle
Source: Author.
Many investors and academics have tried to figure out how to time the market and switch from momentum to value, and back again, in order to maximise the performance of their portfolio. But, after almost a hundred years of market research, there still seems to be no one who can time the market successfully. Keep this in mind the next time someone presents you with a strategy to time the market or suggests you switch from one investment to another in a systematic way to improve performance.
This person effectively makes the claim that he (or she, but mostly he) is smarter than all the legends of investing of the past. He is smarter than Warren Buffett and Peter Lynch, George Soros and Howard Marks, etc.
Most of the time, these market timing strategies have only a short history of successful performance when they are being sold. It is as if a 12-year old kid comes to you and says that he is faster than Usain Bolt was at that age and thus, when he has grown up, he will become the fastest sprinter of all time. Would you sponsor this kid for the next ten years or more in the hope that he will become the next Usain Bolt?
The secret of successful traders: emotional detachment
Because there is no known way to time the market, long-term investors have to stick with their investment strategy for a long time – even if it temporarily stops working. And this is when human psychology comes into play.
The feeble-minded will abandon a successful long-term strategy too soon when it experiences temporary setbacks. The stubborn will keep holding on to a long-term strategy even if it has stopped working for so long that is has no reasonable chance of recovering.
In many cases, these investors become emotionally attached to their investments and their investment philosophy. They start defending it against all kinds of criticism, using ever more outlandish arguments why the investment has to turn around sooner rather than later.
What happens, in effect, is that the investment strategy slowly turns into a religion and a dogma. And dogmas cannot be questioned – it is often seen as heresy and, the more it is questioned by outsiders, the more the investor digs in. It effectively becomes a fight of us (the enlightened group of believers in strategy X) versus them (the heretics who claim that X does not work).
These dogmas are particularly prevalent in exotic niches of financial markets that are hard to value, or that have little history on which to assess the validity of the strategy. In the late 1990s, the dogma amongst tech stock investors was that technology would revolutionise the world and old valuation metrics were no longer valid.
In the early 2000s, the dogma was that house prices always go up. In recent years, the dogma has been that cryptocurrencies will replace traditional money. And an eternal favourite is the dogma that gold protects against inflation. All of these dogmas may be true in the long run, but as the famous saying goes: markets can stay irrational longer than you can stay solvent.
The second lesson long-term investors can learn from traders is the ability to stay emotionally disconnected from their investments and performance. Traders make dozens, if not hundreds, of investment decisions a day – many of which end in a loss. As a result, successful traders have learned to cut losses quickly and move on. The mantra of a successful trader is that cutting losses lets you live to fight another day. Stubborn long-term investors, like my friend at the beginning of this chapter, stay onboard the Titanic long after it hit the iceberg. They would prefer to sink and die with the ship rather than admit defeat and change tactics.
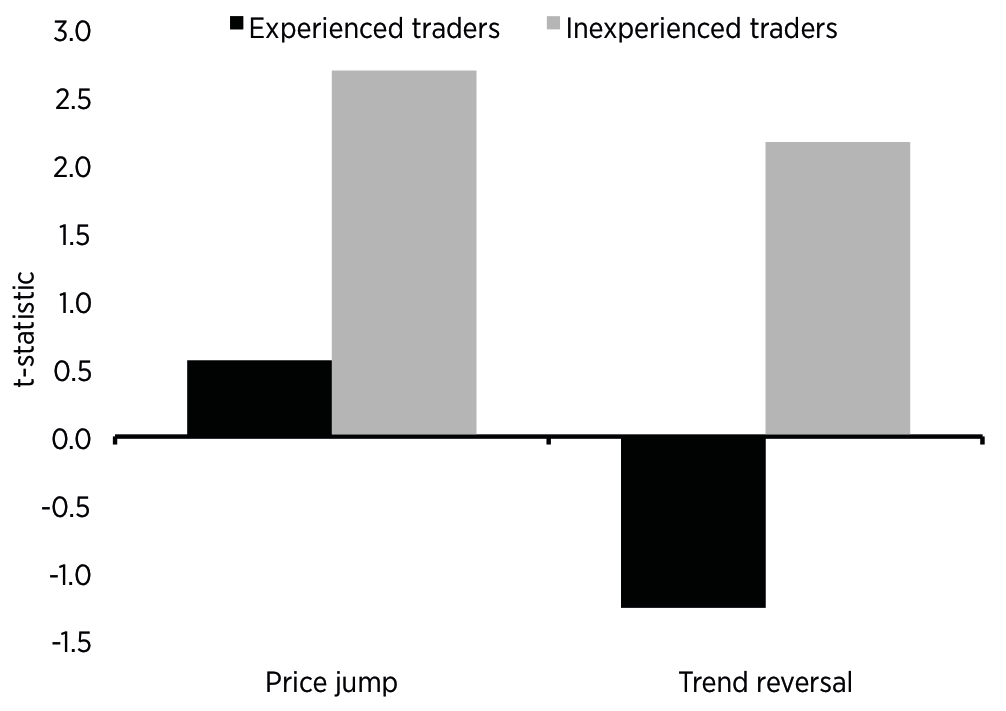
Admittedly, abandoning a sinking ship is very hard to do emotionally. In the early 2000s, Andrew Lo and Dmitry Repin wired up ten professional currency and fixed income traders as they were doing their normal jobs. They measured several physiological measures of stress and emotion like heart rate, blood pressure or the sweatiness of the palm of their hands.
Figure 3.8 shows the change in skin conductivity (i.e. the sweatiness of their skin) of experienced and inexperienced traders during large price jumps and trend reversals in the assets they were trading. The t-statistic indicates how significant the change in skin conductivity is. Experienced traders showed much lower levels of excitement and perspiration, they were extremely cool when compared to the less experienced traders. And in the case of a trend reversal, they even calmed down, while the inexperienced traders got more stressed.
When researchers looked at the performance of the traders, it turned out that the more experienced traders had better performance. Therefore, the ability to detach themselves emotionally from their investments and the market action contributed positively to their performance. If long-term investors can keep an emotional distance from their investments and their investment strategy, they can more easily tweak or abandon it when it has stopped working. In this way, they are less likely to fall prey to stubbornness and dogmatism.
Figure 3.8: Change in skin conductivity of traders
Listen to the data to rein in your emotions
In my view, the best investors are long-term investors that have an eclectic investment style – one that adopts best practices from other investors. Thus, if you are a long-term investor like me, you might want to think about how to learn from experienced traders and become less emotionally attached to your investments.
One way to keep emotions in check is through data. If an investor analyses a specific investment, they must look at all the available facts. That includes valuation, earnings, price momentum, investor sentiment, geopolitics, environmental risks, etc. The range is broad, and the influence the different factors exert on an investment changes over time. But, hey, this is why investing is so exciting. No two times are the same, so it is never boring.
Imagine you are thinking about investing in the shares of a well-established food company that has been around for many decades and is one of the leaders in the global food industry. Recently, trends in food consumption have changed, as many consumers want to eat healthier food that contain lower amounts of chemicals, additives, salt and fat. Furthermore, the rise of organic food provides an opportunity for the company to increase its profit margin. This would, however, also increase operational risks, since a food scandal could lead to a significant drop in profitability.
So, company management decides to transform the business to fit a healthier product shelf. Investments will be made into organic food production and the new trend towards plant-based meat-replacement products. In the existing convenience food products, like ready-made meals, management decides to change the recipe and reduce the amount of salt and fat. Simultaneously, the company decides to launch a new range of healthy convenience food. Because sugar taxes are introduced in more and more cities and countries around the world, the company also decides to put its division that makes soft drinks up for sale. How should you, a potential investor, assess this investment?
As a long-term investor you think about metrics that are relevant for the long-term performance of the shares first. For example, you look at the valuation of the stock and it turns out that, at a PE ratio of 18 and a CAPE of 20, it seems slightly expensive compared to its historical average. Yet, compared to other global food companies, it is relatively cheap.
The company has a history of being profitable even in the deepest recession and has never had to cut its dividend. Thus, it seems even if the company ramps up investments during its transformation, or if the economy slows down and drops into recession, the business should still be able to operate profitably and pay an attractive dividend.
Organic growth of the business has been meagre over the last five or so years, at a mere 3% per year, and profit margins have been relatively low. Chances are, if the turnaround in the business is successful, organic growth rates could accelerate to 5% and profit margins could increase substantially.
On the other hand, you know that the competitors of the food company are undergoing similar transformations, and, as you investigate, you find that the current management does not have a history of successful business transformations. Instead, they are a group of safe hands to manage the company in a solid and stable manner. Thus, it is unclear if management is committed to the transformation and, if so, if it will be successful.
Furthermore, the increase in sugar taxes around the world means that selling the soda business will be very hard. Potentially, the business will have to be sold at a much lower price than management thinks it is worth.
You can see that the picture is a mixed one. A value investor would likely consider an investment, as the company is valued attractively relative to similar companies and is not too expensive on an absolute basis. A traditional equity analyst, who looks predominantly at earnings growth, would likely endorse the investment as well, since chances are a successful transformation of the business would boost future growth and profitability.
A sentiment-driven investor would likely not invest in the stock because the management seems to have little credibility with investors, and the market will likely remain sceptical about the transformation for some time. And an activist hedge fund investor might be attracted by the valuation of the business, but may be uncertain if it is possible to sell the soda business and unlock hidden value in the company with the current management team.
In short, depending on your strategy, the stock is either a buy or a sell…
Being aware of these contradicting views is the first step to becoming a more successful long-term investor. If you decide to make the investment, the relative influence of these factors will change, and thus your assessment should change as well. The company may still be good value in a year or two, but if management bungles the business transformation and sinks billions into projects that ultimately don’t become profitable, then all the value in the world will not help to turn around the share price. This might be a case when the investor has to cut their losses and abandon what seemed like an attractively valued position.
The big question is how to weigh the different viewpoints against each other. It is easy to say that after management bungled the business transformation that the stock should not be sold. Rather, an investor should hold on to stock until new management comes in, at which point market sentiment will flip and the share price should jump. But that moment may or may not come, and, when it finally arrives, the relief rally may be far weaker than expected.
A mental model of data aggregation
My mental model for aggregating these different influences on a company’s share price is to think of a ball on a billiard table (Figure 3.9). Unlike a normal billiard table, the ball is attached to the different sides of the table with rubber bands. These rubber bands have different lengths and strengths, and represent the different factors that can influence the share price. In the beginning, the ball rests on the table and does nothing. It just is attached to a few rubber bands.
Figure 3.9: A mental model of the different drivers of investment performance

Source: Author.
Then, one of the rubber bands will be stretched and – as rubber bands tend to do – it tries to relax again, which gets the ball moving on the table. As the ball starts to move along the table it will start to stretch other rubber bands. Most of the time, the different rubber bands will not move the ball because they are relaxed or only a little bit stretched. However, in the situation I have described above, the rubber band symbolising market sentiment has stretched because the company management has just announced a corporate strategy that lacks credibility given their track record. This stretched rubber band will now start to influence the ball as it relaxes.
This movement of the ball will impact the other rubber bands and it is possible that as the sentiment rubber band relaxes, the earnings rubber band will become stretched. The earnings rubber band is thicker and stronger than the sentiment band and, thus, when it becomes stretched, it will change the direction of the ball.
In other words, as negative sentiment keeps dragging the share price lower, the outlook for future earnings growth may improve as company management delivers some first successes in the transformation of the business. Suddenly, the prospect of higher earnings growth drives the share price higher.
But, after a while, the earnings band may relax and another rubber band becomes stretched. The strongest and most influential rubber band of them all is the valuation of the company but, as you can see in our figure, as long as the valuation is not stretched (either extremely cheap or extremely expensive), it won’t exert much of an influence on the direction of the ball.
This mental model of my investments has helped me, time and again, make sense of contradictory information. Furthermore, it helps me put my investment strategy, which remains driven by valuation considerations, into perspective. I can sometimes abandon a pure value strategy if I can identify other factors that pull the ball in another direction. Also, if an investment starts to lose money, the mental model helps me assess how long it might take before my initial investment rationally takes hold again, and valuation starts to drive the share price again.
The second technique I have come to embrace, even though it is not part of the traditional toolset of long-term investors, is stop-losses. Traders and other short-term investors use stop-losses all the time to automatically sell a losing investment before it can cause too much damage in a portfolio. Long-term investors should embrace this simple risk management technique as well, because it can override the emotions of an investor and thus protect the portfolio when the investor may have already become too stubborn.
Data is not always able to override the emotions of an investor. Confirmation bias is our natural human tendency to discount information that contradicts our previously held beliefs, and overweight information that confirms our beliefs. I will talk more about confirmation bias and its impact on performance, as well as ways to overcome it, in Chapter 5.
Where to place a stop-loss?
The problem with stop-losses as part of your investment strategy, though, is that they might trigger at the worst possible moment in time, just before a recovery starts. Furthermore, what do you do after a stop-loss has triggered? When do you consider the investment again and think about a potential re-entry?
I have pondered these thoughts for a long time, and summarised my beliefs in an academic paper, but the main takeaway is, depending on your investment horizon, stop-losses should be set pretty wide for long-term investors, and narrow for short-term investors.
If you are a trader, a two or five percent drop in an investment might already trigger a stop-loss, since you are likely to make so many investments in a day or a week that even such small losses can quickly accumulate to a massive decline in wealth.
For a long-term investor, it is typically better to set stop-losses so far away that the typical short- to medium-term fluctuations of the market do not accidentally trigger the sale of an investment that might have turned out well in the long run. You only want to sell if the loss becomes material for your long-term portfolio strategy.
In my experience, there are two simple ways to place stop-losses: moving averages and drawdowns. The moving average strategy triggers a stop-loss once the price of an investment drops below a moving average of past prices. Traders might use 20-day or 5-day moving averages, while long-term investors are typically better off with a 200-day, or even a 400-day, moving average. These long-term averages typically only trigger a sale once an investment has already dropped significantly, but they can still prevent an investor from incurring devastating losses in the range of 20% or more.
The second approach to stop-losses, and the one that I have investigated in my paper and use myself, is to look at past performance and place stop-losses based on the asset’s own price history.
As a long-term investor, you don’t want to react to short-term fluctuations, so it is better to look at the longer-term trend. It turns out that looking back at performance over the last 12 months creates a long enough period to ignore short-term setbacks, but not too long to wait forever before triggering a stop-loss. Once the share price drops more than a certain amount over the last 12 months, it is safe to assume that the shares are in an extended downtrend that is unlikely to reverse soon.
Of course, the downtrend could just be part of a range-bound sideways movement, so the trigger for the stop-loss should be reasonably far away from the highs of the last 12 months. In my research, I found that, as a rule of thumb, a stop-loss is best placed at a decline of half a standard deviation below the high of the last 12 months. That sounds awfully technical, but what it means is that for stocks, which typically have standard deviation of around 20% per year, the stop-loss should be set at 10% below the peak of the last 12 months (or at 10% below the purchase price, if the stock was purchased less than 12 months ago). If the share price declines more than 10%, the position should automatically be sold.
While a 10% stop-loss is appropriate for equities, other investments with lower volatility require a stop-loss level that is closer. For emerging market bonds and high yield bonds, both of which have an annual standard deviation of returns around 7–10%, a stop-loss level at a 12-month decline of 4% to 5% makes sense. For corporate bonds, with their extremely low volatility of around 5%, a stop-loss level might be chosen as low as 2.5%.
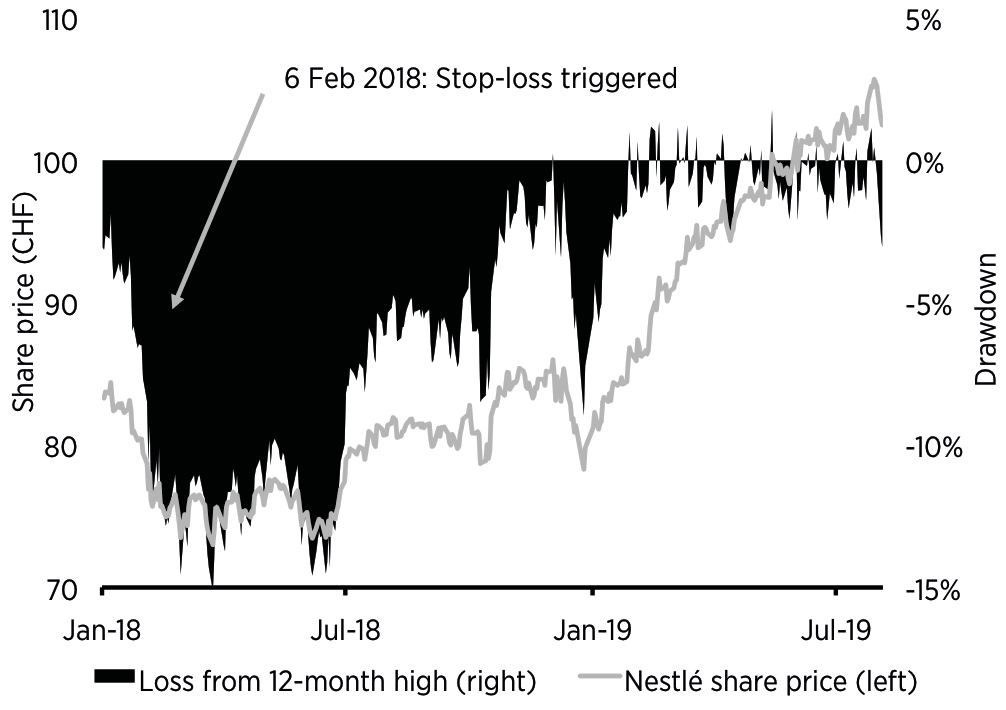
To show how this works in practice take a look at the share price of Swiss food company Nestlé, a company that goes through a transformation process not unlike the one described for the hypothetical food company above. Figure 3.10 shows the share price of Nestlé in Swiss francs since the beginning of 2018, together with the drawdown from the most recent 12-month peak. As Nestlé went through its transformation process, the organic growth rate of the company dropped precipitously, which led to a decline in share price from its 2017 highs. On 6 February 2018, the drawdown reached the critical level of 10%, which is the stop-loss level I recommend for stock investments. At that point in time, investors were quite concerned about Nestlé and its growth outlook so, theoretically, the decline in share price could have gone on for much longer. In fact, throughout February and March the share price declined some 5% more from the levels that triggered the stop-loss.
The chart, however, also shows that in the case of Nestlé, the share price quickly recovered again and went on to perform strongly in 2018 and 2019. If we had just established a stop-loss rule without a re-entry rule, we would be quite mad by now because the stop-loss would have forced us to sell the shares and we would have missed out on a rally of more than 20% in the share price. Which is why I emphasise that if you have a stop-loss rule, you also need a re-entry rule.
Figure 3.10: Stop-loss signal for Nestlé in 2018
Source: Bloomberg, Author.
When to re-enter a position?
Once the stop-loss has been triggered and the investment sold, the question is what to do with the cash? If there are other investment opportunities, the investor might use the proceeds from the sale to invest in these opportunities. But, often, a long-term investor has put the stop-loss in place to avoid a broader market downturn.
If, for example, equity markets are hit by another global bear market, equities might decline by way more than 10%. After the tech bubble burst in 2000, and during the global financial crisis of 2008, equity markets declined on average by 40–50%. The goal of the stop-loss is to avoid such significant losses in the portfolio. But bear markets don’t last forever and, at some point, the investor might want to buy the same investment again. Similarly, in the example of Nestlé above, the shares might eventually recover from their short-term losses and the investor might miss out on a substantial rally if there is no re-entry signal in place.
Even a casual glance at the history of financial markets teaches us that recoveries after a correction or bear market happen much faster than the preceding decline. Thus, if an investor used the same 12-month rule to decide whether or not to buy an investment again, they would typically miss out on much of the recovery after a correction. It is typically advantageous to set the re-entry signal for investments based on shorter-term performance.
In practice, I recommend entering a position again after the trailing three-month return has exceeded one quarter of the annual standard deviation of returns.
All this means is, for equities with their 20% standard deviation, the stop-loss signal should be set for a decline of more than 10% from its 12-month high, but the re-entry signal (i.e. the buy signal) should be set for a 5% recovery from its three-month low. This way, the investor only misses out on a small part of the recovery and re-invests pretty soon after a recovery has been established.
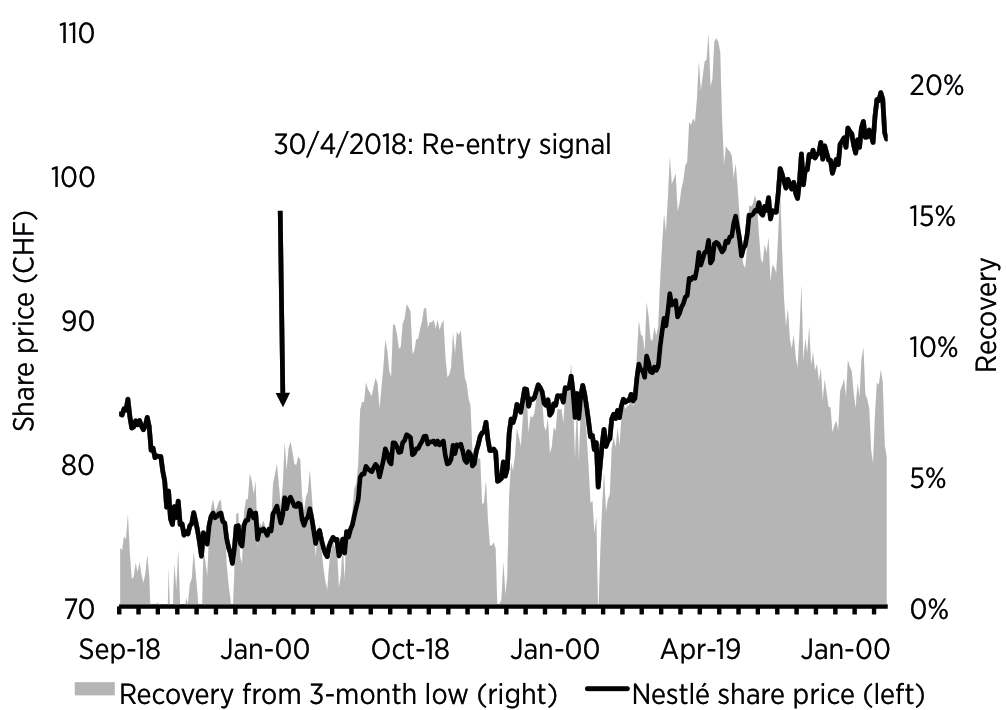
Figure 3.11 shows how this would have worked in the case of Nestlé. Once the investor has been stopped out in February and sold the shares, it is wise to continue to monitor the share price and look for a rally of 5% or more from the most recent 3-month bottom. After moving sideways for two months, the share price of Nestlé finally rallied more than 5% from its most recent bottom on 30 April 2018. This was when the investor would have bought the stock again. While the risk of a stronger decline in the shares of Nestlé would have been avoided, the investor bought back into the stock in time to benefit from the strong rally in the subsequent 12 to 18 months. In effect, the stop-loss signal in our example was triggered when Nestlé shares dropped below 76.90 francs and the re-entry signal was given at a share price of 76.98 francs. At the end of July 2019, the share price of Nestlé was 105.70 francs – a gain of 37.3% since re-entering the position.
Figure 3.11: Re-entry signal for Nestlé in 2018
Source: Bloomberg, Author.
Table 3.1 provides an overview of typical stop-loss and re-entry levels that I use for my investments.
The combined effect of the stop-loss and re-entry rules is exactly what a long-term investor needs in terms of risk management. The stop-loss signal is a slow signal so the investment will not be sold based on some short-term setbacks, but only in the case of a severe price decline over a sustained period of time. But the re-entry signal is a fast signal, forcing the investor to buy the long-term investment pretty quickly after a recovery has been established.
Overall, the time in the market is maximised while the risks of large losses that cannot be recovered in the next couple of years is reduced. If I – sorry – my friend, had used this stop-loss and re-entry rule for the investment mentioned at the beginning of this chapter, he would not have held on to the investment until the price declined by 80%, but instead sold earlier and had an easier time to recover the incurred losses.
Table 3.1: Recommended stop-loss and re-entry levels
|
|
Stop-loss below most recent 12-month high |
Re-entry above most recent 3-month low |
|
Investment grade bonds |
2.50% |
1.50% |
|
High yield bonds |
4.00% |
2.00% |
|
Emerging market bonds |
5.00% |
2.50% |
|
REITs |
8.00% |
4.00% |
|
Developed market bonds |
10.00% |
5.00% |
|
Emerging market equities |
12.50% |
6.00% |
|
Commodities |
12.50% |
6.00% |
|
Gold |
12.50% |
6.00% |
Source: Author.
- Long-term investing is the key to success for most investors. Hence, they should stick to a given investment strategy and philosophy over the long run and try to avoid reacting to short-term market swings.
- However, short-term losses can become so large that it is virtually impossible to recover from these losses within a few years or even a decade. Hanging on to investments with such steep losses is not a sign of a good long-term investor, but one of stubbornness.
- Investment styles like value investing and contrarian investing can be highly successful in the long run, but their returns come in lumps, and periods of underperformance can last for many years.
- In order to prevent excessive losses that are hard, if not impossible to recover, long-term investors should learn some techniques from short-term investors.
- These techniques should focus on emotionally detaching long-term investors from their investments. Emotional attachment to an investment can lead to an irrational stubbornness in the face of evidence contradictory to one’s view.
- One such technique is to think about all the drivers of the price of an investment. While there are many drivers that can point in different directions, there is typically just one driver that is so extremely stretched that it will dominate the price action. Following how stretched the signals from different drivers are will help investors identify the direction of price movements in the near future.
- Stop-losses, combined with suitable re-entry rules, can take the emotion out of investment altogether, and are a helpful tool to prevent excessive losses while maximising the investor’s time in the market.
A. Dasgupta, A. Prat and M. Verardo, “Institutional trade persistence and long-term equity returns”, The Journal of Finance, v.66 (2), p.635–653 (2011).
M. Grinblatt, G. Jostova, L. Petrasek and A. Philipov, “Style and skill: Hedge funds, mutual funds, and momentum”, ssrn.com/abstract=2712050 (SSRN, 2016).
C. R. Harvey, Y. Liu and H. Zhu, “… and the cross-section of expected returns”, The Review of Financial Studies, v.29 (1), p.5–68 (2016).
J. Klement, “Assessing Stop-Loss and Re-Entry Strategies”, The Journal of Trading, v.8 (4), p.44–53 (2013).
J. Klement, “Dumb alpha”, CFA Institute Enterprising Investor Blog, blogs.cfainstitute.org/investor/author/joachimklement (2015).
A. W. Lo and D. V. Repin, “The Psychophysiology of Real-Time Financial Risk Processing”, Journal of Cognitive Neuroscience, v.14 (3), p.323–339 (2002).
H. Marks, The Most Important Thing: Uncommon Sense for the Thoughtful Investor, p.5 (Columbia University Press, 2011).