Installing the Analysis ToolPak
The Excel Analysis ToolPak is an add-on that you can install that enables you to carry out complex statistical or engineering analyses. You can save a lot of time as you simply provide the data and parameters, and the tool uses the appropriate engineering or statistical functions to calculate and display the results in output tables. Some of the tools even generate charts in addition to output tables.
You can only use the data analysis functions on one worksheet at a time. When you carry out data analysis on a group of worksheets at the same time, results will appear on the first worksheet and empty tables will appear on the remaining worksheets. To carry out the data analysis on the rest of the worksheets, you’ll need to recalculate the analysis tool for each worksheet.
Follow these steps to install the Analysis ToolPak:
- Click on File
> Excel Options
(or press Alt+FT to directly open the Excel Options dialog box), and then click on Add-Ins
.
The Add-Ins tab lists all the names, locations, and types of the add-ins currently available to you in Excel.
- In the Manage box
(at the bottom of the Add-ins tab), select Excel Add-ins
and then click Go
.
If you're on a Mac, in the file menu go to Tools
> Excel Add-ins
.
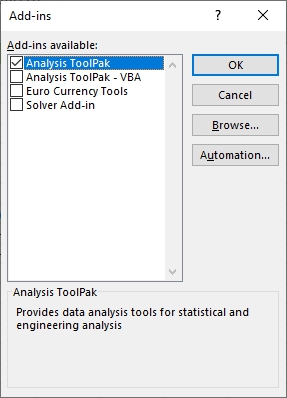
- In the Add-Ins
dialog box, select the Analysis ToolPak
check box, and then click on OK
.
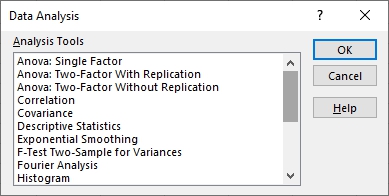
- To access the Analysis ToolPak tools on the Excel Ribbon, click on the Data
tab, then in the Analysis
group, click on the Data Analysis
button.
Notes
:
- If Analysis ToolPak is not listed in the Add-Ins box, click Browse to find it on your computer. You may get a prompt saying that the Analysis ToolPak is not currently installed on your computer, click Yes
to install it.
- (Optional) To include the Visual Basic for Application (VBA) functions for the Analysis ToolPak, you can also select the Analysis ToolPak - VBA
check box. This is only required if you intend to use VBA code in your data analysis.


