Creating a Two-Variable Data Table
A two-variable data table enables you to create projections based on the changing values of two variables.
The method of creating a two-variable table is similar to the one-variable data table described above but, in this case, we have two variables that can change instead of one.
A two-variable data table requires input for the column and row fields, so we need a series of values for the first column and first row of the table. At the intersection of the row and column, we enter the master formula which would have the figure that we want to use as the bases of our projection.
To demonstrate this type of data table, we will use an example where we create a series of projected sales for the next quarter based on two variables.
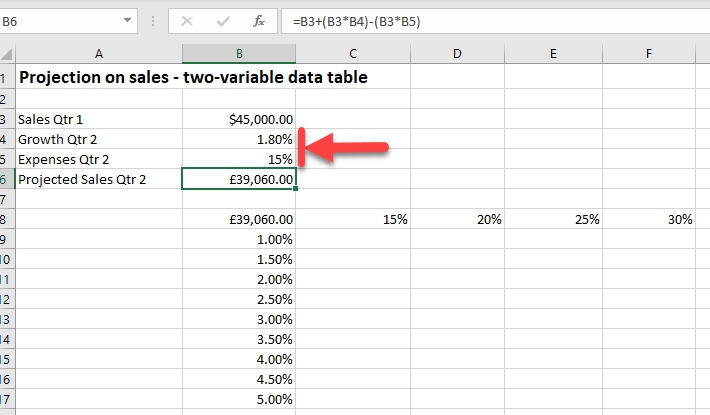
In this example, we have the following figures:
- Sales for quarter one: $45,000.
- Projected growth in sales for quarter two: 2.0%.
- Expenses for quarter two: 15%.
- Projected sales for quarter two: 45,000 + (45,000*0.02).
We want to see a projection for how our sales would look with different growth rates (between 1% and 5%) and different expense rates (between 15% and 30%).
For the row entries, to be substituted with Expenses Qtr 2
, we enter a series of values ranging from 15% to 30% in cells C8:F8.
For the column entries, to be substituted with Growth Qtr 2
, we enter a series of values ranging from 1% to 5% (increasing by 0.5%) in cells B9:B17.
In cell B8 we enter =B6
which is a reference to the master formula that calculates Projected Sales Qtr 2
.
Once your worksheet model has been prepared as shown in the image above, follow the steps below to generate the data table:
- Select the table. For this example, it’ll be B8:F17.
- On the Excel Ribbon, click on the Data
tab, in the Forecast
group, click on the What-If Analysis
command button and select Data Table
from the drop-down menu.
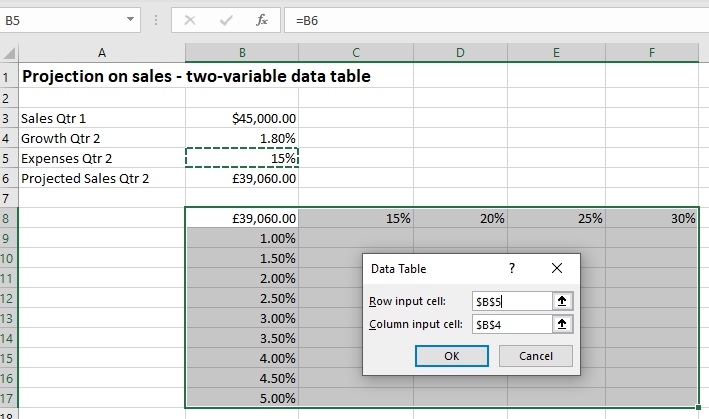
This will display the Data Table
dialog box. As this is a two-variable data table, we need to enter both fields in the Data Table dialog box.
- Click inside the Row input cell
field and then on the worksheet, select the expenses for quarter two, which is cell B5
.
- Next, click in the Column input cell
field and then on the worksheet, select the growth percentage, which is cell B4
.
- Click OK
to generate the projected values in the data table.
The two-variable data table uses the TABLE function to create an array formula in the output range of C9:F17. The TABLE function takes two arguments row_ref
and/or column_ref
.
{=TABLE(B5,B4)}
The formula shows that cell B5 is the row_ref
argument for which alternate values have been provided in cells B9:B17. The column_ref
argument has cell B4 for which we have alternate values in cells C8:F8.
The process simply substitutes the original values with the series of values created in B9:B17 and C8:F8 to generate the projection.
As the data table uses an array formula, you can’t delete only some of the values in the array. To delete the generated data in the table, you must select all values in cells C9:F17 and hit the Delete
key.