The Solver Add-in
The Data Table and Goal Seek commands are great for creating What-If Analysis solutions for simpler problems that require a direct relationship between the inputs and the outputs. However, for more complex problems, Excel provides another tool, which is the Solver
add-in utility.
The Solver can be used when you need to create a solution that requires changing multiple input values in your model. The Solver also enables you to impose constraints on the input and output values.
The Solver uses an iterative method to find the optimum solution based on the inputs, the desired result, and the constraints you have set.
Complex problems can have different ways that they’re solved and what the Solver does is try to present the best solution for you. However, this may not necessarily be the best one for your particular case. For example, if there are several variables that need to be changed, the Solver may produce a combination of figures that may not suit your specific needs (even if the result meets the objective). This is why you may want to run the Solver multiple times to get the best solution for you.
To set up the problem in the Solver, you will need to define the following items:
-
Objective cell
: This is the target cell that is set to maximum, minimum, or to a specific value. The objective cell needs to be a formula.
-
Variable cells
: These are the changing cells in your worksheet. The Goal Seek method, for example, enables you to only specify one cell that can be changed. The difference with the Solver is that you can have multiple cells that can be changed to achieve the objective.
-
Constraints
: These are the cells that contain the values you want to use to set a limit or restriction to the range of changes that can be made. For example, you could set a constraint that says the Sales
figure cannot be increased by more than 10% to achieve the solution (perhaps because a sales figure of more than 10% would be unrealistic for this particular problem).
After setting the parameters in the Solver, Excel returns the optimum solution by changing the values in your worksheet. At this point, you have the option of retaining the changes in your worksheet or restoring your original values. The Solver also enables you to save the solution as a scenario which you can view at a later time.
The Solver can be used with the Scenario Manager to set up a problem to solve. The variable cells that you define when you use the Scenario Manager to set up a scenario are available and picked up by the Solver. The Solver also allows you to save solutions as scenarios which will then be available to the Scenario Manager.
Adding the Solver Add-in utility to the Excel Ribbon
The Solver is an add-in and may not be available on your Ribbon if it hasn’t been manually added as it is not added by default when you install Excel 2019.
Follow the steps below to add the Solver command button to your Excel Ribbon:
- Click on File
> Options
> Add-ins
.
- At the bottom of the Add-ins tab, ensure that the Manage
drop-down list has Excel Add-ins
selected.
- Click on Go
to show the Add-ins
dialog box. In the Add-ins dialog box, check the Solver Add-in
check box and click on the OK
button.
The Solver
command button can be found on the Data
tab, in the Analyze
group.
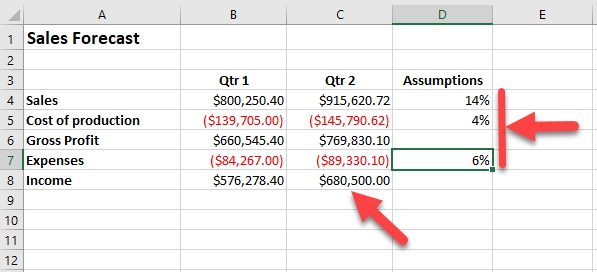
In the following example, we will be using the Solver to find a solution to what combination of figures can generate an income of $680,500.00. The worksheet model created for the problem is shown below.
The value in C4 is calculated with the following formula:
=$B$4+($B$4*SalesGrowth)
SalesGrowth
is the name given to cell D4
which is currently 5%. The formulas in the Qtr 2
column simply increments the Qtr 1
values by the growth rates under Assumptions
.
For this example, the changing/variable cells will be those in the Assumptions column while the result/objective cell will be C8
(which is named Income_Qtr2
).
Once you have loaded the Solver add-in and created your worksheet model, follow the steps below to define a problem with the Solver:
- On the Data
tab, in the Analyze
group, click the Solver
command button. Excel opens the Solver Parameters
dialog box.
- In the Solver Parameters
dialog box, the Set Objective
textbox is the result you want to achieve. This needs to be a cell in the worksheet with a formula. Click the text box and then select the cell on your worksheet. For our example, this is cell C8
on the worksheet. The name of the cell is Income_Qtr2
so the name is inserted in the text box.
- You have the option of setting the objective to a maximum (as large as possible based on the input values available), a minimum (as small as possible), or to a specific value. For this example, we are using a specific value for our objective, so, click Value Of
and enter 680500.
- Click the By Changing Variable Cells
text box and select the cells you want to change in the worksheet. To select non-adjacent cells, simply hold down the Ctrl
key while clicking on the cells. If you have given the variable cells names, the names will be entered in place of the cell references.
- In the Subject to the Constraints
list box, you can add constraints to place restrictions on the extent of changes the Solver can make. To add a constraint, click the Add
button. This will display the Add Constraint
dialog box.
- Click the Cell Reference
text box, then select the cell in the worksheet for which you want to create a constraint.
Select the relationship from the drop-down list box in the middle. The options are: =, <=, >=, int (for integer), and bin (for binary). For our example, we select <= from the drop-down list.
In the Constraint
text box, enter the constraint. For our example, we don’t want the SalesGrowth
to be more than 15% so we enter 15%.
Click Add
to insert the constraint and continue adding more constraints (or click OK
to return to the Solver Parameters dialog box if you’re done).
The constraint you added will now be listed in the Subject to the Constraints
list box.
- For our example, we’ll leave the Make Unconstrained Variables Non-Negative
checkbox selected, which is the default. Deselect this checkbox if you want to allow negative values in variable cells for which you’ve set no constraints.
- The default value for the Select a Solving Method
drop-down list will have the default value is GRG Nonlinear
.
There are three solving methods:
- GRG Nonlinear is for solving smooth nonlinear problems.
- Simplex LP method is for linear problems.
- Evolutionary method is for problems that are non-smooth.
Leave this selection as the default - GRG Nonlinear, unless you’re sure one of the other methods is more optimal for your problem. There is a brief description of the solving methods in the label below the drop-down list box.
- Once you’ve entered all the parameters in the Solver Parameters dialog box, click Solve
button.

Solver Results
When you click Solve on the Solver Parameters dialog box, the box will disappear and depending on how complex your problem is, you may see an indicator on Excel’s status bar informing you of the progress of the Solver. On most occasions, however, the solution would be generated quickly, and the Solver Results
dialog box will be displayed.
The Solver Results
dialog box informs you whether a solution was found for your problem or not. If a solution was not found, the dialog box will inform you that a solution could not be found, and you will have the opportunity to go back and adjust the parameters.
If a solution was found, the Solver will display the new values in your worksheet, but the Solver Results dialog box will give you the option to keep the values provided by the solution or restore your original values.
To keep the solution found by the Solver, select Keep Solver Solution
(if it is not already selected), then click OK
.
From the worksheet model in the image above, you can see that the Solver changed the growth percentages for Sales
(14%), Cost of Production
(4%), and Expenses
(6%), in order to achieve the target Income
for Qtr 2
of £680,500.00. You may also notice that the Solver stayed within the 15% constraint set for the SalesGrowth
cell.
If you do not want to keep the solution and instead return to the original values in your worksheet, select the Restore Original Values
option.
To save the solution as a scenario before restoring your original values, click the Save Scenario
button and assign a name to it. Once you have saved it, you can then select the Restore Original Values option and click OK
to close the Solver Results dialog box.
You can also click the Cancel
button on the Solver Results dialog box to dismiss the Solver and return your original values.
Note
: If you choose to keep the solution provided by the Solver, unlike the Goal Seek command, you can't undo the changes by clicking the Undo command on the Quick Access Toolbar. If you want to retain your original values, select Restore Original Values,
and then click on Save Scenario
to save the scenario for later viewing. That way, you can keep your original values in the worksheet and use the Scenario Manager (covered previously in this chapter) to display the solution generated by the Solver.
Solver Options
The default options used by the Solver is adequate for most problems, however, in some situations, you may want to change the options before generating a solution with the Solver.
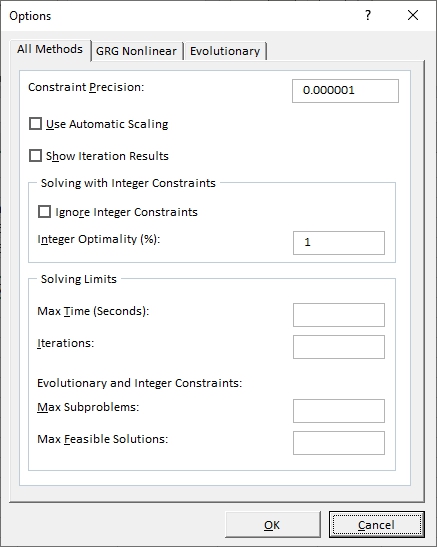
To change the Solver options, click the Options
button in the Solver Parameters dialog box. Excel opens the Options
dialog box which has three tabs: All Methods, GRG Nonlinear, and Evolutionary.
The following settings apply to the Solver options.
- Constraint precision: This specifies the precision of the constraints added. To satisfy a constraint, the relationship between the cell reference and the value of the constraint cannot be more than this amount. The smaller this number is, the higher the precision.
- Use automatic scaling: Select this option if you want the Solver to automatically scale the results.
- Show iteration results: Select this option if you want the Solver to show the results for the iterations it followed in solving the problem.
- Ignore integer constraints: Select this checkbox if you want the Solver to ignore any constraints that you specified that use integers.
- Integer optimality (%): This option specifies the percentage of integer optimality that the Solver applies when solving the problem.
- Max time (Seconds): This value specifies the maximum number of seconds that you want the Solver to spend in finding a solution before it times out.
- Iterations: This value specifies the maximum number of iterations you want the Solver to make in recalculating the worksheet when finding the solution.
- Max Subproblems: This value specifies the maximum number of subproblems that you want the Solver to take when using the Evolutionary method in solving the problem.
- Max feasible solutions: This value specifies the maximum number of feasible solutions that you want the Solver to pursue when using the Evolutionary method in solving the problem.
Note that the Options dialog box also has the GRG Nonlinear
and Evolutionary
tabs where you can make additional changes to the settings.
After making changes to the Solver options, click OK
to return to the Solver Parameters dialog box.
Tip
: Only make a change to an option in the Solver if you understand what that setting represents and how the change will affect your worksheet model, otherwise the default values will suffice for most Solver problems.
Saving and Loading Solver Problem Models
When you save your workbook, the objective cell, variable cells, constraint, and Solver options that were last entered in the Solver Parameters dialog box are saved as part of the worksheet. These parameters will be loaded in the Solver Parameters dialog box the next time it is opened.
When you create other problem models for the worksheet that you want to also save, you must use the Load/Save
button in the Solver Parameters dialog box to save them.
When you click the Load/Save
button, Excel displays the Load/Save Model
dialog box.
To Save
, click the text box in the Load/Save Model dialog box and select an empty vertical range in your worksheet with enough cells to hold all the parameters you entered for the problem model. To help, the message in the Load/Save Model dialog box will tell you how many cells you need to select.
Once you have entered the range in the text box, click the Save
button and the values will be saved to that range in your worksheet.
To Load
a saved model, click the text box, and then select the range in your worksheet with the saved model, then click the Load
button. The parameters saved in the range will then be loaded in the Solver Parameters dialog box.
Solver Reports
There are three types of reports you can create from the Solver Results dialog box:
-
Answer
: This report lists the result cell and the variable cells with their original values, final values, and any constraints used as parameters.
-
Sensitivity
: This report shows you how sensitive an optimal solution is to changes in the formulas behind the objective cell and constraints.
-
Limits
: This report displays the objective cell and the variable cells with their values, lower and upper limits, and results. The lower limit is the lowest value that the variable cells can have while still meeting the constraints. The upper limit represents the highest value that will do this.
To generate a report, in the Solver Results dialog box, select one or more of the reports in the Reports
list box before clicking OK
.
You can generate one or all of the reports as the Reports list box allows you to select more than one item on the list. When you click OK
, Excel will generate the selected reports in separate worksheets, adding them to the beginning of the workbook.