Chapter 8
Evolving Depocentre and Slope: The Gull Island Formation
LORNA J. STRACHAN & DAVID R. PYLES
8.1 Introduction
The Gull Island Formation is the uppermost lithostratigraphic unit of the Namurian Shannon Group (Rider, 1974; Heckel & Clayton, 2006) and is best exposed on the Atlantic coast of southern and northern County Clare (Fig. 8.1.1). This chapter and excursion summarises and builds upon published observations and interpretations of the Gull Island Formation, with an emphasis on the stratigraphic architecture at several key outcrops, including those at Gull Island, Fisherstreet Bay and the Cliffs of Moher (Fig. 8.1.1). The chapter describes outcrops in the south (Stop 1) and north (Stops 2 and 3) of County Clare, where the varied nature of the Gull Island Formation can be viewed in a series of spectacular cliff sections. The transit time between these two areas is approximately 1 hour.
Fig. 8.1.1. Geological map of western Ireland. The Gull Island Formation and equivalent strata are shown in green, together with several key outcrop locations.
Map is modified from Pyles (AAPG © 2008, used by permission of the AAPG whose permission is required for further use).
Strata of the Gull Island Formation are generally finer grained than the underlying Ross Sandstone Formation and consist of interbedded sandstone and mudstone (< 30% sandstone) (Hodson, 1954a,b; Gill & Kuenen, 1958; Hodson & Lewarne, 1961; Rider, 1974; Gill, 1979; Martinsen, 1989; Collinson et al., 1991; Martinsen et al., 2000; Wignall & Best, 2000; Martinsen & Collinson, 2002; Martinsen et al., 2003; Pyles, 2008; Strachan & Alsop, 2006). Soft-sediment deformation is abundant and locally comprises up to 75% of the Formation (Hodson, 1954a; Hodson & Lewarne, 1961; Rider, 1974; Gill, 1979; Martinsen, 1989; Collinson et al., 1991). Several workers have used soft-sediment deformation features, including slumps, to reconstruct the geometry and orientation of the palaeoslope and to infer an unstable slope environment (Rider, 1974; Gill, 1979; Martinsen, 1989; Collinson et al., 1991; Martinsen et al., 2000; Strachan & Alsop, 2006).
The Gull Island Formation defined
The Gull Island Formation was formally defined by Rider (1974), who documented its lower bounding surface to record: 1) an abrupt lithofacies change from shale to slumped sandstones in northern Co. Clare, and 2) a gradational grain-size contact with the underlying Ross Sandstone Formation in southern Co. Clare (Fig. 8.1.2). The observations of Rider (1974) are in accord with those of Hodson (1954a) and Hodson & Lewarne (1961, Fig. 8.1.3), who documented an abrupt upward change to deformed, sandstone-rich, slumped intervals in north and south Co. Clare. Hodson (1954b) named the southern Co. Clare units ‘Lower Sandy Shales and Sandstones’, whereas Hodson & Lewarne (1961) termed the northern Co. Clare succession the Fisherstreet Slumped Beds, Cronagort Sandstone Group and Doonagore Shales (Fig. 8.1.3). Rider (1974) replaced local names with the regionally-inclusive Gull Island Formation (Fig. 8.1.3).

Fig. 8.1.2. Regional stratigraphy of the Shannon Basin, adapted from Rider (1974), Heckel & Clayton (2006) and Pyles (2008).
Figure from Pyles (AAPG © 2008) used by permission of the AAPG whose permission is required for further use.
Fig. 8.1.3. Cross-sections documenting regional variations in the Clare Shale and Gull Island Formation. The logs have been redrawn from descriptions or modified from original figures. Cross-section A-B demonstrates the N-SSE development of Gull Island Formation strata from Hodson & Lewarne (1961) and Hodson (1954a) and thus uses the old nomenclature for stratigraphic units. Cross-section A-C is oriented N-SW with logs from Rider (1974) and Gill (1979; copyright Geological Society of Ireland) and show the regionally inclusive nomenclature now used widely.
Rider (1974) reports the Gull Island Formation contains “no fossils, falling between Reticuloceras paucicrenulatum fossil band” (R1a3-5) “and the Reticuloceras aff. stubblefieldi” (R1b3) fossil band (Fig. 8.1.3), and thus defining an exact biozone for the upper and lower boundaries of the formation is not possible. Furthermore, Rider (1974) placed the R. stubblefieldi (R1b3) marine band at the top of the overlying Tullig Cyclothem (Fig. 8.1.3), effectively grouping the Gull Island Formation and Tullig Cyclothem between R. paucicrenulatum (R1a3-5) and R. stubblefieldi (R1b3).
Although Rider (1974) and subsequent studies agreed with the interpretation that the Gull Island Formation is devoid of marine bands, his goniatite descriptions omitted the earlier pioneering work of Hodson (1954a, b) and Hodson & Lewarne (1961), who documented two significantly younger Clare Shale goniatites, R. ornatum (R1b2) and R. nodosum (R1b2), from northern and southern Co. Clare (Figs 8.1.3 & 8.1.4). Hodson & Lewarne (1961) placed R. ornatum (R1b2) in the upper part of the Clare Shale, several metres below the Gull Island Formation (Rider, 1974; Figs 8.1.3 and 8.1.5). Therefore, the Gull Island Formation and overlying Tullig Cyclothem strata fall within two successive marine bands that record a mere c. 65 to 109 kyr, according to most estimates of zonal durations (e.g. Riley et al., 1993; Menning et al., 2000) (Fig. 8.1.5). Recent studies have also omitted R. ornatum (R1b2) in biostratigraphic models, although Brennand (1965) documents a marine band that contains both R1b1 and R1b2 goniatite zones in Castleisland, Co. Kerry (Fig. 8.1.5).
Fig. 8.1.4. Stratigraphic cross-section of the Gull Island Formation in eastern County Clare and County Limerick. Data from Hodson & Lewarne (1961), except for the ammonite in the Fisherstreet log adjacent to the star that comes from Hodson (1954a). The datum for the cross-section is the H2a1 marine band (Hudsonoceras proteum). The location of the cross-section is shown in the inset map. The horizontal spacing of logs is to scale.
Fig. 8.1.5. Summary diagram showing biostratigraphic position only of the Gull Island Formation over time. Marine bands are indicated as reported from each case study. Note the consistency of the upper marine band R. stubblefieldi (R1b3), which is a good biostratigraphic marker for the top of the Tullig Cyclothem and the range of ammonoid zones that R. paucicrenulatum (R1a3 to 5) spans. The blue diamond goniatite in Hodson (1954a) was recognised but not put into stratigraphic context.
Rider’s (1974) designation of the lithostratigraphy of Namurian strata in western Ireland was embraced by subsequent studies, although many have modified the position of boundaries, both subtly and substantially (for example, Gill, 1979; Martinsen, 1989; Collinson et al., 1991; Martinsen et al., 2000; Wignall & Best, 2000; Pyles, 2008). Below, we document the utility of using the biostratigraphic information described above in an analysis of the Gull Island Formation.
While presenting a comprehensive description of soft-sediment deformation structures from the Shannon Basin, Gill (1979) provided a definitive lithostratigraphic upper Gull Island Formation boundary at the base of the Tullig Sandstone Member, where a coarsening-upward trend into delta-front sediments was documented (Fig. 8.1.3). This contact was well illustrated in a series of sedimentary logs from north and south Co. Clare (his fig. 4) that were sourced from Rider (1969).
Building on Gill’s (1979) work, Martinsen (1989) described a range of mass transport deposits and water-escape structures in the Gull Island Formation. Whilst following the lithostratigraphic definition of Gill (1979), Martinsen (1989) reintroduced the R. subreticulatum (R1a3) marine band, described previously by Hodson (1954a), and positioned it at the base of the Gull Island Formation in the southern part of the basin (Fig. 8.1.5). Placement of marine band R1a3 was based on marine band observations of equivalent strata, known as the Cummer Formation, in north Co. Cork (Morton, 1965).
Martinsen (1989) divided the Gull Island Formation into lithostratigraphically distinct lower and upper units. The lower unit comprises mudstone slumps intercalated with sandstone and mudstone units, whereas the upper unit consists of undeformed mudstone and rare mudstone slumps and slides (Martinsen, 1989). Later work by Collinson et al. (1991) used detailed stratigraphic columns from Loop Head and Ballybunnion to present a sedimentological summary of the Shannon Group and Tullig Cyclothem. Collinson et al. (1991) document a previously unreported marine band, Reticuloceras dubium (R1a5, Fig. 8.1.5), which was placed at the boundary between the Ross Sandstone and Gull Island formations (Fig. 8.1.5). The top contact of the Gull Island Formation was placed above the uppermost slump horizon (Collinson et al., 1991).
Martinsen et al. (2000) expanded their earlier work, dividing the southern Co. Clare Gull Island Formation into a 420 m thick lower unit and a 200 m thick upper unit. The lower Gull Island Formation was interpreted as aggradational turbidites, whereas the upper Gull Island Formation was interpreted as a mudstone-dominated prograding slope succession (Martinsen et al., 2000). This boundary between the lower and upper Gull Island Formation was interpreted as a regional downlap surface (Fig. 8.1.5). In northern Co. Clare, the base of the Gull Island Formation was placed at R. paucicrenulatum (R1a3-5) and is overlain by ~ 50 m of lower Gull Island Formation strata and 220 m of Upper Gull Island Formation strata, that included the lowest part of the Tullig Cyclothem (Martinsen et al., 2000). The biozone imprecision of R. paucicrenulatum (R1a3-5) may allude to diachroneity of the base of the Formation, with Gull Island deposition being initiated first in northern Co. Clare and later in southern Co. Clare (Martinsen et al., 2000).
In a reassessment of the basin, Wignall & Best (2000) adhered to the Gull Island stratigraphy of Collinson et al. (1991) in southern Co. Clare, but in northern Co. Clare placed a thin (~ 30 m) intervening Ross Sandstone Formation interval between the Clare Shale and Gull Island Formations (Fig. 8.1.5). Thus, the base of the Gull Island Formation was positioned in the shales overlying a thin interval of slumped and channelised sandstones (Fig. 8.1.5). In a more recent paper, Wignall & Best (2004) updated their northern Co. Clare model and reassigned the Ross Sandstone Formation interval to the Gull Island Formation (their fig. 2).
In summary, there is a lack of consensus with regard to lithostratigraphic definition and Gull Island Formation bounding marine bands (Fig. 8.1.5), largely due to the fact that submarine slumping, diagnostic of the base of the Formation (Rider, 1974), initiated and ended at different times across the basin, thus rendering lithostratigraphic and biostratigraphic approaches incompatible. Figure 8.1.6 contains a regional stratigraphic cross-section of the Gull Island Formation and documents that slumping initiated at H2c2 times in the south, at R1a2 times in the centre and at R1b2 times in the north. Cessation of soft-sediment deformation varies, probably due to the limited aerial extent of slumps and slides, limited transport distances and the different number of events preserved at each outcrop (Fig. 8.1.6). These difficulties, combined with the lack of inclusion of the biostratigraphic work of Hodson & Lewarne (1961; Fig. 8.1.4), has made regional correlations difficult. As a result, attempts to correlate stratigraphic subdivisions of the formation are at best speculative.
Fig. 8.1.6. Stratigraphic cross-section of sedimentary logs, which are flattened on the R1a2 marine band. Slumping initiated in the southern part of the basin study area after marine band H2c2 and moved northward through time. Slumping in the northern part of the study area initiated after marine band R1b2.
The vast majority of published work in the Gull Island Formation describes the lower contact to underlie slumps and slides. As such, herein we define the base of the Gull Island Formation as a diachronous boundary between undeformed turbidite and hemipelagic strata of the coeval Ross Sandstone and Clare Shale formations and the deformed slump, slide, debrite and turbidite strata of the overlying Gull Island Formation (Fig. 8.1.7). The diachronous nature of the base of the Gull Island Formation means that its biostratigraphic position varies spatially and the onset of slumping is therefore time transgressive. For example, the base of the Gull Island Formation is positioned above marine band H2c2 close to Killarney, Co. Kerry, above R1a2 at Castleisland, Co. Kerry and above R1b2 at Lisdoonvarna, Co. Clare (Fig. 8.1.7). Previous authors position the boundary between the Ross Sandstone and Gull Island Formation at the R1a5 marine band at Loop Head Peninsula, Co. Clare. We follow this convention herein for this region, although recognise that slumping initiated before this time in several parts of the basin (Fig. 8.1.7). In this chapter, we place the top of the Gull Island Formation where strata begin to coarsen upward to the Tullig Cyclothem (Gill, 1979; Figs 8.1.3 and 8.1.7).
Fig. 8.1.7. North-south (D to E) stratigraphic cross-section through the Gull Island Formation in the Shannon Basin. Logs have been aligned on the R1a2 marine band where present. Gull Island Formation sediments as defined herein are highlighted, together with the onset of slumping.
Sedimentology of the Gull Island Formation
The comprehensive documentation of the sedimentology of the Gull Island Formation provided below is based on data from numerous field studies from counties Clare, Kerry and Cork (Fig. 8.1.8). Using lithofacies and biostratigraphic descriptions, we identified strata that resemble Gull Island Formation sediments from neighbouring counties and refer to these strata as Gull Island Formation equivalents rather than their local names. Local names are provided in Fig. 8.1.8.
Fig. 8.1.8. West-east (F to G) stratigraphic cross-section through the Gull Island Formation in the Shannon Basin, showing a compilation of redrawn Gull Island Formation equivalent sedimentary logs from counties Kerry and Cork. The logs are aligned on marine bands R1a2 and R1a3/R1a4 marine bands where present. Local formation names are indicated in bold italics. Note the diachronous base of the Gull Island Formation, which is defined by a change to a slump-dominated succession.
The thickness of the Gull Island Formation varies spatially, with a maximum thickness of 550 m on the west coast of the Loop Head Peninsula, Co. Clare (Rider, 1974; Martinsen, 1989) and a minimum of 12 m in north Co. Cork close to Buttevant (Hudson & Philcox, 1966, Philcox, 1961; Figs 8.1.8 and 8.1.9). A north-south transect documents a gradual thickening of strata from north to central Co. Clare, which thins slightly through northern and central Co. Kerry, finally thinning abruptly in south Co. Kerry (Fig. 8.1.7). Fig. 8.1.9 includes an isopach map of the Gull Island Formation and reveals thinning towards the east and extreme thinning towards the south-east, showing that the distribution of the Gull Island Formation is more extensive than previously described.

Fig. 8.1.9. Isopach map of the Gull Island Formation (contour interval is 100 m). Circles represent outcrop locations and are given together with citations for the source of data. Sedimentation rates are calculated by dividing the local thickness (in bold) by the duration of deposition using the time scale published by Riley et al. (1993). The Gull Island Formation is thickest at Loop Head and thins radially away from this area. Inset contour map of inferred sedimentation rates shows two sites of enhanced deposition.
The onset of slumping is determined using marine bands. Fig. 8.1.10 documents a systematic north-eastward migration of slumping through time that initiated in the SW after H2c2 and R1b2 in northern and eastern Co. Clare. The temporal variation in slumping is interpreted to reflect a systematic evolution of (slope) instability that migrated from the south-west to the north and north-east through time (Figs 8.1.10 and 8.1.11).

Fig. 8.1.10. Map showing the age of the onset of slumping in the Gull Island Formation with transport directions. The size of the arrows is proportional to the number of documented slumps. Contours are isochrons showing the onset of slumping as constrained by marine band biostratigraphy. Original authors of slump data are shown.

Fig. 8.1.11. Schematic maps showing the distribution of slumps, turbidites and mud deposition during H2c2 to post R1b2 (T1 to T4) times. Pentagons are locations of published sedimentary data that are sourced from Hodson (1954a,b), Hodson & Lewarne (1961), Morton (1965), Brennand (1965), Walsh (1967), Rider (1974), Gill (1979; copyright Geological Society of Ireland), Collinson et al. (1991), Martinsen et al. (2000), Wignall & Best (2000), Strachan (2002), Strachan & Alsop (2006) and Pyles (2008). Indicative transport directions are from published data. The distribution of slumps and slides appears to have gradually migrated north-eastward from H2c2-R1b1 (T1 to T3) times and then dramatically jumped northwards post R1b2 (T4).
Gull Island Formation sedimentation rates are calculated using published sediment thickness and biostratigraphic data, adopting a marine band interval of 65 kyr (Riley et al., 1993). The lack of Gull Island Formation marine bands, partial exposure of measured sections and the lithostratigraphic nature of the upper boundary, mean that some of these values probably have significant errors associated with them (Table 8.1.1). To overcome this difficulty, the calculated average sedimentation rates use marine bands that bound both the Gull Island Formation and Tullig Cyclothem (Table 8.1.1). In outcrops with complete Gull Island Formation successions and hence smaller errors, sedimentation rates range from 1.8 m kyr−1 at Newmarket, to 4.48 m kyr−1 at Fisherstreet (Fig. 8.1.9). These high rates confirm the calculations of Martinsen (1989) and Pyles (2008), who revealed that sedimentation rates were significantly higher in the Gull Island Formation than in the preceding Ross Sandstone and Clare Shale formations. Our calculations also document spatial variations in sedimentation rates over the basin, with significantly lower values in the south-east (Figs 8.1.9 and 8.1.11).
Table 8.1.1. Summary table showing calculated sedimentation rates for Gull Island Formation and Tullig Cyclothem sediments. Shaded rows represent incomplete sections. Authors and approximate locations of data are given. Authors are arranged in alphabetical order.
| Author | Location | Thickness (m) | Basal marine band | Upper marine band | Formations included | Duration - kyrs (Riley et al., 1993) | Av sed. rate (m kyr−1) |
| Brennand (1966) | Castle Island, Co. Kerry | 365 | R1a2 | R1b4 | Gull Island & Tullig | 260 | 2.77 |
| Collinson et al. (1991) | N. Co. Clare | 260 | R1a5 | R1b3 | Gull Island & Tullig | 195 | 1.33 |
| Collinson et al. (1991) | S. Co. Clare | 850 | R1a5 | R1b3 | Gull Island & Tullig | 195 | 4.36 |
| Gill (1979) | S. Co. Clare | 400 | R1a3 to 5 | R1b3 | Gull Island & Tullig | 195 to 325 | 1.14 to 2.05 |
| Hodson (1954b) | Foynes Island, Co. Clare | 259 | R1b2 | R1b3 (inferred) | Gull Island & Tullig | 65 | 3.98 |
| Hodson & Lewarne (1961) | N. Co. Clare | 291 | R1b2 | R1b3 | Gull Island & Tullig | 65 | 4.47 |
| Martinsen (1989) | S. Co. Clare | 850 | R1a3 to 5 | R1b3 | Gull Island & Tullig | 195 to 325 | 2.41 to 4.36 |
| Morton (1965) | Newmarket, Co. Cork | 470 | R1a3 | R1b3 | Gull Island & Tullig | 260 | 1.8 |
| Philcox (1961) | Buttevant, Co. Cork | 12 | R1a4 | R1a5 (inferred) | Gull Island | 65 | > 0.18 |
| Rider (1974) | S. Co. Clare | 701 | R1a3 to 5 | R1b3 | Gull Island & Tullig | 195 to 325 | 2.16 to 3.6 |
| Rider (1974) | N. Co. Clare | 134 | R1a3 to 5 | R1b3 | Gull Island | 195 to 325 | > 0.41 to 0.69 |
| Tanner et al. (2011) | Co. Clare | 550 | R1a5 | R1b3 | Gull Island & Tullig | 195–325 | 2 |
| Walsh (1967) | Killarney, Co. Kerry | 110 | H2c2 | R1a2 | Gull Island | 130 | 0.85 |
| Wignall & Best (2000) | S. Co. Clare | 610 | R1a5 | R1b3 | Gull Island & Tullig | 195 | 3.12 |
| Wignall & Best (2004) | N. Co. Clare | 145 | R1a5 | R1b3 | Gull Island | 195 | > 0.74 |
Figure 8.1.11 shows facies distributions and the location of depocentres at four distinct time periods (T1 to T4). The location of the depocentre and the distribution of slumped facies migrates to the north-east and east through time (Fig. 8.1.11). Enhanced deposition in the south and south-west part of the basin occurred during T1 to T3 (Fig. 8.1.11). During T4, the locus of slumping migrated to the northern and eastern parts of the basin (Fig. 8.1.11) although deposition continued in southern Co. Clare.
Lithofacies in the Gull Island Formation are turbidite sandstones and siltstones, hemipelagic mudstones and slumps and slides (Rider, 1974; Martinsen, 1989; Collinson et al., 1991; Martinsen et al., 2000; Wignall & Best, 2000; Martinsen et al., 2003). Fine-grained to medium-grained sandstones and siltstones are thought to result from high and low concentration turbidity currents, generally deposited from waning flows within the deep marine Shannon Basin. A range of depositional elements are interpreted from Gull Island turbidites and include weakly and strongly confined channels, levees and lobes (Rider, 1974; Martinsen, 1989; Collinson et al., 1991; Martinsen et al., 2000; Wignall & Best, 2000; Martinsen et al., 2003).
In northern Co. Clare, lithofacies in the basal part of the formation are primarily heterolithic slumps and lenticular sandstones, with subordinate tabular beds (Fig. 8.1.7). The overlying interval contains tabular bedded, laminated mudstone, siltstones and black shale, with rare lenticular sandstones. Palaeocurrent data from sole structures reveal NE and E flow directions (Fig. 8.1.12). In contrast, transport directions collected from slumps have been measured and conflicting interpretations given with movement towards the SE and NE (Gill, 1979; Collinson et al., 1991; Wignall & Best, 2000; Strachan 2002a,b; Strachan & Alsop, 2006; Fig. 8.1.10). In southern Co. Clare, the most abundant lithofacies are slumps, laminated silty mudstones and graded, ripple-topped turbidite sandstones. Mudstones increase in abundance upward. Palaeocurrent data from sole structures are consistently to the NE, whereas palaeocurrents from ripple cross-laminae are more variable, to the NE, E and SW (Fig. 8.1.12). Slump transport directions, inferred from the orientations of fold axes and faults, were to the SE, NW and SW (Fig. 8.1.10). In counties Kerry and Cork, Gull Island Formation equivalent strata contain predominantly massive or graded turbidite sandstones and mudstones and a high proportion of slumps (Philcox, 1961; Hodson & Lewarne, 1961; Morton, 1965; Brennand, 1966; Hudson & Philcox, 1966; Walsh, 1967). Turbidite palaeocurrent directions collected from flutes, grooves and ripples record a mean transport to the NE, with a spread in directions (Fig. 8.1.12). Palaeocurrent directions collected from slumps record transport to the NE and ENE (Fig. 8.1.10). A single slump transport measurement of Morton (1965) was interpreted by Martinsen (1989) as a SE direction. However, because the movement direction was given using the “British right hand rule” convention, Morton’s (1965) measurement of “160° N” actually implies a ENE directed flow (Fig. 8.1.10).
Fig. 8.1.12. Map documenting the spatial distribution of palaeocurrents measured from sole structures (black) and ripples (grey). n = number of measurements.
A compilation of published grain-size measurements reveals that the Gull Island Formation is mudstone dominated, although with variations in grain-size (Fig. 8.1.13). Most outcrops contain a broad fining-upward trend from sandstone rich bases, regardless of total net-to-gross or completeness of the measured section. The relative proportion of slumped to non-slumped strata varies spatially: northern outcrops contain an upward decrease in the proportion of slumps, whereas southern outcrops contain an upward increase in the proportion of slumps (Fig. 8.1.13). Furthermore, at Ballybunnion, slumps increase in proportion upward as the Formation becomes finer grained; however, at Fisherstreet the proportion of slumps decreases upwards as the interval fines. We interpret the ubiquitous slumping of the Gull Island Formation to record instability associated with relatively high sedimentation rates (Table 8.1.1), which are two orders of magnitude higher than the underlying Ross Sandstone and Clare Shale Formations.
Fig. 8.1.13. Plots showing sandstone-to-mudstone ratios of Gull Island Formation sediments (left), upward patterns in sandstone-to-mudstone ratios (centre) and upward patterns in the proportion of slumping to in situ non-deformed units (right).
Data from Collinson et al. (1991), Wignall & Best (2000) and Martinsen et al. (2000, 2003).
The range of interpretations in slump transport directions has led to rigorous debate concerning the physiography of the basin (for example Martinsen & Collinson, 2002; Wignall & Best, 2002; Chapter 3). Deformational features in slumps can be used to reconstruct palaeo-slump and palaeoslope directions (Woodcock, 1979; Strachan & Alsop, 2006). However, a comprehensive analysis of slump data is required, together with an assessment of the significance of the slope; for example a local versus a regional palaeoslope (Woodcock, 1979; Strachan & Alsop, 2006; Debacker & De Meester, 2009). Deciphering the correct flow direction from slumps is difficult but like other palaeocurrent data, the greater the number of measurements the more robust the interpretation. Strachan & Alsop (2006) used 570 structural measurements (folds and faults) from a single slump sheet at Fisherstreet to determine palaeoflow direction. Using multiple transport determination techniques, they document that the Fisherstreet Slump moved ENE (Fig. 8.1.14). This direction is consistent with turbidite palaeocurrent directions collected from overlying units and therefore interpreted to represent the downslope orientation in northern Co. Clare. Other studies report slump transport directions using less rigorous analyses, either by using small numbers of measurements or by grouping measurements from multiple events onto single plots. Such approaches reduce the confidence level of the resulting interpretation. Additionally, slump folds and faults may form complex patterns, with dominant orientations anywhere between downslope to alongslope (Jones, 1939; Hansen, 1971; Lewis, 1971; Woodcock, 1979). As a result, multiple interpretations can result from the same data. For example, it is logically valid to interpret the raw slump-fold data of Strachan & Alsop (2006) to result from transport to the ENE, WSW, or SE direction (Fig. 8.1.14). However, their use of multiple techniques, in concert with data derived from fold vergence, allowed Strachan & Alsop (2006) to reject all other possible flow directions and robustly show an ENE flow direction. The raw structural data presented by Martinsen & Collinson (2002, their fig. 5), which group together measurements from several slumps, can similarly be interpreted in a number of different ways, with flows moving either towards the SE, NW and NE. For their data, Martinsen & Collinson (2002) opt for a SE flow interpretation.
Fig. 8.1.14. Summary of techniques used to determine transport directions from slumps at Fisherstreet. All plots show several possible slip directions together with the inferred direction. n = number of data. (A) Stereonet showing data for fold hinge orientation and sense of asymmetry. The Mean Axis Method (MAM) suggests a transport direction of 067°. The Separation Arc Method (SAM) and Downslope Average axis Method (DAM) are inconclusive. (B) Stereonet of axial plane data and sense of asymmetry. If the Axial planar Intersection Method (AIM) is applied to the data, the transport direction is inferred to be 079°. (C) Fold Hinge azimuth and Interlimb angle Method (HIM) shows a preferred slope direction of 060°.
In summary, a comprehensive analysis of the literature shows that the timing of slumping in the basin was diachronous, migrating north-eastward through time. Thus the base of the Gull Island Formation is time transgressive. A complex spatial distribution of sediment thicknesses is interpreted to record the geometry of the basin. Calculated sedimentation rates are high in some areas suggesting more than one depocentre was present at a time. The Gull Island Formation is dominated by mudstone and this, together with high sedimentation rates, is interpreted to have promoted slope instability. The absence of marine bands prevents an accurate characterisation of the time at which slumping ended. To date, no provenance data have been collected to determine if the Gull Island Formation is a finer-grained equivalent of the Ross Sandstone Formation, or if it was from a different source area altogether.
Depositional environment of the Gull Island Formation
Since Rider (1974) named the Gull Island Formation, a variety of interpretations of the depositional environment have been made, as summarised below.
Rider (1974) interprets the vertical succession of the Shannon Group to record a shallowing-upward succession with the Clare Shale and Ross Sandstone Formations recording deposition in the basin overlain by prograding slope strata of the Gull Island Formation. Rider (1974) applied Walther’s Law to the Shannon Group, interpreting the succession to be broadly progradational to the east. Gill (1979) broadly concurred with this model and highlighted a range of complex palaeogeographies, with slumps moving in multiple directions thought to record both local and regional slopes. Gill (1979) suggested that Gull Island Formation slumps moved towards the south-east, down “tectonically-generated slopes”, but that the formation as a whole prograded eastwards.
Martinsen (1989) proposed a submarine delta slope environment for the Gull Island Formation, where the main locus of deposition was thought to be a narrow central trough, with its axis positioned close to the present day Shannon Estuary. Building upon this study, Collinson et al. (1991) interpreted the Gull Island Formation as sediments derived from a delta that collapsed down an ESE-SE palaeoslope and that periodically underwent avulsion. The delta was thought to have been positioned to the west during early Gull Island Formation deposition and moved towards the north-west with time.
Martinsen et al. (2000) developed a modified model for the environment of deposition, reflecting their division of Gull Island Formation stratigraphy into lower and upper units. Lower Gull Island sediments were interpreted as a mud-rich turbidite system recording aggradation of axially (ENE) transported basin floor turbidites and muddy slumps moving SE down palaeoslope. The source of the slumps was thought to be a degrading northern slope (Martinsen et al., 2000). Lower Gull Island Formation sediments were thought to sidelap and onlap the narrow basin margin. Upper Gull Island Formation sediments were argued to result from progradation of the northern basin slope, which was deposited on top and over older basin floor sediments.
Wignall & Best (2000) reassessed the basin and envisaged a different model whereby the system was dominated by a NE facing submarine slope, which prograded to the NE with time. Like Rider (1974), their model evokes the vertical succession to record progradation of a linked shelf-slope-basin floor system and the Gull Island Formation sediments were interpreted as the direct record of progradation of that unstable NE slope.
Martinsen & Collinson (2002) questioned the interpretations by Wignall & Best (2000), with debate centring upon the geometry of the basin, the site of maximum subsidence and location of the depocentre. Martinsen & Collinson (2002) favour a basin axis positioned close to the present day Shannon Estuary, whereas Wignall & Best (2000, 2002) envisage the deepest most distal part of basin to be located in the NE. One of the lynch-pins behind this multi-faceted debate is the slump transport directions of the Gull Island Formation inferred by Martinsen and colleagues, which were refuted by Wignall & Best (2000, 2002). Strachan & Alsop (2006) used the north Co. Clare Fisherstreet Slump to robustly show a deep marine ENE dipping trough or sub-basin.
Despite the different interpretations summarised above, all authors agree the Gull Island Formation represents deposits from encroaching, unstable, submarine slopes associated with a dramatic increase in sedimentation rate. However, there remains a number of observational inconsistencies and questions concerning the Gull Island Formation that are currently only partly addressed. These include the orientation and shape of the Shannon Basin or sub-basins at the time of deposition, the orientation of submarine slopes, the location of sediment source areas, the internal stratigraphic evolution of the Gull Island Formation and the dominant control on instability migration from south to north through time.
8.2 Gull Island Formation Outcrops
Three outcrops of the Gull Island Formation are described below: Stop 1, Gull Island; Stop 2, Fisherstreet and Stop 3, Cliffs of Moher (Fig. 8.1.1). Collectively, these field stops document the regional variation in the Formation.
Directions to Stop 1 (UTM 445710 m E, 5829200 m N; Map 63, 077998 m E, 152462 m N)
Stop 1 is located on the north coast of the Loop Head Peninsula, ~ 2.5 km north-west of the village of Cross (Fig. 8.2.1). From Cross, travel west on the R487 for ~ 1.5 km, and turn north on the dirt road labelled ‘Trusklieve’. Proceed north for ~ 1 km, and then turn west on another dirt road that ends at a quarry (Fig. 8.2.1). Note that after heavy rain, the surface of these roads can be difficult for normal vehicles. Park at the east side of the quarry. This stop is best exposed at low tide, although it is accessible at all times. For safety, stay > 5 m from the edges of the cliffs at all times. Care should be taken as the rocks are slippery when wet and strong wind gusts are frequent. The stop takes one half to a full day to complete.

Fig. 8.2.1. Geological map of the Loop Head Peninsula documenting the location of Stop 1, the Gull Island outcrop.
Map modified after Pyles (AAPG © 2008, used by permission of the AAPG whose permission is required for further use).
Stop 1 (Gull Island)
The Gull Island outcrop at Stop 1 is the type section of the Gull Island Formation (Rider, 1974; Figs 8.2.1 to 8.2.3). The contact between the Gull Island Formation and underlying Ross Sandstone is placed at the R1a3 marine band, which occurs just below the first slumping in this area and is located at the southern part of the outcrop where strata dip ~ 70 degrees north (Figs 8.2.2. and 8.2.3A), although Gill (1979) and Collinson et al. (1991) suggest that the R1a5 condensed section be used as the contact. The contact between the Gull Island Formation and Central Clare group is located at the northern part of the outcrop where strata dip ~ 15 degrees north (Pyles, 2008; Figs 8.2.2 and 8.2.3). This contact occurs at the base of the coarsening-upward succession that leads to the Tullig Sandstone at Tullig Point.
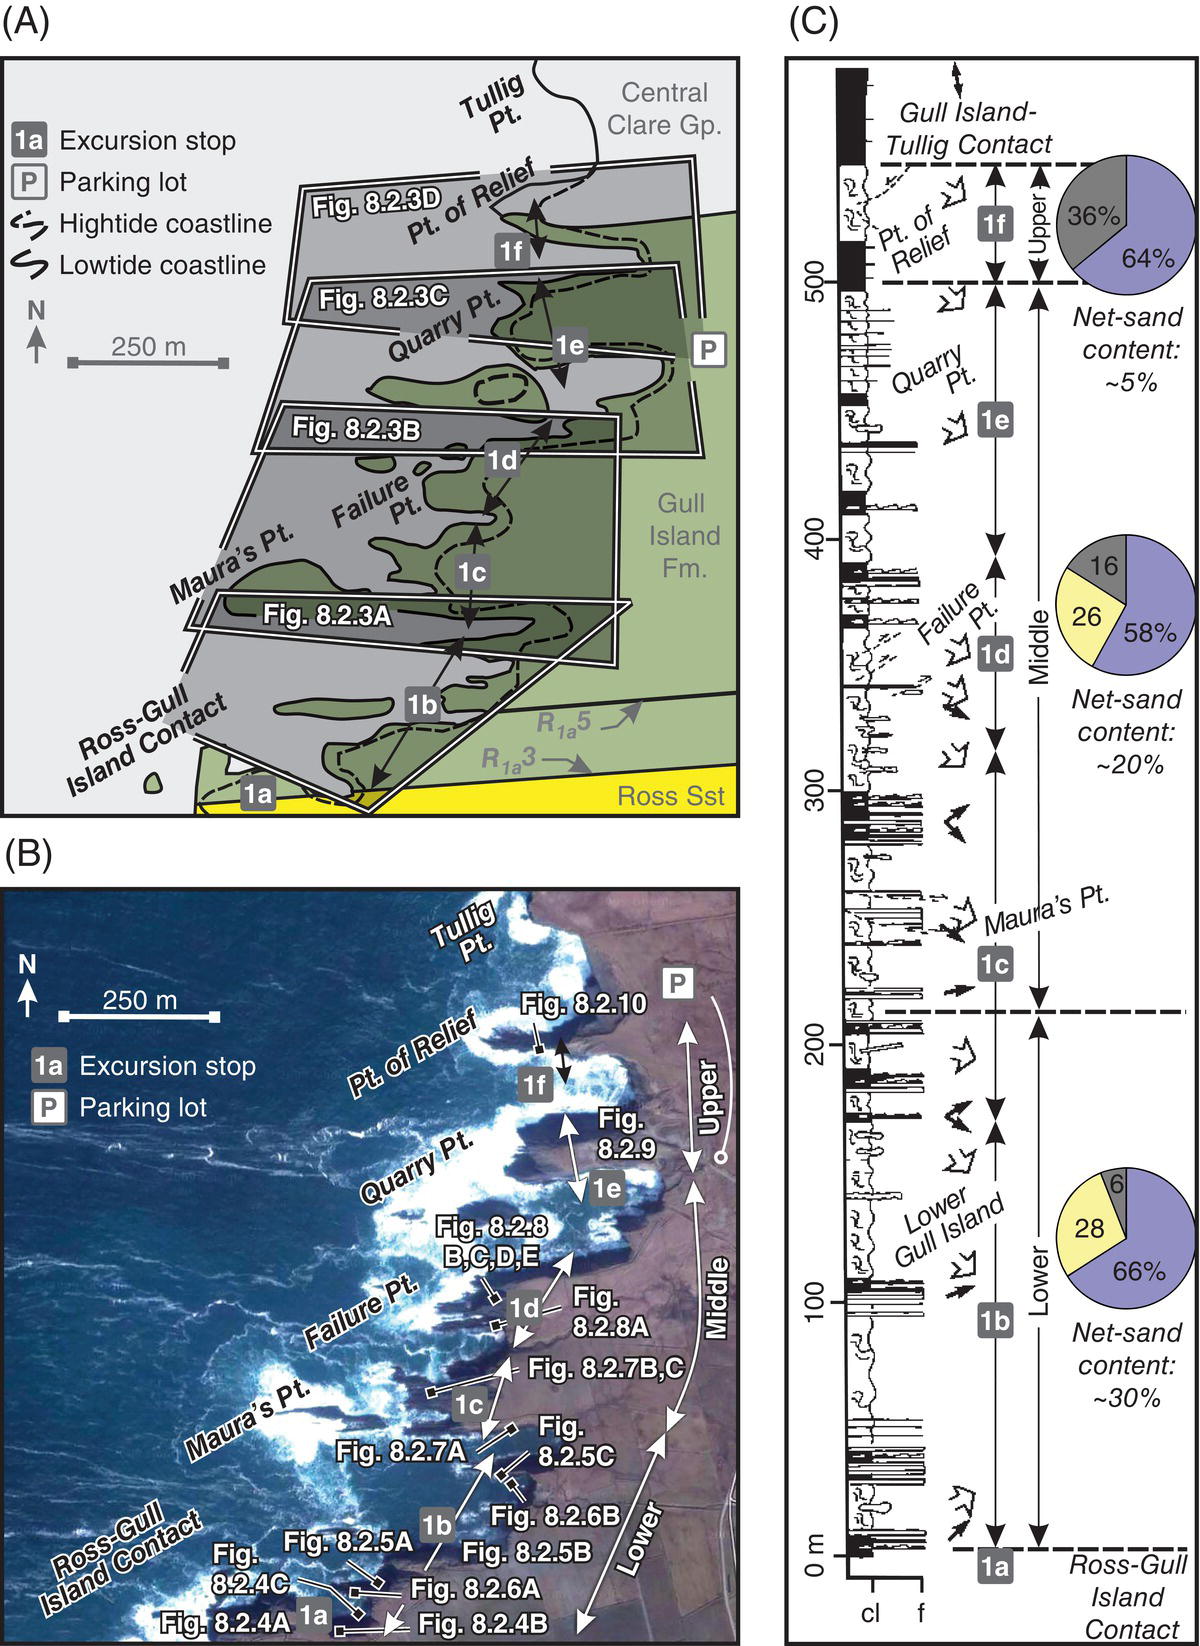
Fig. 8.2.2. A, B) Geologic map and satellite photograph of Stop 1 documenting the locations of the six field localities (image courtesy GoogleEarth; © DigitalGlobe). Note that the Ross Sandstone Formation - Gull Island contact is drawn on the R1a3 (personal communication Trevor Elliott and Andrew Pulham) condensed section, which is a surface that records the onset of slumping in the area. C) Stratigraphic column through the Gull Island Formation at Stop 1 (modified from Collinson et al. (1991)). The base of the column coincides with the R1a5 condensed section (see inset map for location). Wide arrows indicate palaeoslope measurements whereas smaller bold arrows indicate palaeocurrent measurements. Pie charts document proportions (by thickness) of architectural elements (blue = slumps; yellow = turbidite channels and lobes, grey = mudstone sheets).

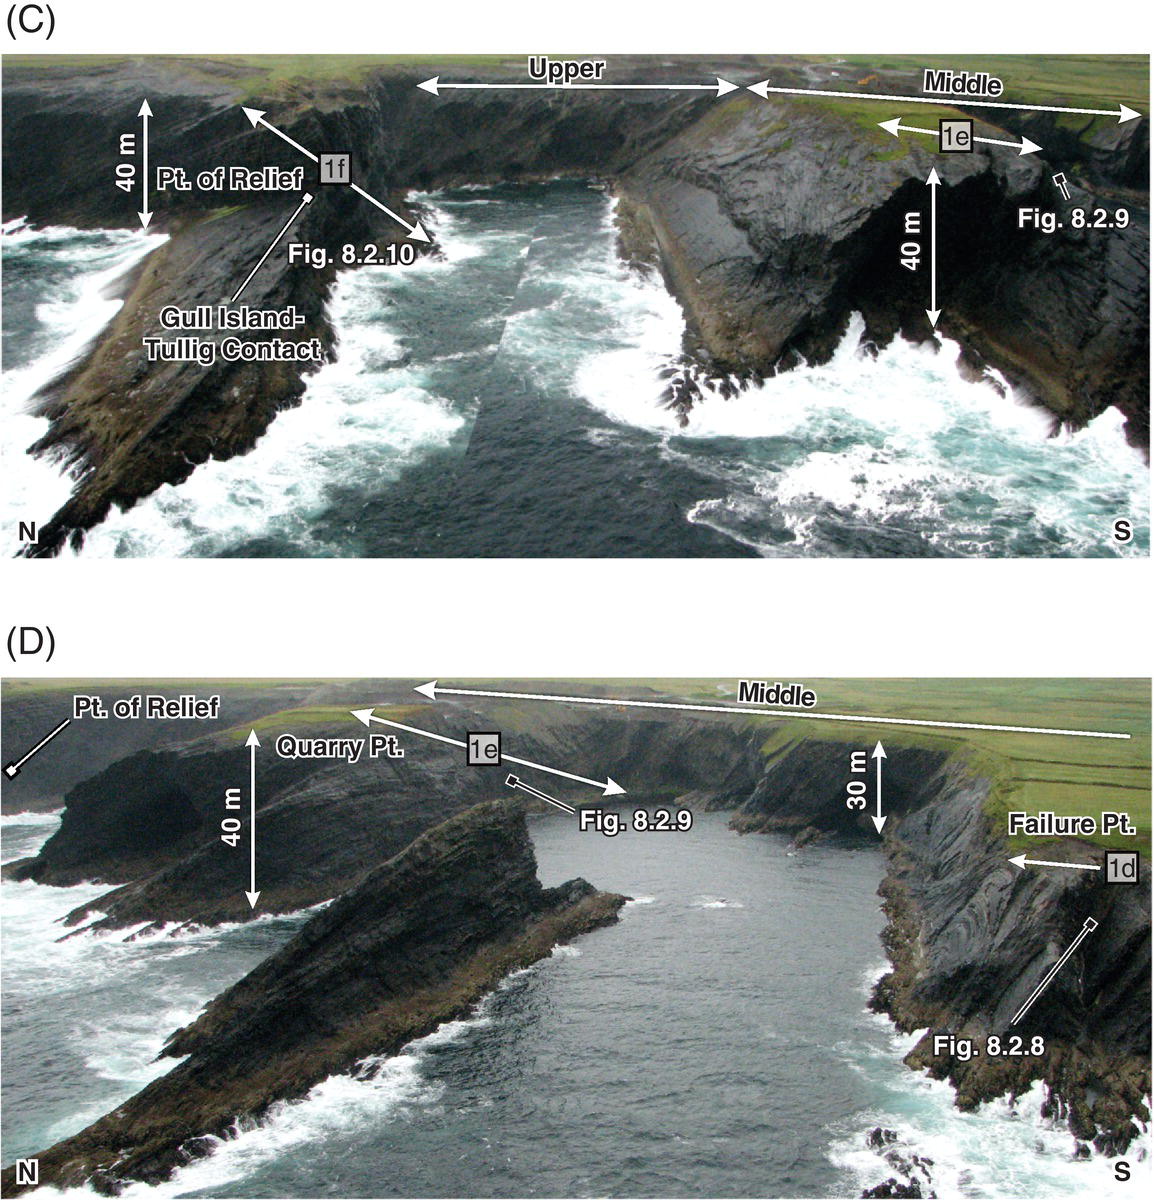
Fig. 8.2.3. Aerial photographs of Stop 1, the Gull Island Outcrop, documenting locations of the six field localities. The locations of photographs are shown in Fig. 8.2.2.
This outcrop is extensively documented by Rider (1974), Martinsen (1989), Martinsen and Bakken (1990), Collinson et al. (1991), Martinsen et al. (2000, 2003), Wignall and Best (2000, 2002) and Martinsen and Collinson (2002). Palaeocurrent and palaeoslope measurements published by Collinson et al. (1991) are shown adjacent to the stratigraphic column in Fig. 8.2.2C. Martinsen et al. (2000; 2003) document sediment transport directions from flutes and ripples to the east and palaeoslope measurements from extensional faults and fold axes to the south-east. In contrast, Wignall & Best (2000, 2002) document palaeocurrent and palaeoslope measurements to the north and north-west.
Four lithofacies associations are recognised at this exposure and are interpreted to represent architectural elements:
- Contorted mudstone and sandstone beds associated with shear planes, extensional faults and thrust faults are interpreted as slumps. Slumps are defined as displaced sediment bounded by a lower shear plane where internal strata are contorted and rotated (Stow, 1986).
- Laminated mudstone beds are interpreted as mudstone sheets. Mudstone sheets are fine-grained sediment bounded by planar upper and lower bounding surfaces. They are laterally persistent and composed primarily of laminated mudstone (Pyles & Jennette, 2009).
- Tabular turbidite beds with internal thickening-upward trends are interpreted as turbidite lobes. Turbidite lobes have planar lower bounding surfaces and broadly convex-upward upper bounding surfaces. They are thickest and sandstone rich in their axis and strata become thinner and finer-grained toward their lateral and distal margins (Pyles, 2007; Pyles & Jennette, 2009; Pyles & Strachan, Chapter 7).
- Lenticular turbidite beds associated with erosional features that are > 2 m in relief are interpreted as turbidite channels. Channels have convex-upward lower bounding surfaces and planar upper bounding surfaces except when truncated by younger elements. Channels are thickest and sand-rich in their axes and strata thin and become finer-grained toward their lateral margins (Pyles, 2008).
The stratigraphy at this outcrop is informally divided into three units – lower, middle and upper – representing an upward transect through the formation. Each unit is distinctive in terms of the physical observable characteristics of strata.
Lower Gull Island Formation
The lower Gull Island Formation is described in Stops 1a and 1b below (Figs 8.2.2, 8.2.3A and 8.2.4 to 8.2.6).
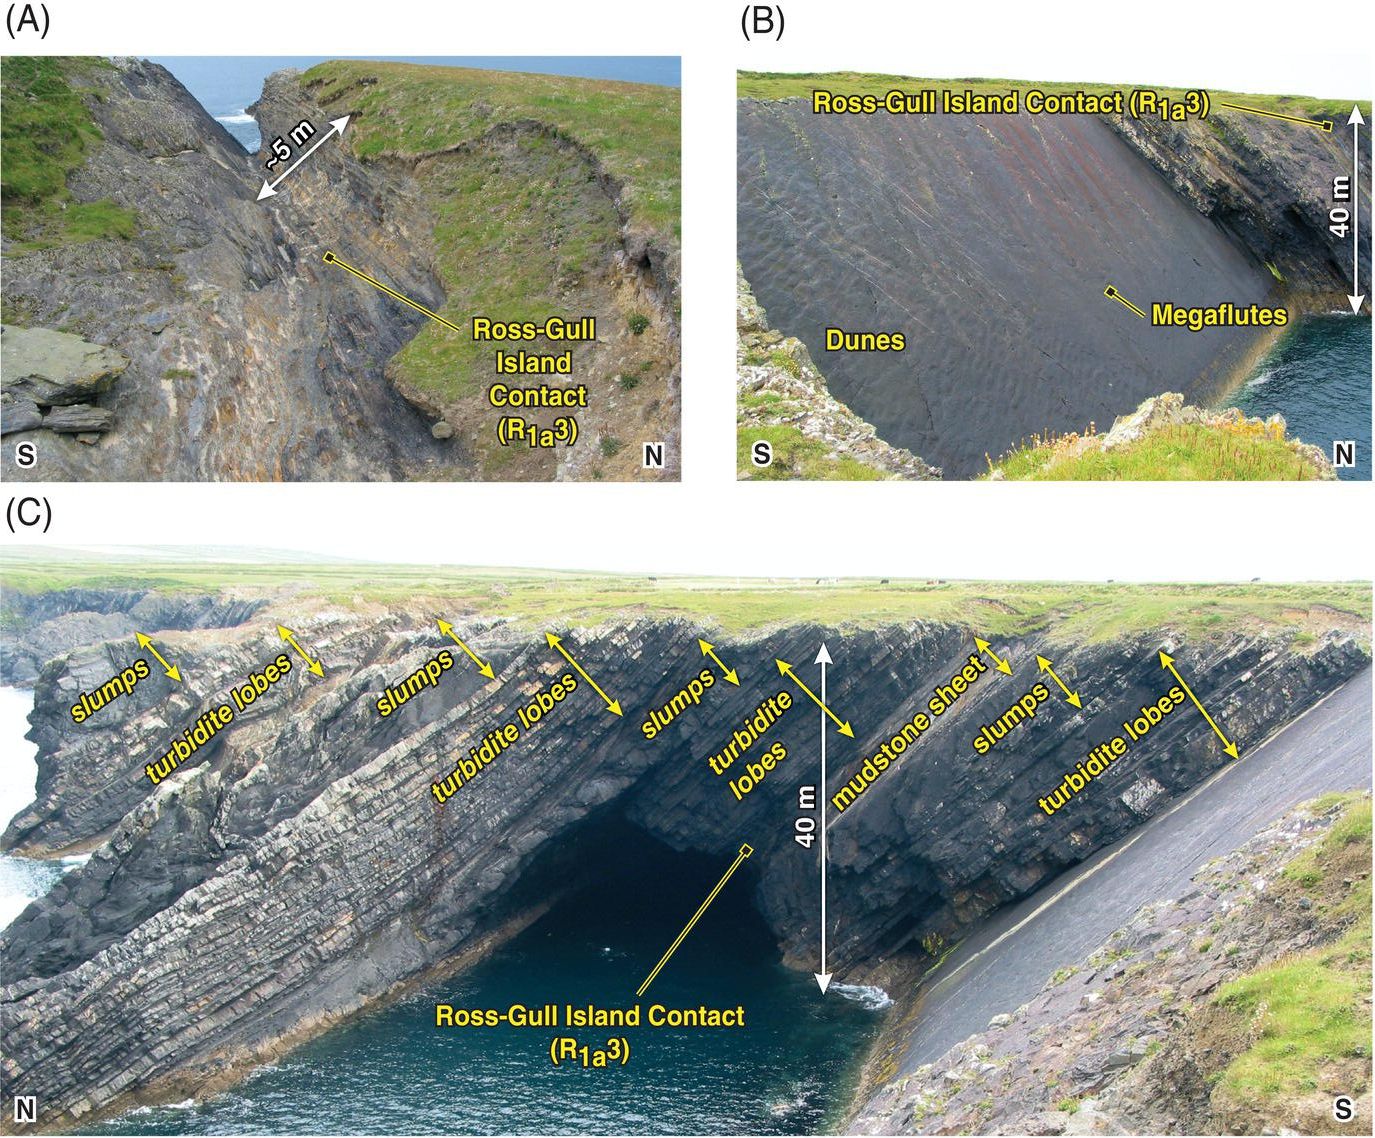
Fig. 8.2.4. A) Photograph of the contact between the Ross Sandstone and Gull Island formations (Stop 1a) on the western side of the outcrop. B) Photograph of the contact between the Gull Island Formation adjacent to a dramatic dip slope of the upper Ross Sandstone (Stop 1a) that contains megaflutes and dunes. C) Photograph of turbidite lobes and slumps in the Lower Gull Island Formation (Stop 1b). Locations of photographs are documented in Figs 8.2.2 and 8.2.3.

Fig. 8.2.5. Photographs of slumps in the lower Gull Island Formation (Stop 1b). The locations of photographs are documented in Figs 8.2.2 and 8.2.3.

Fig. 8.2.6. A) Photograph of turbidite lobes in the lower Gull Island Formation (Stop 1b). B) Photograph of turbidite channels in erosional contact with a turbidite lobe in the lower Gull Island Formation (Stop 1b). The locations of photographs are shown in Figs 8.2.2 and 8.2.3.
Stop 1a is located in the southern part of the outcrop at the contact between the Ross Sandstone and Gull Island formations (Figs 8.2.2 & 8.2.3). The lower Gull Island Formation contact is exposed where the contact dips into the ocean at the western part of the outcrop (Fig. 8.2.4A; UTM 444980 m E, 5828425 m N; Map 63, 077257 m E, 151697 m N) and adjacent to a steeply dipping dipslope in the upper Ross Sandstone (Figs 8.2.3A, 8.2.4B and C; UTM 445045 m E, 5828417 m N; Map 63, 077321 m E, 151688 m N; and UTM 445120 m E, 5828420 m N; Map 63, 077397 m E, 151690 m N). The contact between the formations is locally the R1a5 condensed section (Rider, 1974; Collinson et al., 1991; Pyles, 2008) and is accessible on the western-most exposure (UTM 444980 m E, 5828425 m N; Map 63, 077257 m E, 151697 m N). At this locality the condensed section is a ~ 1 m thick interval of black shale with goniatites, which is encased in turbidites.
Stop 1b comprises the lower 220 m of the Gull Island Formation (Fig. 8.2.2). The stop extends from the lower contact of the Gull Island Formation (UTM 444980 m E, 5828425 m N; Map 63, 077257 m E, 151697 m N) northward to the southern boundary of Maura’s Point (Figs 8.2.2, 8.2.3A and 8.2.4C; UTM 445460 m E, 5828750 m N; Map 63, 077741 m E, 152015 m N). The lower Gull Island Formation contains sandstone-mudstone couplets that are tens of metres in thickness (Fig. 8.2.4C). The sandstone-rich parts of the couplets are composed of turbidite lobes and to a lesser extent turbidite channels, whereas mudstone-rich parts of the couplets are composed of slumps and to a lesser extent mudstone sheets (Figs 8.2.4 to 8.2.6). The sandstone-rich component of the couplets decreases in thickness upward from one couplet to the next, resulting in an upward decrease in net-sand content within the lower Gull Island Formation (Fig. 8.2.3A). The average net-sand content for the unit is ~ 30%, although the majority is located in the lower 100 m. This vertical stacking is similar to that of the upper Ross Sandstone at the Bridges of Ross (Pyles, 2008; Pyles & Strachan, Chapter 7, Stop 5).
Slumps are the most abundant architectural element in the lower Gull Island Formation and comprise ~ 66% of exposed strata (Fig. 8.2.2C). Three slumps are particularly well exposed at this locality (Fig. 8.2.5) and the characteristics common to all are: (1) their lower bounding surfaces are shear planes; (2) internally they contain contorted and rotated strata such as folds and thrust faults; and (3) the upper bounding surfaces of the slumps are flat erosional surfaces (Fig. 8.2.5). Distinctions between slumps in the lower Gull Island Formation are: (1) the amount of sandstone within them decreases from one to the next upward through the transect; (2) strata in sandstone-rich slumps are contorted and rotated and have thrust faults (Fig. 8.2.5A and B), whereas strata in mudstone-rich slumps are contorted, have thrusts and fluidized features such as sandstone balls and internally-deformed clasts in a mud-rich matrix (Fig. 8.2.5C); and (3) the slumps increase in thickness from one to the next through the upward transect.
Turbidite lobes, similar to those in the Ross Sandstone, are the second most abundant architectural element in the lower Gull Island Formation and comprise ~ 24% of exposed strata at this location (Figs 8.2.2C and 8.2.6A). Their characteristics are: (1) they are located in the sand-rich parts of sandstone-mud couplets in intervals 3 to 15 m in thickness (e.g. Fig. 8.2.6A); (2) internally they contain units with upwardly thickening and coarsening beds that are 1 to 5 m in thickness, with each individual upward coarsening unit being interpreted as a lobe; and (3) bedding is laterally persistent and there is little evidence of erosion between and within thickening-upward units. Lobes and associated sandstone-rich units decrease in abundance upward through the lower Gull Island Formation.
Mudstone sheets comprise ~ 6% of exposed strata in the lower Gull Island Formation at this locality (Figs 8.2.2C and 8.2.4C). They contain laminated and fissile, dark grey shale interbedded with structureless mudstone beds. Mudstone sheets increase in abundance upward through the lower Gull Island Formation and the lower shear planes of slumps commonly detach into mudstone sheets.
Turbidite channels are the least abundant architectural element in the lower Gull Island Formation and comprise ~ 3% of exposed strata (Figs 8.2.2C and 8.2.6B). They have erosional bases that are overlain by a lenticular mudstone layer, which is in turn onlapped by sandstone turbidites. Critically, the amount of erosion scales to the thickness of the interval. Channels are in erosional contact with underlying lobes and are ~ 5 m in thickness, this coinciding with the mean value measured for those in the Ross Sandstone (Pyles, 2007).
In summary, the lower Gull Island Formation is ~ 220 m thick and is composed of ~ 66% slumps, ~ 25% turbidite lobes, ~ 6% mudstone sheets and ~ 3% turbidite channels (Fig. 8.2.2). The average net-sand content of the unit is ~ 30%. The lower Gull Island Formation contains several sandstone-mudstone couplets. The sandstone-rich parts of the couplets are interpreted as turbidite lobes and minor channels whereas the mudstone-rich parts of the couplets are slumps and to a lesser degree mudstone sheets. Upward changes in stratal characteristics include: (1) a decrease in net-sandstone content; (2) a decrease in the abundance of turbidite lobes and channels; (3) a decrease in the abundance of sandstone within slumps; and (4) an increase in the abundance of mudstone sheets.
Middle Gull Island Formation
The middle Gull Island Formation is described in Stops 1c, 1d and 1e below (Figs 8.2.2B, 8.2.3, and 8.2.7 to 8.2.9).
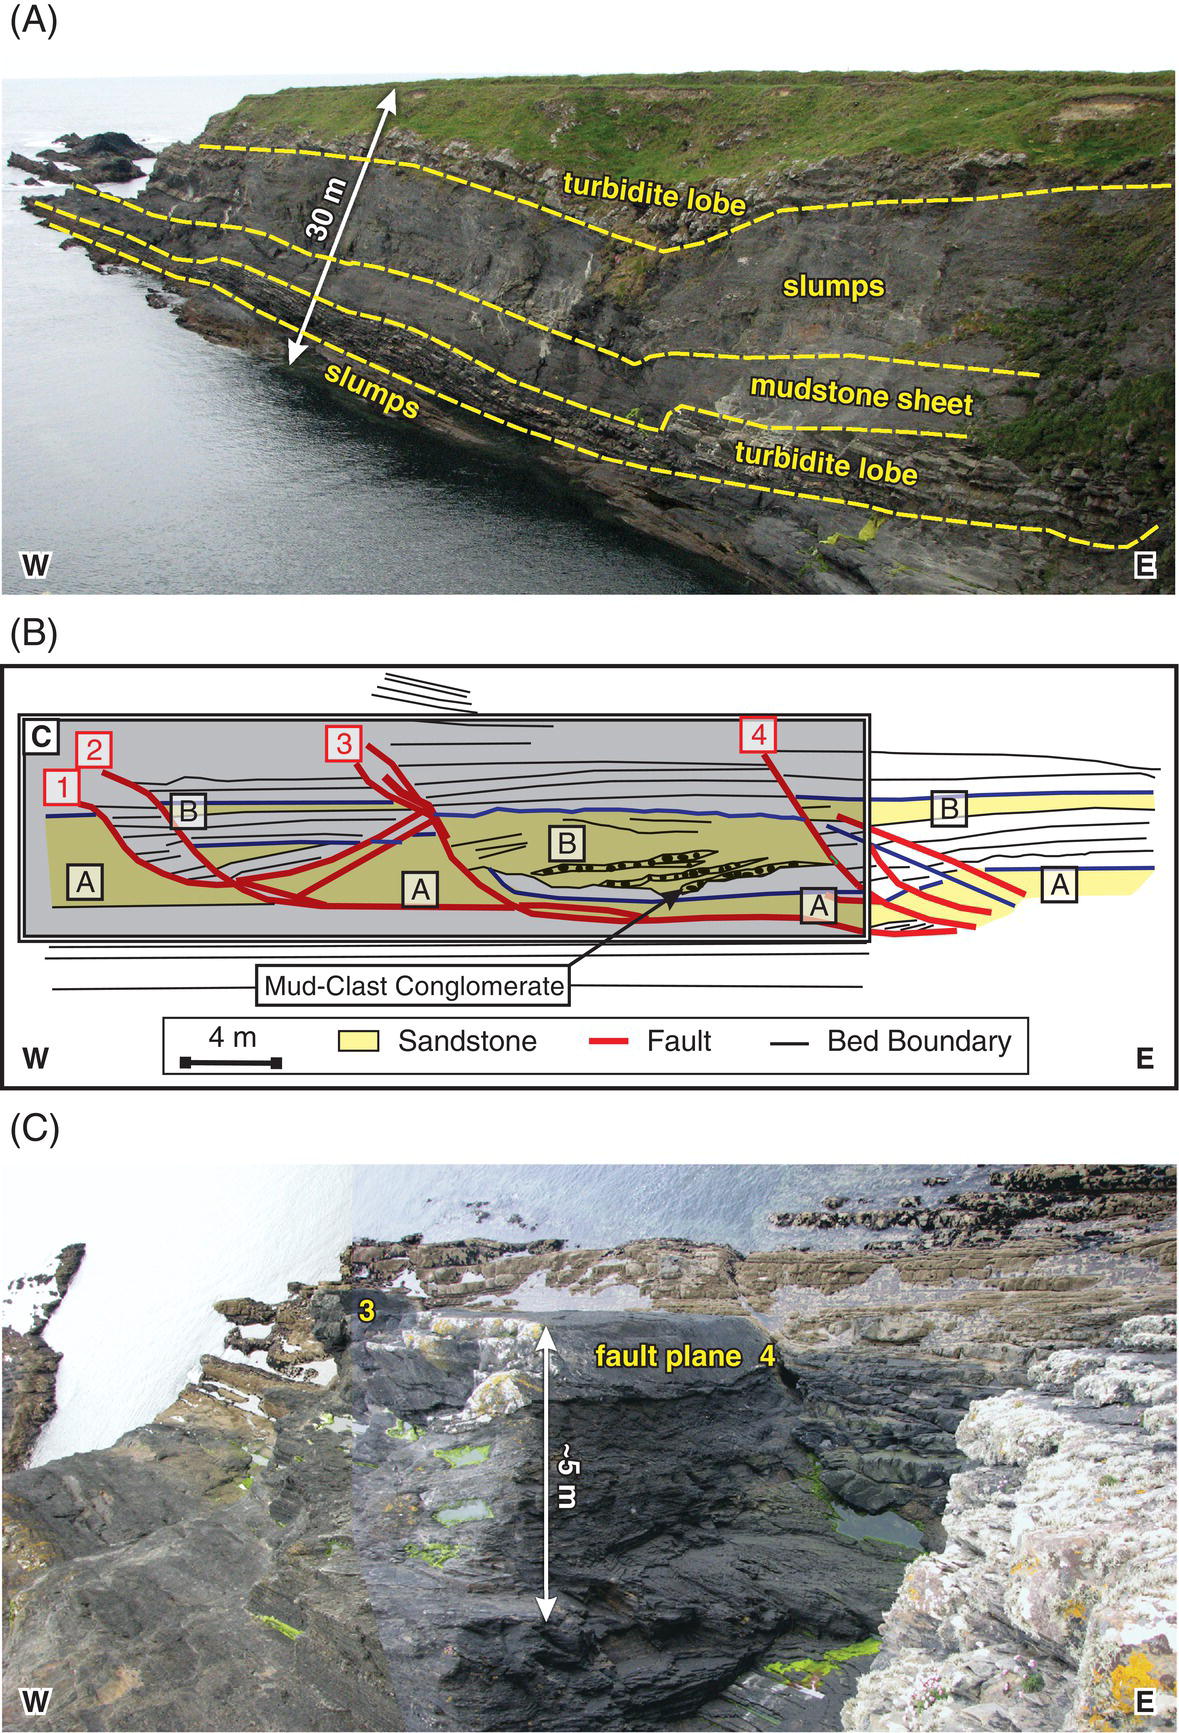
Fig. 8.2.7. A) Photograph of a laterally-continuous exposure in the middle Gull Island Formation at Maura’s Point (Stop 1c). Turbidite lobes are thinner and lobes have a lower net-sand content at this locality than in the lower Gull Island Formation (Stop 1b). B, C) Line drawing modified from Martinsen & Bakken (1990) and photograph of a deformed unit at Maura’s Point. The locations of photograph and line drawing are shown in Figs 8.2.2 and 8.2.3.
Reproduced with permission from the Geological Society of London.

Fig. 8.2.8. A) Photograph of slumps in the middle Gull Island Formation at Failure Point (Stop 1d). The net-sand content of lobes is low. B, C, D, E) Line drawing modified from Martinsen & Bakken (1990) and photographs of a deformed unit at Failure Point. The locations of photographs and line drawings are shown in Figs 8.2.2 and 8.2.3.
Reproduced with permission from the Geological Society of London.
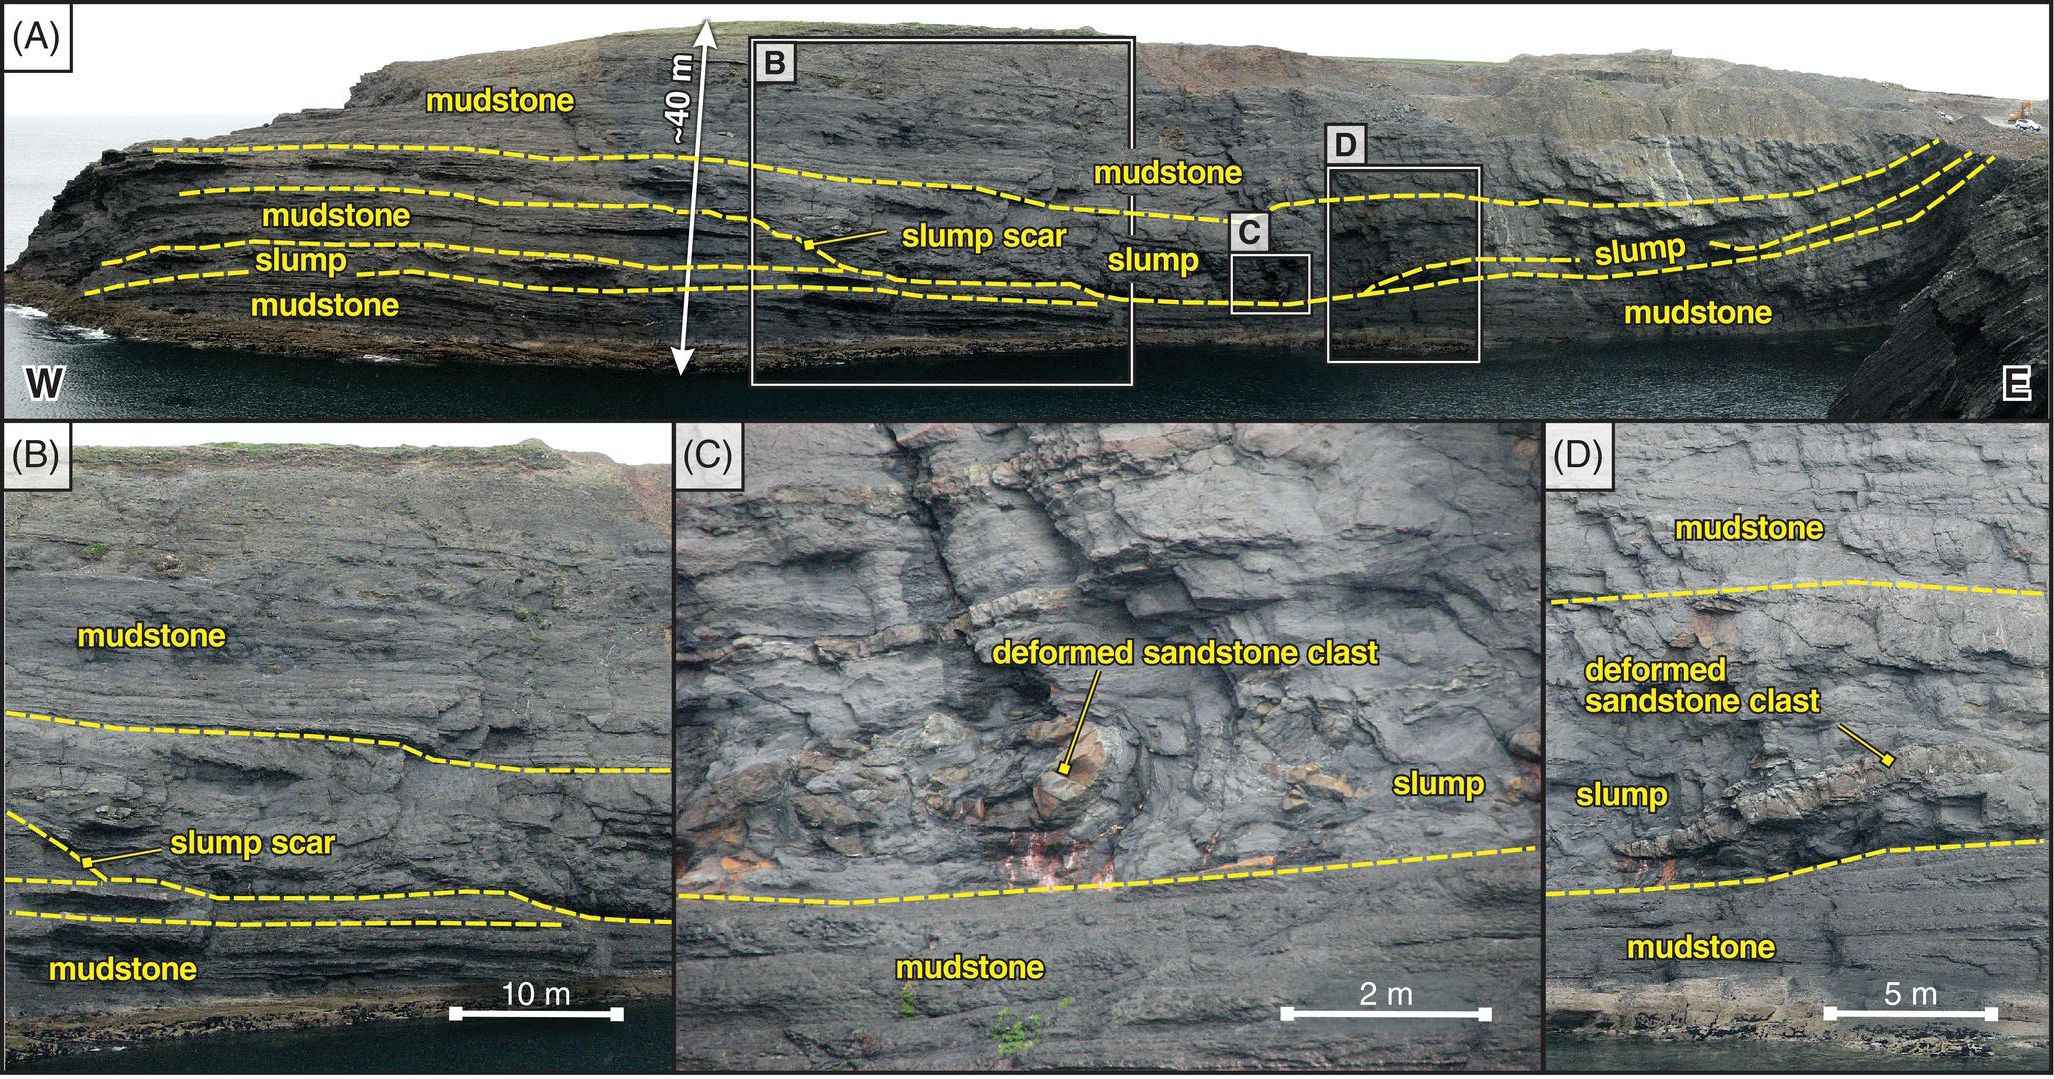
Fig. 8.2.9. Photographs of slumps and mudstone sheets in the middle Gull Island Formation at Quarry Point. This exposure contains a large-scale slump scar, slumps and mudstone sheets (Stop 1e). The slump scar is overlain by deformed sandstone clasts and contorted mudstone. The locations of photographs are documented in Figs 8.2.2 and 8.2.3.
Stop 1c is located north of Stop 1b and comprises all of the strata exposed on Maura’s Point, the largest peninsula in the outcrop (Figs 8.2.2, 8.2.3B and 8.2.7). The lowermost strata at Maura’s Point are well exposed on a > 250 m wide outcrop on the southern part of the peninsula (Fig. 8.2.7A; UTM 445365 m E, 5828756 m N; Map 63, 077646 m E, 152023 m N). Strata at this location comprise interbedded slumps, turbidite lobes and mudstone sheets. Turbidite lobes are < 5 m in thickness whereas the slumps are up to 15 m thick. These strata are accessible at the western-most part of the peninsula during low tide (UTM 445223 m E, 5828748 m N; Map 63, 077504 m E, 152017 m N).
Strata in the northern part of Maura’s Point are described by Martinsen & Bakken (1990) (Fig. 8.2.7C; UTM 445255 m E, 5828820 m N; Map 63, 077537 m E, 152088 m N) and contain listric faults that detach into a lower shale-rich interval. Shear sense indicators on the faults indicate dip-slip movement down to the east. Martinsen & Bakken (1990) documented wedge-shaped sandstone beds on the hangingwall of the faults that thicken toward the faults (see strata on hangingwall of Fault 2 in Fig. 8.2.7B) and interpreted them to record syn-sedimentary growth. The amount of offset on the faults ranges from several cm to several m. Through the use of cross-cutting relationships, Martinsen & Bakken (1990) documented the faults to become successively younger to the east and interpreted this pattern to record downslope propagation of the head region of a slide named the Maura’s Point slide. However, as the unit is internally-deformed, we interpret this feature as a slump (sensu Stow, 1986). Maura’s Point slump is significant as it is the oldest stratigraphic feature in the Gull Island Formation that contains extensional features – all of the underlying slumps contain predominantly contractional features (Figs 8.2.4C, 8.2.5 and 8.2.7A) and the upper bounding surface of the Maura’s Point slump unit is faulted, unlike those in the lower Gull Island Formation. The irregular topography on the upper surface served to locally accommodate lenticular strata, such as unit ‘B’ in Fig. 8.2.7B.
Stop 1d is located north of Stop 1c and comprises all of the strata exposed at Failure Point (Figs 8.2.2, 8.2.3B and 8.2.8; UTM 445325 m E, 5828965 m N; Map 63, 077609 m E, 152232 m N). The lowermost strata at Failure Point are well-exposed on the western part of the peninsula and are predominantly slumps and mudstone sheets (Fig. 8.2.8A; UTM 445332 m E, 5828959 m N; Map 63, 077616 m E, 152226 m N). Although sandstone units are not abundant, when present they are lenticular. The upper strata at Failure Point are described by Martinsen & Bakken (1990) (Figs 8.2.8B, C, D and E; UTM 445360 m E, 5828990 m N; Map 63, 077645 m E, 152257 m N). The lower part of the unit is shale-rich and contains thrust faults that converge to a basal detachment surface (Figs 8.2.8B and C). The unit is interpreted as a slump. The upper surface of the slump is irregular and overlain by a lenticular sandstone unit that is thickest where the underlying slump is thinnest and contains load structures on its lower bounding surface (Figs 8.2.8B, C and D). The sandstone unit is interpreted as a turbidite that was deposited on the topographically irregular slump. The lenticular sandstone unit is not interpreted as a channel as the lower bounding surface is conformable with underlying strata and shows load structures.
Stop 1e is located north of Stop 1d and comprises all strata exposed at Quarry Point (Figs 8.2.2, 8.2.3C and 8.2.9). The lowermost strata at Quarry Point are well exposed on a > 250 m wide outcrop on the southern part of the peninsula (Fig. 8.2.9A; UTM 445530 m E, 5829202 m N; Map 63, 077818 m E, 152467 m N). Strata at this location comprise interbedded slumps and mudstone sheets. Sandstones only occur as deformed clasts within slumps (Fig. 8.2.9C). The most distinctive feature at this exposure is a large erosional surface that is ~ 20 m in relief. This surface truncates underlying mudstone sheets and slumps and the maximum depth of erosion is located in the centre of the exposure (Fig. 8.2.9A). The deepest part of the erosional surface is overlain by deformed sandstone clasts set in a mud matrix (Figs 8.2.9C, and D). The erosional surface is interpreted as a slump scar overlain by slumps, which are in turn overlain by mudstone sheets.
In summary, the middle Gull Island Formation includes the middle 300 m of the formation and is composed of ~ 58% slumps, ~ 26% turbidite lobes and ~ 16% mudstone sheets (Fig. 8.2.2). The average net-sand content of the unit is ~ 20%. Several stratal characteristics change upward through the unit: (1) net-sandstone content decreases; (2) mudstone sheets increase in abundance; (3) extensional features in slumps such as growth faults and slump scars are more abundant; (4) topography on the upper bounding surfaces of slumps are irregular; and (5) in the lower part of the succession, sandstone is laterally persistent and located in turbidite lobes, in the middle part of the succession sandstone is lenticular and located in topographically-confined areas above slumps, whereas in the upper part of the succession sandstone is located within slumps. The middle Gull Island Formation is distinct in the following ways: (1) it has a lower net-sandstone content than the lower Gull Island Formation; (2) slumps are predominantly composed of mudstone; (3) there are more abundant slumps with extensional features; (4) there is a higher proportion of mudstone sheets; and (5) slumps have irregular upper bounding surfaces.
Upper Gull Island Formation (UTM 445470 m E, 5829407 m N; Map 63, 077760 m E, 152673 m N)
Stop 1f is located north of Stop 1e and comprises ~ 100 m of strata exposed at the Point of Relief (Figs 8.2.2, 8.2.3D and 8.2.10), and contains the uppermost strata of the Gull Island Formation and the lowermost strata of the Tullig Cyclothem. The Point of Relief is best viewed from the promontory to the south (Quarry Point; UTM 445530 m E, 5829240 m N; Map 63, 077818 m E, 152505 m N).
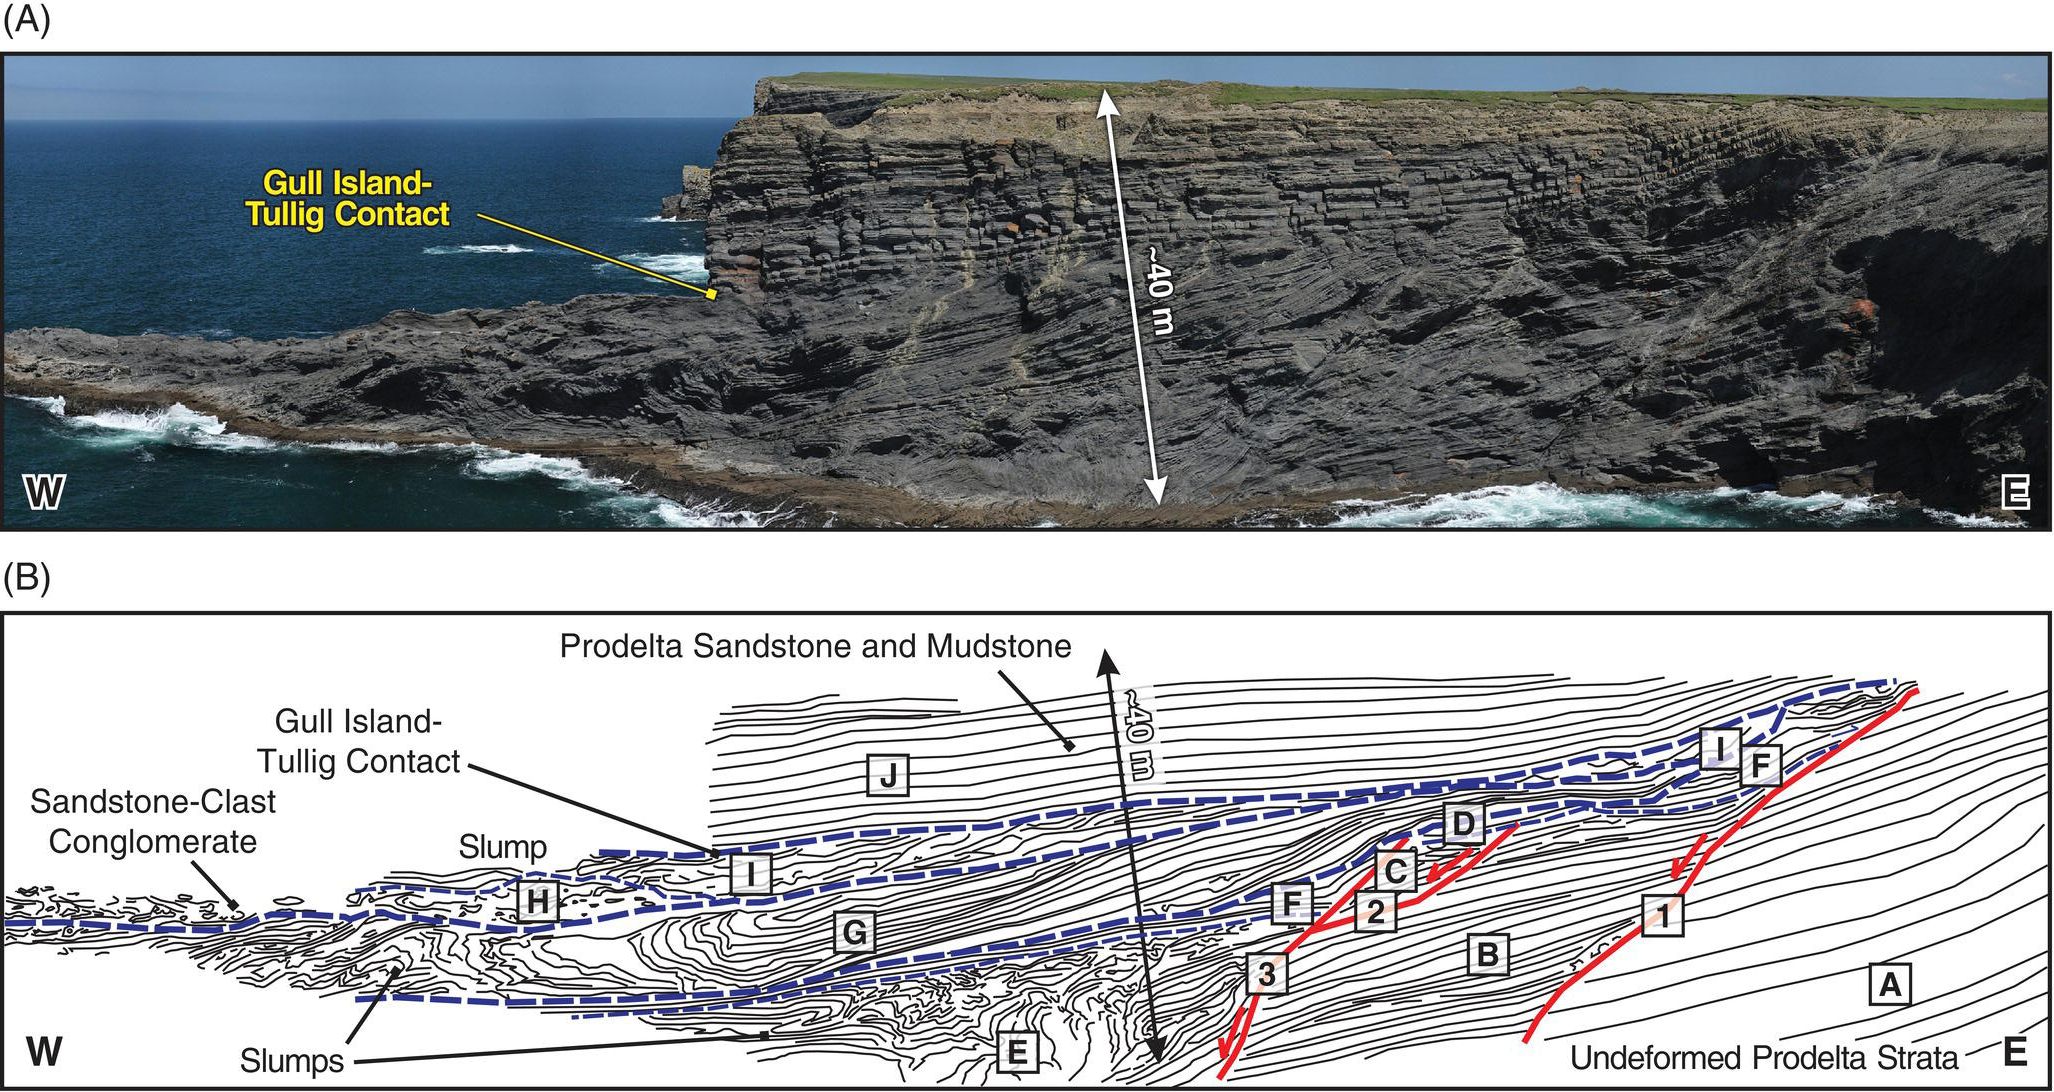
Fig. 8.2.10. Photograph and line drawing of the deformed unit at the Point of Relief (Stop 1f). Photograph courtesy of Jim Best. The upper surface of the Gull Island Formation is at the top of the deformed unit. The locations of photographs and line drawing are documented in Figs 8.2.2 and 8.3.3. Red lines are growth faults and record offset to the west-north-west. Blue lines are boundaries between the stratigraphic units described in the text. See online GigaPan image.
The most prominent feature at the Point of Relief is a unit containing deformed strata exposed on the western half of the peninsula (Fig. 8.2.10) that Martinsen & Bakken (1990) describe in detail (Fig. 8.2.10B). The unit is ~ 35 m thick and contains three westerly-dipping growth faults (labelled 1 to 3 in Fig. 8.2.10B). Fault 1 is the eastern limit of the deformed unit. Shear sense indicators including drag folds are located on the hangingwall of the faults indicating extensional, normal dip-slip motion (Martinsen & Bakken, 1990). The deformed unit contains nine subunits, each of which is internally deformed and interpreted as slumps (Fig. 8.2.10B). Collectively, the deformed unit is interpreted as a slump complex, although Martinsen & Bakken (1990) interpret it as a slide. There is a general increase in the amount of internal deformation within subunits from subunits b through i. Fault terminations indicate that fault 3 is the oldest and fault 1 is the youngest (Fig. 8.2.10) and that they were active during deposition (they are growth faults) and probably created local accommodation space for the slumps to be deposited. The faults indicate extension to the west-north-west (Wignall & Best, 2000) although Collinson et al. (1991) report transport direction to the south-east. The upper bounding surface of the deformed unit is the contact between the Gull Island Formation and the Tullig Cyclothem (Fig. 8.2.10). Strata below this surface contain deformed mudstones whereas strata above this surface become thicker-bedded and coarser-grained upward and are part of the Tullig Cyclothem. This surface is planar, erodes into underlying strata and is conformably overlain by planar bedded strata and was therefore flat when the overlying strata were deposited (Fig. 8.2.10). The composition of strata in the lower most Tullig Cyclothem (unit J) is interbedded, thin-bedded sandstone and siltstone with rare Zoophycos and Paleodictyon trace fossils interpreted as prodelta deposits. The strata in the underlying slump complex are similar in composition, although deformed.
In summary, the upper Gull Island Formation is ~ 100 m thick and comprises 36% mudstone sheets and 64% slumps (Fig. 8.2.11). The average net sand content of the unit is ~ 5%. The primary distinction between the upper and middle parts of the Gull Island Formation is: (1) the upper Gull Island Formation has a lower net-sandstone content; (2) the upper Gull Island Formation contains a higher proportion of mudstone sheets; and (3) the deformed unit in the Upper Gull Island Formation is the most complex of those in the entire formation in South Co. Clare.

Fig. 8.2.11. Stratigraphic column and pie charts documenting upward patterns in the Gull Island Formation at the Gull Island outcrop (Stop 1). Labels 1a – 1f denote locality numbers.
Stratigraphic column modified from Collinson et al. (1991).
South County Clare Summary
The Gull Island outcrop (Stop 1) is the type section of the Gull Island Formation and contains a complete vertical transect through the formation. At this locality the formation is informally divided into three units on the basis of physical, observable stratal characteristics (Fig. 8.2.11): (1) lower, (2) middle; and (3) upper. Six characteristics decrease upward through the transect (Fig. 8.2.11): (1) net-sand content, (2) proportion of turbidite lobes and channels, (3) net-sand content in slumps, (4) amount of contractional features within slumps, (5) lateral continuity of sandstone units; and (6) the thickness of sandstone units. Five characteristics increase upward through the transect (Fig. 8.2.11): (1) proportion of slumps, (2) proportion of mudstone sheets, (3) amount and size of extensional features in slumps, (4) amount of topography on upper surface of slumps; and (5) lenticularity of sandstone units. The upward changes described herein are interpreted to reflect a temporal change from ponded (lower Gull Island) submarine fan strata, similar in character to those in the upper Ross Sandstone (Pyles, 2008), to a prograding slope in the middle and upper Gull Island Formation, although the direction of progradation is debated.
Northern County Clare
Two stops are detailed from which the Gull Island Formation can be observed (Fig. 8.2.12):
- Stop 2: Fisherstreet Bay, where the Clare Shale and Gull Island Formation contact is marked by a spectacular slump horizon (Gill, 1979; Strachan & Alsop, 2006).
- Stop 3: The Cliffs of Moher, where a complete Gull Island Formation succession is observable.

Fig. 8.2.12. Geologic map of northern County Clare documenting the location of field stops and goniatites.
Map based on Hodson (1954a; reproduced with permission from the Geological Society of London) and Gill (1979; copyright Geological Society of Ireland).
Transfer to Stop 2
From Stop 1, head back to the R487 and then drive northwards to Kilkee. From here, drive north along the N67 coast road and through Milltown Malbay to Lahinch, where you should take a left turn just past the town centre and head to Liscannor on the R478. Drive through Liscannor and continue on this road and past the Cliffs of Moher, until you turn left on the R479 towards the village of Doolin. Turn left at the junction at the bottom of the hill, and drive along the R459 into the small village of Fisherstreet, where parking is available. The drive between Stops 1 and 2 will take approximately 1 hour. Once you have parked your car, walk southwestwards and up the hill out of the village along River Vale Road. The Fisherstreet outcrops are easy to access from a track that leaves River Vale Road (UTM 472997 m E, 5872508 m N; Map 51, 105900 m E, 195411 m N). Walk south-west along the track, leaving it after ~ 2.5 km to walk westward. This stop takes one half to a full day to complete.
Stop 2: Fisherstreet Bay
The outcrop is 2.5 km long, ~ 30 m thick and comprises rock platforms and cliffs. The outcrop readily divides into 3 sections, separated by impassable cliffs. Only the southernmost section is suitable for larger groups, although it is easily accessed (by following a stream at UTM 472469 m E, 5872154 m N; Map 51, 105367 m E, 195064 m N) and affords exceptional three-dimensional exposures of the Fisherstreet Slump and overlying non-slumped units (Gill, 1979; Strachan & Alsop, 2006; Figs 8.2.13 and 8.2.14). The basal contact of the Fisherstreet Slump is also exposed within an inaccessible cliff close to Doolin (UTM 473722 m E, 5873284 m N; Map 51, 106636 m E, 196177 m N) where a planar, concordant surface separates underlying Clare Shales from the Gull Island Formation (Fig. 8.2.15; and see Chapter 6.2, Stop 2).

Fig. 8.2.13. Detailed geological map of Fisherstreet showing slump folds and faults, together with stereonets showing fold and fault data.
Figure modified from Strachan & Alsop (2006).
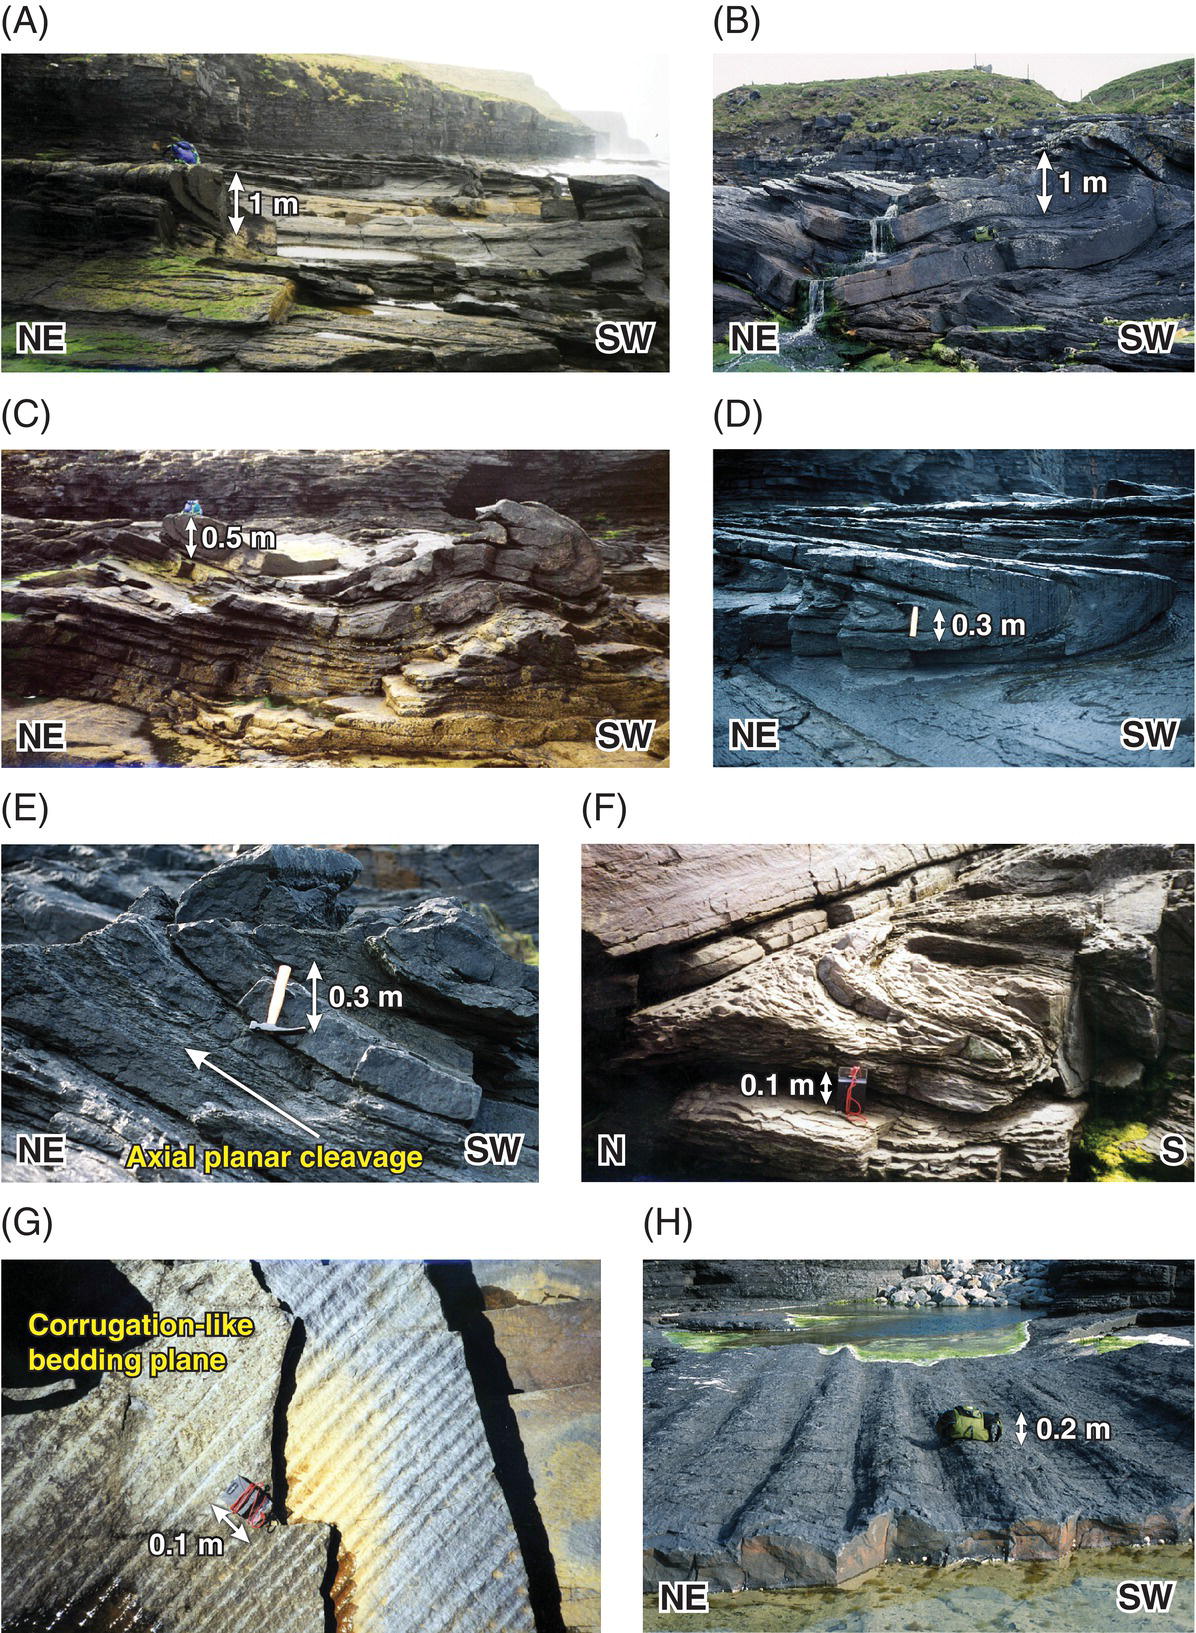
Fig. 8.2.14. Photographs of slump deformation structures from the southern end of the Fisherstreet outcrop (Fig. 8.2.13). A to F. Slump folds truncated and overlain by flat lying strata. G to H. Corrugate-like internal textures (upright folds).

Fig. 8.2.15. Schematic sedimentary log of lithofacies 1 to 6, together with pie charts showing the total number of beds and lithofacies average proportions by thickness in the study area. n = number of measurements.
Seven lithofacies are recognised (Tables 8.2.1 and 8.2.2) and grouped into 3 distinct depositional elements:
- A 20 m interval of intensely folded and faulted interbedded sandstones and mudstones bound by a sharp basal décollement and erosive upper contact (lithofacies 7). This interval is interpreted as a slump (sensu Stow, 1986), herein referred to as the Fisherstreet Slump (Strachan & Alsop, 2006). The contrast between the extensively deformed Fisherstreet Slump and overlying flat-lying strata (lithofacies 1 to 6) exhibits the penecontemporaneous nature of slump deformation that predated, and was eroded by, the overlying interval.
- Tabular mudstone-dominated sheets that display chaotic folding and faulting, deformed sandstone clasts, anastamosing cleavage, sharp flat-lying bases and faulted top bedding planes (lithofacies 3) are interpreted as debrites (Middleton & Hampton, 1973).
- Non-slumped interbedded sandstones and mudstones (lithofacies 1, 2 and 4 to 6) reveal a range of tabular and lenticular bed geometries that infill compensationally the topography of the Fisherstreet Slump. Formative flows frequently avulsed and shallowly incised (< 1 m) into the substrate and the resultant deposits become increasingly amalgamated and thicken up-section. Sedimentary structures, palaeocurrents and bed geometries suggest deposition from unconfined flows in a turbidite channel-to-lobe transition (e.g. Prélat et al., 2009; Eggenhuisen et al., 2011; Macdonald et al., 2011).
Table 8.2.1. Summary table of lithofacies observations. Lithofacies are arranged into grainsize divisions.
| Lithofacies name | Grain size | Bed thickness | Facies proportion | Number of beds | Sedimentary structures | Bed boundaries | Bed geometry |
| 1. Undeformed tabular mudstone | Silt | 0.01 to 0.24 m | 16% | 71 | Massive, parallel laminae, low amplitude ripples, fissile, some thickness variations along section. May contain plant matter. | Sharp, sometimes undulating upper surface. Undulating base where sediment infills topography from underlying ripples or sandstone volcanoes. | Tabular |
| 2. Upward-coarsening lenticular mudstone | Silt | 0.02 to 0.1 m | 2% | 3 | Inversely graded, massive, parallel laminae, loaded base, convolutions. | Sharp upper and lower surfaces. | Lenticular |
| 3. Deformed tabular mudstone | Silt | 1.3 to 3 m | 39% | 2 | Highly disrupted mudstone. Folding, faulting of mudstone with sandstone clasts. Anastamosing cleavage, highly fissile and also has lenticular sandstones within base. Highly weathered. | Irregular, normally-faulted upper contact. Flat lying base. Sandstone bed above infills topography. | Tabular |
| 4. Massive tabular sandstone | Fine sand | 0.01 to 0.5 m | 21% | 56 | Massive sandstones, erosive sole structures (grooves, flutes), occasionally loaded base, asymmetric rippled upper bedding plane. | Sharp, parallel sided. | Tabular |
| 5. Fining-upwards tabular sandstone | Fine sand | 0.04 to 0.09 m | 2% | 4 | Normally graded, grooved base, parallel laminae, wavy laminae at the top, contortion near top. | Sharp base, eroded top, loaded top, sharp top. | Tabular |
| 6. Massive lenticular sandstone | Fine sand | 0.04 to 0.5 m | 20% | 24 | Massive sandstone bed, sole structures (grooves, tool marks, flutes), ripples on top bedding plane, loaded bases, rounded mud clasts, convolution at the top, wavy lamination. | Sharp. | Lenticular. De-amalgamates over 10 m. |
| 7. Intensely folded sandstones and mudstones | Silt and fine sand | 20 m | N/A | 1 | Slump folds, faults, boudinage, shear zones, sand volcanoes. | Sharp. | Tabular |
Table 8.2.2. Summary table of lithofacies interpretations. Lithofacies are arranged into grain-size divisions.
| Lithofacies name | Interpreted Bouma divisions | Flow processes | Depositional element |
| 1. Undeformed tabular mudstone | Td, Tde, Tcd |
Dilute mud-rich turbidity currents. The presence of plant material implies proximity to a foliage-covered hinterland and suggests a direct link to river-flood effluent derived from hyperpycnal flows. Or alternatively plant material is far travelled out into the basin. |
Turbidite channel-to-lobe transition. |
| 2. Upward coarsening lenticular mudstone | Tdc, Tcd, Td, Te | Dilute turbidity currents, which pinch out laterally. Their lenticular geometry reflects flow size. | Turbidite channel-to-lobe transition. |
| 3. Deformed tabular mudstone | N/A Debrite | Debris flow deposits. The inclusion of sandstone rafts in the lower part of the bed indicates highly erosive flows that were able to erode and entrain the seafloor substrate, although the planar lower contact of debris flows suggests they were not erosional in the study area. Preservation of the irregular upper contact suggests that the succeeding sandstone was deposited a short time after debrite deposition. | Debrites. |
| 4. Massive tabular sandstone | Ta, Tac | Sandy turbidity currents that were erosive and deposited rapidly. Flows were unconfined. The absence of fining-upwards beds favours aggradation from a fast-moving steady flow, whereby the finer sediment fractions bypass downslope. | Turbidite channel-to-lobe transition. |
| 5. Fining upwards tabular sandstone | Tbc | Rapidly-decelerating unconfined sandy turbidity currents. | Turbidite channel-to-lobe transition. |
| 6. Massive lenticular sandstone | Ta, Tabac, Tac | Sandy turbidity currents, which were erosive leading to frequent amalgamation. Bed types suggest complex changes in flow velocities with time. | Turbidite channel-to-lobe transition. |
| 7. Intensely folded sandstones and mudstones | N/A Slump | Siliciclastic slump horizon that remobilized a heterolithic assemblage of interbedded turbidite sands and muds. | Slump. |
The 26 m thick stratigraphy at Fisherstreet Bay is divided into two units (Fig. 8.2.16) - the Fisherstreet Slump and the overlying non-slumped strata.
Fig. 8.2.16. Summary log showing entire interval at Fisherstreet, together with ratios of sand to mud and in situ beds to slumps.
Fisherstreet Slump
The Fisherstreet Slump (lithofacies 7, Tables 8.2.1 and 8.2.2) is described at Stops 2a (UTM 472317 m E, 5872015 m N; Map 51, 105213 m E, 194927 m N) and 2b (UTM 472442 m E, 5872218 m N; Map 51, 105340 m E, 195128 m N; Fig. 8.2.13). At location 2a, a series of recumbent cylindrical slump folds are sharply truncated by flat-lying lithofacies 1 to 6 (Tables 8.2.1 and 8.2.2; Fig. 8.2.14). Folds and faults are concentrated into discrete areas separated by intervening zones of relatively low strain. Folds are typically tight (0 to 30° interlimb angle) although a small number of gentle (120 to 180°) examples are observed. These more open folds may refold the earlier tight folds, suggesting local polyphase deformation (Fig. 8.2.13). Attitudes are characterised by recumbent and gently inclined folds (Figs 8.2.13 and 8.2.14), with a number of steeply inclined examples also being found within the uppermost part of the slump. The observed folds are rootless and display fold layer shapes ranging from class 1B (parallel) to class 2 (similar; Hudleston, 1973), have fold amplitudes ranging from 0.3 to 5 m and bed thicknesses that vary greatly from 0.005 to 4.1 m.
Examination of the recumbent folds at Stop 2a reveals a dominance of synformal structures with south-west closing fold hinges (Fig. 8.2.14). These folds are cylindrical and may be traced for up to 30 m (Fig. 8.2.13). Each fold is juxtaposed against a slump thrust fault that terminates at the top of the slump. The dominance of synformal folds without their antiformal pair implies that all antiformal folds have been thrust away from their synformal counterpart. The complete absence of antiformal structures further suggests that they have been removed via erosion from the upper part of the slump (Strachan, 2002a). The planar nature of the upper slump contact is spectacular (Figs 8.2.14A to 8.2.15). A thin sandstone horizon tops the slump, appears to have infilled the slump generated topography and is interpreted as a turbidite (Strachan & Alsop, 2006). Palaeocurrents from ripples on the upper bedding plane indicate a preferred south-westerly orientation of flow and are interpreted as reflected flows from the slump topography (Fig. 8.2.17). At the base of the cliff, spectacular sandstone volcanoes of 0.1 to 1 m in diameter can be viewed on the well-exposed bedding plane that marks the top of the slump (Fig. 8.2.18). Volcanoes are composed of very fine-grained sandstone that is lighter in colour than the surrounding strata. The volcano flank profiles may be convex or concave, with dips ranging from 1 to 19° (Gill & Kuenen, 1958), and the central craters are well-developed with preserved laminae on their flanks, suggesting long duration, unsteady, dewatering flows (Fig. 8.2.18). Sandstone volcanoes are positioned directly above slump faults and were formed via fluidization of sediments focused along slump faults, which acted as conduits (Gill & Kuenen, 1958; Strachan & Alsop, 2006). Development of sand volcanoes post-dates deposition of the thin ripple-topped sandstone upon which all sand volcanoes sit. This implies that dewatering occurred a short time after slump emplacement, with the trigger for dewatering being interpreted to be compaction and loading of the slump (Strachan, 2002b).
Fig. 8.2.17. Palaeocurrent measurements from strata overlying the Fisherstreet Slump grouped by type of sedimentary structure and relative location.
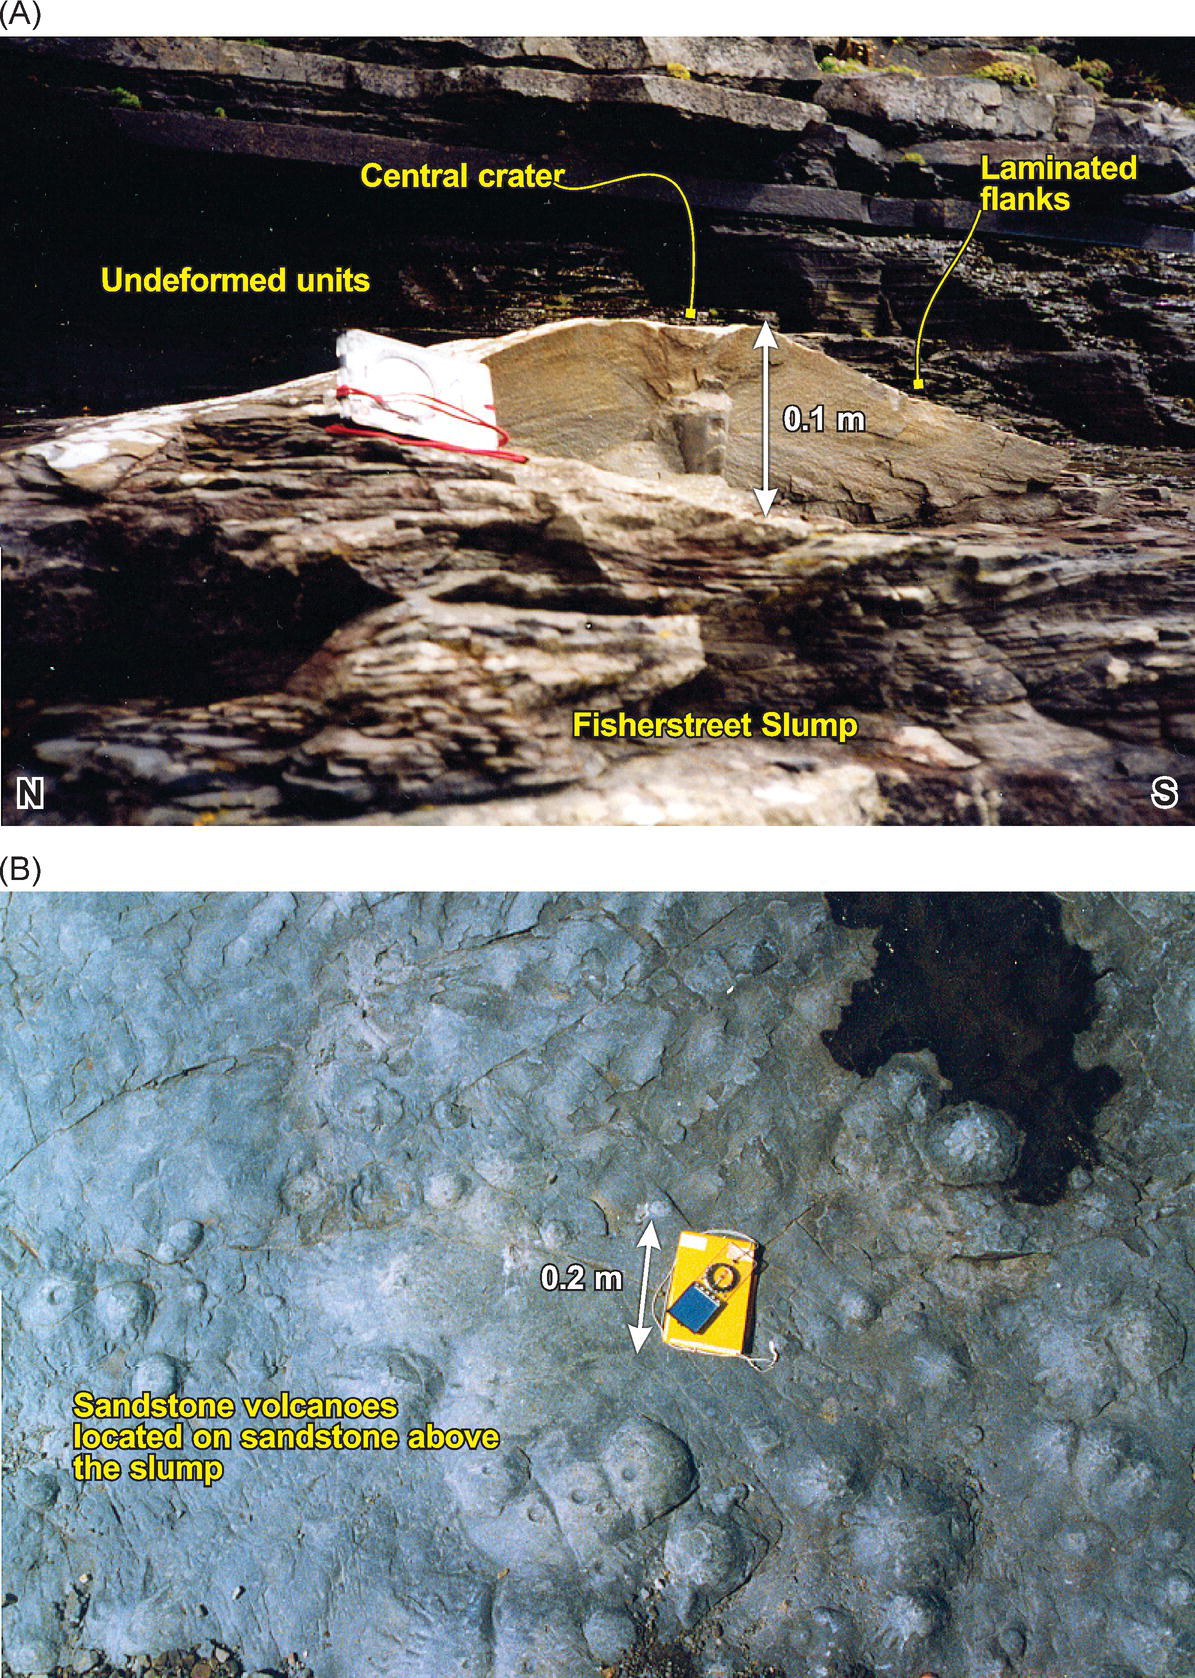
Fig. 8.2.18. Photographs showing the range of sand volcano types. A) Well-formed large isolated example with prominent central vent. B) Numerous small-scale sand volcanoes completely covering a bedding plane.
The section between locations 2a and 2b reveals an array of fold structures of varying size. Fold hinges are typically sub-horizontal, with trends varying from NW-SE and axial planes that fan about the associated fold axes, resulting in a weak girdle on stereonet plots (Fig. 8.2.13). Rare, gently curvilinear, fold hinge-lines are locally observed. Fold asymmetry varies along the exposure with two distinct NE-verging and SW-verging packages (Fig. 8.2.13). The north-east-verging folds predominate, with south-west-verging folds located close to location 2b (UTM 472442 m E, 5872218 m N; Map 51, 105340 m E, 195128 m N) where they directly overlay north-east-verging structures (cross-section A to B, Fig. 8.2.13). Fold hinge data along the entire outcrop exhibits a change in trend from NW-SE (sections A to B and C to D) to more N-S (section E-F, Fig. 8.2.13). This change in fold hinge orientation by ~ 35°, without a corresponding change in fold style, is most readily explained as lateral spreading at a frontal- or lateral- lobe within the toe region of the slump (Strachan & Alsop, 2006; their fig. 13). Such locally-divergent flow patterns suggest that constant transport directions should not automatically be assumed for slump sheets even when folds appear to display consistent geometries along the exposure (Fig. 8.2.13). The systematic use of slump transport determination techniques, as conducted by Strachan & Alsop (2006), reveals a mean downslope transport direction of 067° (Fig. 8.2.17). This direction supports the findings presented by both Collinson et al. (1991) and Wignall & Best (2000), but is contrary to those of Gill (1979) who interpreted a SE transport direction. Gill (1979) observed a distinct internal fabric at location 2b, that he interpreted as groove-like mullions formed parallel to flow. Fig. 8.2.14H shows these so-called grooves but it is apparent that this bed has been folded and not scoured and thus was formed by layer-parallel compression and not transport-parallel grooving.
Non-slumped strata
Five sedimentary logs from non-slumped units positioned above the Fisherstreet Slump reveal a heterogeneous assemblage of lithofacies (1 to 6, Figs 8.2.19 and 8.2.20) and lenticular sandstones that amalgamate and de-amalgamate over 10s of metres (Tables 8.2.1 and 8.2.2; Fig. 8.2.21). Lithofacies 1, 2 and 4 to 6 are interpreted to have been deposited by weakly confined to unconfined, dilute and concentrated turbidity currents that exhibit a range of temporal behaviours including waxing, waning and steady flows (Kneller, 1995; Table 8.1.1, Figs 8.2.19 and 8.2.20). The total thickness and number of beds varies at each logged site. Nevertheless, a consistent upward trend in lithofacies is observed, characterised by: 1. interbedded lithofacies 1 and 4, 0 to 1 m above the slump; 2. interbedded lithofacies 1 and 6, 1 to 2 m above the slump; and 3. a single, laterally extensive bed of lithofacies 3, 2 to 4 m above the slump (Tables 8.2.1 and 8.2.2). Sandstone beds reveal an array of thickening upward (TU) motifs and large shallow scours (1 to 2 m across, 0.2 m deep,) are observed on the base of several sandstone beds, which often truncate mudstones (Fig. 8.2.17). Erosive sole structures are well-exposed in the roof of a small cave positioned at Stop 2a (Figs 8.2.13 and 8.2.20), with grooves being the dominant form but flutes and prod marks are also present (Figs 8.2.17 and 8.2.20). The basal bedding planes exposed in the cave exhibit an exquisite array of structures and a range of palaeocurrent flow directions that display the scatter in flow directions of successive turbidity currents (Fig. 8.2.20).

Fig. 8.2.19. Sedimentary log of lithofacies type 7 – the Fisherstreet Slump, together with representative photographs showing the basal surface, folding and the upper surface.
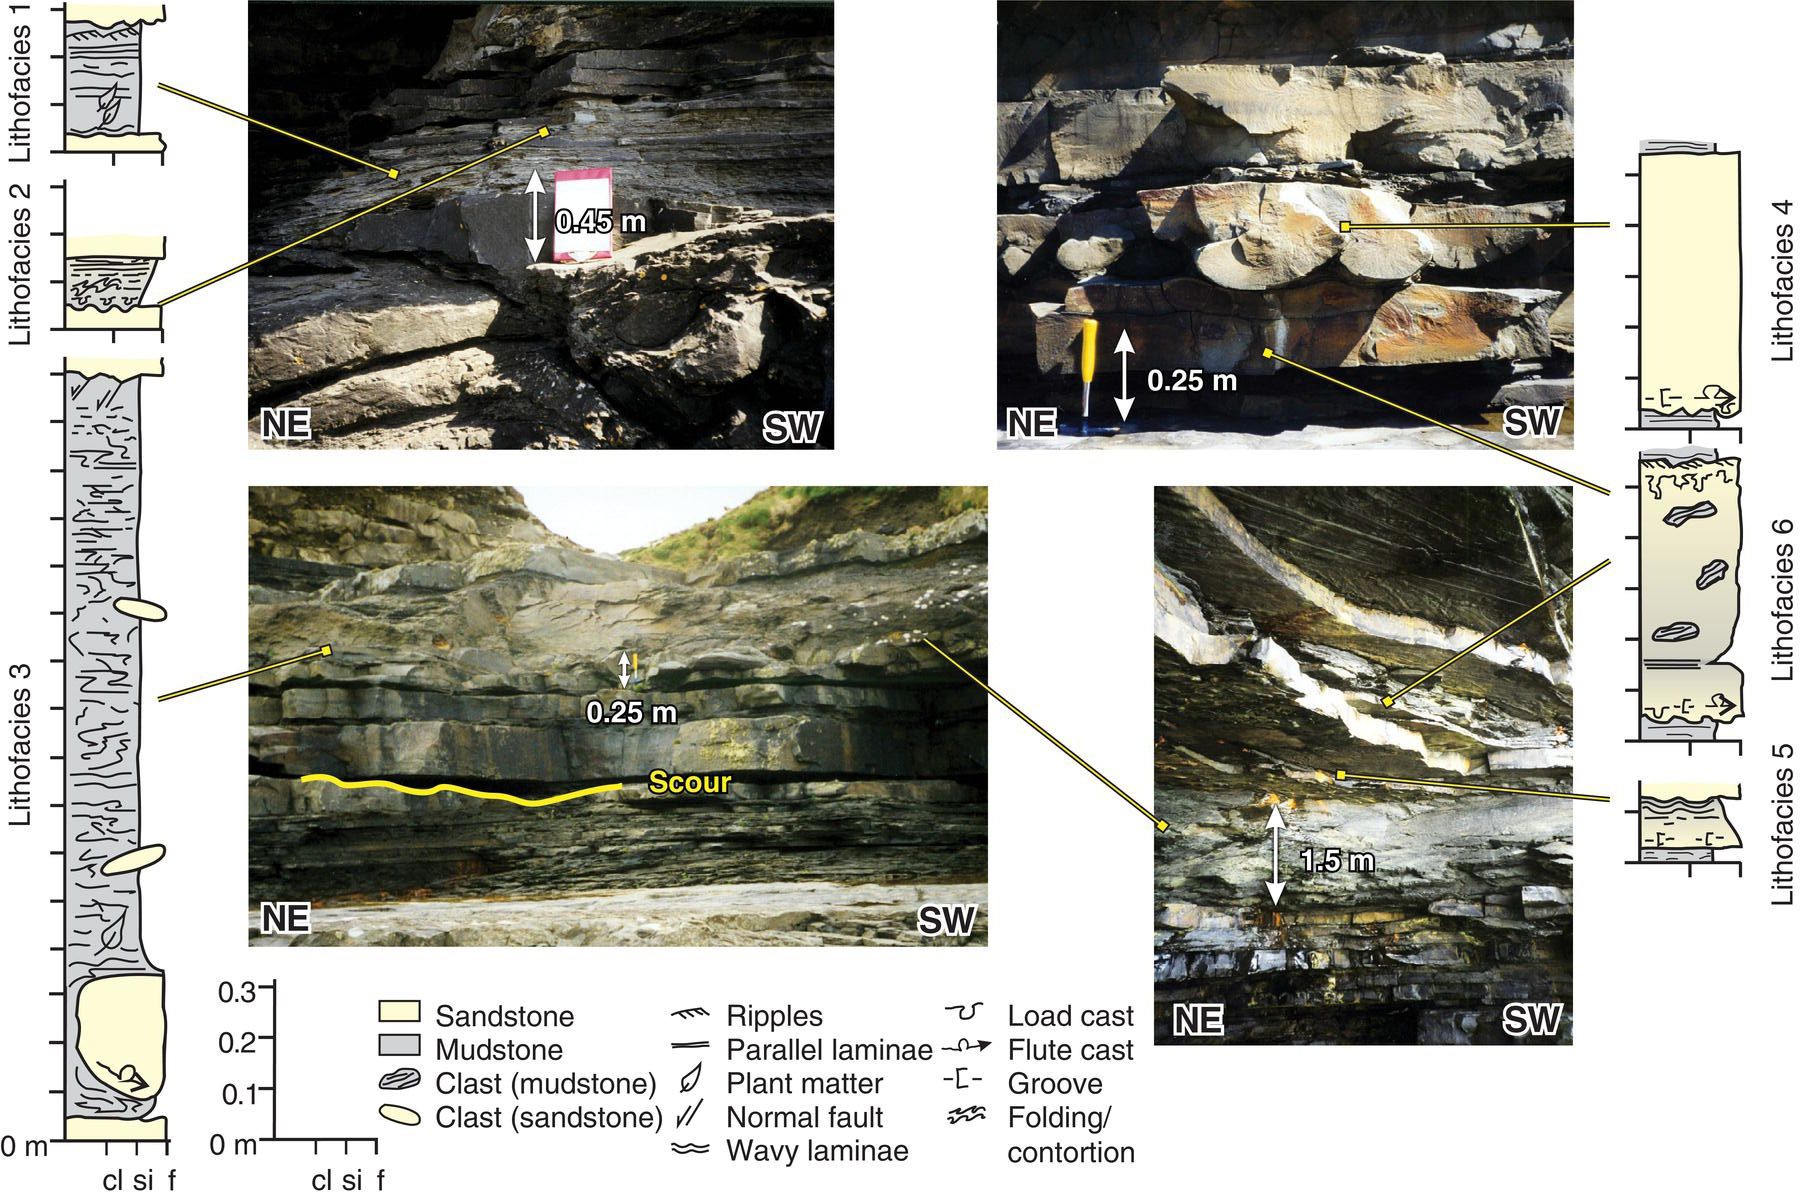
Fig. 8.2.20. Photographs and stratigraphic columns of lithofacies 1 to 6.
Fig. 8.2.21. Five measured sedimentary logs showing the vertical and lateral variation in strata above the Fisherstreet Slump. Location of logs is shown in the lower map.
Lateral correlation of beds shows that maximum bed thicknesses coincide with amalgamated beds (Fig. 8.2.22). Amalgamated beds typically have one thickened area, interpreted as the lobe or weakly confined channel axes, with beds thinning and pinching laterally. Bed aspect ratios are dominated by thin, wide beds generally less than 0.4 m thick and 0.9 to 2.6 km wide that are more typical of lobes (Fig. 8.2.22). Sedimentary log correlation reveals an irregular Fisherstreet Slump upper surface, characterised by a broad u-shaped conduit ~ 1 m deep and 2 km wide (Fig. 8.2.22). Overlying beds have compensationally infilled this topography, with thinner intervals positioned on relative highs (Fig. 8.2.22). Many lobe or channel apices are positioned close to log 3 (UTM 472683 m E, 5872381 m N; Map 51, 105584 m E, 195288 m N; Fig. 8.2.22), which was a site of preferential aggradation. The irregular slump surface is interpreted to result from significant erosion, which cut a broad, shallow conduit into the top of the slump. We speculate that a debris flow was the eroding agent that removed the upper parts of the Fisherstreet Slump, some of which may be preserved at the northern end of the outcrop, where a 3 m thick debrite (lithofacies 3) overlies the slump and is locally incorporated into it (Fig. 8.2.23). The fact that this unit is locally incorporated into the slump implies coeval formation with the Fisherstreet Slump and suggests that significant surface erosion and transformation occurred during translation (Fisher, 1983; Strachan, 2008; Fig. 8.2.23).
Fig. 8.2.22. Stratigraphic cross-section of the Fisherstreet Slump. Location of logs and cross-section is shown in Fig. 8.2.21. The plot above the cross-section documents the thicknesses and widths of lenticular, channelized, sandstone beds. Logs are aligned on the basal surface of the debrites.

Fig. 8.2.23. Annotated photographs (A and B) and field sketches (C and D) documenting the relationship between the Fisherstreet Slump and overlying debrites. Grey shading represents the debrites.
Palaeocurrent directions have been measured in sandstones (lithofacies 4 to 6) from flutes, grooves and ripple cross beds. Figure 8.2.17 shows a compilation of rose diagrams from Fisherstreet Bay, with groove casts being the dominant preserved structure revealing W-E trending flows. Flute casts reveal a polymodal distribution, with some transport towards the SE and WSW, with the statistical mean towards the ENE (Fig. 8.2.17). Only a small number of ripple cross-beds have been measured in the upper few centimetres of lithofacies 6 beds and reveal an oblique distribution with flows directed towards the NE, SW and WNW (Fig. 8.2.17). Flow directions from flute casts and cross-beds can vary within the same bed, for example flute casts on the base of a single bed suggest flow towards 093°, with overlying ripples implying a 235° flow direction. This suggests that such flows were deflected or reflected against the sea floor topography. Probable candidates for such barriers include local fault traces, slump topography and frontally-emergent slumps (Frey Martinez et al., 2006). Dominant ENE and E transport directions are interpreted as the principal flow direction (Fig. 8.2.17). Several other transport directions are present towards the WSW and SE and may imply: 1) unconfined flows that radiate from a central feeder; 2) that the turbidity currents were channelised and deposited within meandering thalwegs; and 3) that turbidity currents were deflected and reflected by sea floor topography. Based on field observations, the range of transport directions is attributed to radiating unconfined flows and flow deflection and reflection against sea floor topography.
The environment of deposition was prone to large-scale sediment failure and deposition of unconfined turbidites, with instability probably driven by high sedimentation rates. Sea floor topography on the Fisherstreet Slump had a profound influence on ensuing turbidity currents that were focussed and compensationally stacked upon the surface. Turbidity current flows were erosive and often bypassed the study area, although the local sea floor topography reflected some flows. The slope is inferred to have faced towards the ENE because the Fisherstreet Slump moved towards 067° (Strachan & Alsop, 2006) and because the majority of turbidity currents flowed in this direction. Sandstone turbidite bed thickness distributions reveal an exponential distribution (Fig. 8.2.24), which are thought to be typical of proximal base-of-slope settings (Sinclair & Cowie, 2003). Based on all available data, we suggest the environment of deposition to be a submarine slope or base of slope of either the Shannon Basin or a local sub-basin. Non-slumped units were deposited in a proximal lobe position close to a channel-lobe transition. We suggest that the lobe location was relatively proximal (e.g. crevasse splay) given evidence of slope collapse and sediment bypass. Water depths are not known, but there is as an absence of storm-wave generated bedforms.

Fig. 8.2.24. Plots showing: A) spatial changes in percentage sandstone; B) spatial changes in bed amalgamation index; C) frequency histogram of bed thickness; and D to F) cumulative frequency of bed thickness. Location of logs is shown in Fig. 8.2.21.
Transfer to Stop 3
From Fisherstreet, drive back to the R478 and head south-west to park at the Cliffs of Moher visitor centre (UTM 471134 m E, 5869244 m N; Map 51, 103990 m E, 192171 m N). Walk to the cliffs and follow the footpath northwards, 300 m past O’Brien’s Tower towards Knockardakin (Fig. 8.2.25). By looking south at this location, visitors are able to view the outcrops below. Gull Island Formation sediments are exposed in the bottom half of the ~ 180 m high cliff. The outcrop is dominated by shear vertical cliffs that are partially covered in rock fall. Take care. This stop takes 2 hours to complete.

Fig. 8.2.25. Map of Stop 3, Cliffs of Moher and schematic composite stratigraphic column of the Gull Island Formation and Tullig cyclothem at Stops 2 and 3. The Cliffs of Moher portion of the log is redrawn from previous descriptions (Hodson, 1954a; Collinson et al., 1991; Wignall & Best, 2000). White arrow on inset photograph points to a channel in the Gull Island Formation.
Photograph courtesy of Paul Wignall.
Stop 3: Cliffs of Moher (UTM 471134 m E, 5869244 m N; Map 51, 103990 m E, 192171 m N)
Several authors document the Gull Island Formation at the Cliffs of Moher (Hodson, 1954a; Martinsen et al., 2000; Wignall & Best, 2000, 2004) and this data is used herein to describe the interval. The exposed Gull Island Formation is ~ 100 m thick (Martinsen et al., 2000; Wignall & Best, 2000; Martinsen et al., 2003; Wignall & Best, 2004) that, when added to the Fisherstreet Bay section, produces a total north Co. Clare Gull Island Formation thickness of c. 130 to 150 m (Rider, 1974; Gill, 1979; Martinsen et al., 2000; Wignall & Best, 2000).
The exposed stratigraphic interval at the Cliffs of Moher is younger than at Fisherstreet, containing younger strata from within the R1b2- R1b3 bio-stratigraphic cycle (Hodson & Lewarne, 1961; Figs 8.1.4 and 8.1.5). Marine band R1b3 has been identified within a ~ 7 m thick black marine shale (Fig. 8.2.25) located in the highest part of the cliff, some 100 m above the Gull Island Formation (Hodson, 1954a). The top of the Gull Island Formation is placed at the base of a distinct coarsening-upwards trend that marks the transition to deltaic Tullig Cyclothem sediments (Gill, 1979; Chapter 10.2, Stops 2 and 3).
Gull Island Formation sediments contain abundant undeformed tabular silty mudstones with thin sandstone beds (Hodson, 1954a; Gill, 1979; Martinsen et al., 2000; Wignall & Best, 2000; Fig. 8.2.25). Within these units, an 8 to 15 m thick, 200 m wide lenticular sandstone unit is observed (Martinsen et al. 2000; Wignall & Best, 2000; Martinsen et al., 2003). Internally, the lenticular unit is composed of several turbidite sandstone beds that are speculated to be structureless with laminated tops (Martinsen et al., 2000). Laterally, these sandstone beds amalgamate and de-amalgamate (Martinsen et al., 2000; Wignall & Best, 2000; Martinsen et al., 2003). Martinsen et al., (2003) report that these turbidites flowed towards the east, although it is unclear how this direction was acquired given the precipitous and inaccessible nature of the outcrop. An upper extensive sheet sandstone extends out across lower lenticular sandstones (Martinsen et al., 2003). The undeformed tabular silty mudstones with thin sandstone beds fine upwards to black shales (Hodson, 1954a; Fig. 8.2.25). Rare plant matter has been found within fallen blocks of black shale at Carrickatrial and includes Calamites sp. and Mariopteris muricata (Hodson, 1954a).
The silty mudstone character of these Gull Island Formation sediments is interpreted to have resulted from hemipelagic deposition punctuated by rare turbidity currents that scoured slope channels transporting coarser grained sediment further downslope (Wignall & Best, 2000; Fig. 8.2.25). The overlying black shale part of the interval has not been described since the detailed biostratigraphic study of Hodson (1954a). The omission of this interval from more recent descriptions is unclear (for example, Collinson et al., 1991; Wignall & Best, 2000; Martinsen et al., 2003) but may be because some of the cliff has been obscured by rock fall.
Few deformation structures are reported and as a consequence slumping and sliding are thought to be minimal at this locality (Hodson, 1954a; Gill, 1979; Collinson et al., 1991; Wignall & Best, 2000; Martinsen et al., 2003; Fig. 8.2.25). The lack of soft-sediment deformation has been attributed to relatively low sedimentation rates (Collinson et al., 1991) and/or a basin floor location (Wignall & Best, 2000).
Several environmental models have been proposed to explain the North Co. Clare Gull Island Formation. In a summation of his regional observations, Rider (1974) suggested that these sediments represent a shelf and unstable continental slope, with north-eastward progradation of an overlying delta with time. In a reinterpretation of Rider’s (1974) work, Collinson et al. (1991) suggested that these sediments were deposited in a pro-delta or slope setting linked to south-east progradation of a genetically linked (Tullig) delta. The apparent absence of turbidites was explained by ubiquitous sediment bypass, which delivered coarser-grained material further downslope via isolated erosive channels. Thus, this location was envisaged to be a relatively inactive northern slope or basin margin to a prograding delta, dominated by low sedimentation rates (Collinson et al., 1991; Martinsen et al., 2000). Martinsen et al. (2003) further suggested that northern Co. Clare only became a site of active deposition after southern and central Gull Island Formation accommodation space had become filled. Wignall & Best (2000) similarly envisaged low sediment flux at this location, attributing this to a distal basin floor position rather than an inactive slope. In their model, Wignall & Best (2000) interpreted the Gull Island Formation as representing slope progradation towards and down a NE-dipping slope.
The inaccessibility of the Gull Island Formation outcrops at the Cliffs of Moher has prevented detailed sedimentological quantification and has led to some observational inconsistencies and differences in interpretation. In addition, recent workers have discarded the biostratigraphic work of Hodson (1954a) and Hodson & Lewarne (1961), who identified marine band R1b2 (R. nodosum) beneath the Fisherstreet Slump. The omission of this biostratigraphic marker in later studies is significant because sedimentation rates were tentatively estimated. By resurrecting the original north Co. Clare biostratigraphic work of Hodson (1954a) and Hodson & Lewarne (1961), who described ~ 291 m of strata between marine bands R1b2 and R1b3, an extraordinary average sedimentation rate of ~ 4.48 m kyr-1 is calculated (Fig. 8.1.9) that is not in accord with the low rates inferred by Martinsen et al. (2000). Although this is an average sedimentation rate for both the Gull Island Formation and Tullig Cyclothem, we suggest that equally high rates persisted for part of the Gull Island Formation depositional period. This necessitates a reinterpretation of the mode of deposition for the undeformed tabular silty mudstones and thin sandstone beds, which we speculate were the products of unconfined turbidity currents. These formative flows were deposited as turbidite lobes or as turbidite channel levee deposits, adjacent to small erosive channels on a submarine slope whereby finer grained sediments were sourced from higher in the flow. The erosive turbidite channel unit preserves evidence of infrequent small confined channelized flows (Rider, 1974; Collinson et al., 1991; Martinsen et al., 2000; Wignall & Best, 2000; Martinsen et al., 2003). The aspect ratio of these lenticular sandstones is similar to the Ross Sandstone Formation (Fig. 8.2.25).
There is also some disagreement in the literature relating to the vertical succession of lithofacies types at the Cliffs of Moher. Hodson (1954a) reported that silty mudstones and thin sandstone beds fine upwards to significant black shales (~ 80 m thick), while subsequent workers described a coarsening-upwards motif (Rider, 1974; Collinson et al., 1991; Martinsen et al., 2000; Wignall & Best, 2000; Martinsen et al., 2003). Today the ~ 80 m of black shale is not visible but for completeness we cautiously include the black shale interval of Hodson (1954a) and also note that coarsening-upwards demarcates the base of the Tullig Cyclothem here (Fig. 8.2.25).
Due to the precipitous nature of the Cliffs of Moher, a number of observational and interpretative questions remain. Nevertheless, an alternate model for the environment of deposition is offered, based on all available published data. Here, we suggest that the Gull Island Formation in the lower part of the Cliffs of Moher records an interval of rapid deposition via unconfined turbidity currents on a submarine slope or basin floor. Here, despite the high rates of deposition, low slope gradients prevented slope failure in the Gull Island Formation. The central part of the Cliffs of Moher is composed of the Tullig Cyclothem that is described in Chapter 10.2, Stops 2 and 3.
Northern County Clare summary
The outcrops exposed at Fisherstreet and the Cliffs of Moher reveal a series of slumps and turbidites deposited in submarine slope and base of slope environments, with extremely high aggradation rates (~ 4.48 m kyr−1). We consider the northern region of Co. Clare became an active depocentre after R1b2 times and therefore is one of the youngest sites of deposition in the Gull Island Formation. Sedimentation was initially dominated by slumping and instability, followed by turbidity currents that were not remobilized. Overall the degree of deformation is much lower than in southern Co. Clare.
8.3 Synthesis
The review and field excursions described herein document the range of superb Gull Island Formation outcrops from northern and southern Co. Clare and has unearthed some ‘lost’ data that has enabled refinement of our understanding of the Formation. The base of the Gull Island Formation is a diachronous boundary between the coeval Ross Sandstone and Clare Shales, which was initiated in the SW and migrated north and east with time. The Gull Island Formation is defined on lithostratigraphic grounds characterised by ubiquitous slumping, with the high proportion of slumps being interpreted as a response to high sedimentation rates. In our view, the spatial distribution of sediment thicknesses records complex and rapidly evolving basin geometry, with sedimentation rates suggesting more than one active depocentre at a time.