Joseph I. Goldstein, Dale E. Newbury, Joseph R. Michael, Nicholas W.M. Ritchie, John Henry J. Scott and David C. JoyScanning Electron Microscopy and X-Ray Microanalysishttps://doi.org/10.1007/978-1-4939-6676-9_12
12. Variable Pressure Scanning Electron Microscopy (VPSEM)
Joseph I. Goldstein1, Dale E. Newbury2, Joseph R. Michael3, Nicholas W. M. Ritchie2, John Henry J. Scott2 and David C. Joy4
(1)
University of Massachusetts, Amherst, Massachusetts, USA
(2)
National Institute of Standards and Technology, Gaithersburg, Maryland, USA
(3)
Sandia National Laboratories, Albuquerque, New Mexico, USA
(4)
University of Tennessee, Knoxville, Tennessee, USA
12.1 Review: The Conventional SEM High Vacuum Environment
The conventional SEM must operate with a pressure in the sample chamber below ~10−4 Pa (~10−6 torr), a condition determined by the need to satisfy four key instrumental operating conditions:
12.1.1 Stable Electron Source Operation
The pressure in the electron gun must be maintained below 10−4 Pa (~10−6 torr) for stable operation of a conventional thermal emission tungsten filament and below 10−7 Pa (~10−9 torr) for a thermally assisted field emission source. Although a separate pumping system is typically devoted to the electron source to maintain the proper vacuum, if the specimen chamber pressure in a conventional SEM is allowed to rise, gas molecules will diffuse to the gun, raising the pressure and causing unstable operation and early failure.
12.1.2 Maintaining Beam Integrity
An electron emitted from the source that encounters a gas atom along the path to the specimen will scatter elastically, changing the trajectory and causing the electron to deviate out of the focused beam. To preserve the integrity of the beam, the column and chamber pressure must be reduced to the point that the number of collisions between the beam electrons and the residual gas molecules is negligible along the entire path, which typically extends to 25 cm or more.
12.1.3 Stable Operation of the Everhart–Thornley Secondary Electron Detector
To serve as a detector for secondary electrons, the Everhart–Thornley secondary electron detector must be operated with a bias of +10,000 volts or more applied to the face of the scintillator to accelerate the SE and raise their kinetic energy sufficiently to cause light emission. If the chamber pressure exceeds approximately 100 mPa (~10−3 torr), electrical discharge events will begin to occur due to gas ionization between the scintillator (+10,000 V) and the Faraday cage (+250 V), which is located in close proximity, initially increasing the noise and thus degrading the signal-to-noise ratio. As the chamber pressure is further increased, electrical arcing will eventually cause total operational failure.
12.1.4 Minimizing Contamination
A major source of specimen contamination during examination arises from the cracking of hydrocarbons by the electron beam. A critical factor in determining contamination rates is the availability of hydrocarbon molecules for the beam electrons to hit. To achieve a low contamination environment, the pumping system must be capable of achieving low ultimate operating pressures. A specimen exchange airlock can pump off most volatiles, minimizing the exposure of the specimen chamber, and the airlock can be augmented with a plasma cleaning system to actively destroy volatiles. Finally, the vacuum system can be augmented with careful cold surface trapping of any remaining volatiles from the specimen or those that can backstream from the pump so as to minimize the partial pressure of hydrocarbons. Most importantly, to avoid introducing unnecessary sources of contamination, the microscopist must be very careful in handling instrument parts and specimens to avoid inadvertently depositing highly volatile hydrocarbons, such as those associated with skin oils deposited in fingerprints, into the conventional SEM. With this level of operational care when operating in a well maintained modern instrument, beam-induced contamination when observed almost always results from residual hydrocarbons on the specimen which remain from incomplete cleaning rather than from hydrocarbons from the vacuum system itself.
A significant price is paid to operate the SEM with such a “clean” high vacuum. The specimen must be prepared in a condition so as not to evolve gases in the vacuum environment. Many important materials, such as biological tissues, contain liquid water, which will rapidly evaporate at reduced pressure, distorting the microscopic details of a specimen and disturbing the stable operating conditions of the microscope. This water, and any other volatile substances, must be removed during sample preparation to examine the specimen in a “dry” state, or the water must be immobilized by freezing to low temperatures (“frozen, hydrated samples”). Such specimen preparation is both time-consuming and prone to introducing artifacts, including the redistribution of “diffusible” elements, such as the alkali ions of salts.
12.2 How Does VPSEM Differ From the Conventional SEM Vacuum Environment?
The development of the variable pressure scanning electron microscope (VPSEM) has enabled operation with elevated specimen chamber pressures in the range ~1–2500 Pa (~0.01–20 torr) while still maintaining a high level of SEM imaging performance (Danilatos 1988, 1991). The VPSEM utilizes “differential pumping” with several stages to obtain the desired elevated pressure in the specimen chamber while simultaneously maintaining a satisfactory pressure for stable operation of the electron gun and protection of the beam electrons from encountering elevated gas pressure along most of the flight path down the column. Differential pumping consists of establishing a series of regions of successively lower pressure, with each region separated by small apertures from the regions on either side and each region having its own dedicated pumping path. The probability of gas molecules moving from one region to the next is limited by the area of the aperture. In the VPSEM, these differential pumping apertures also serve as the beam-defining apertures. A typical vacuum design consists of separate pumping systems for the specimen chamber, one region for each lens, and finally the electron gun. Such a vacuum system can maintain a pressure differential of six orders of magnitude or more between the specimen chamber and the electron gun, enabling use of both conventional thermionic sources and thermally-assisted field emission sources. A wide variety of gases can be used in the elevated pressure sample chamber, including oxygen, nitrogen, argon, and water vapor. Because the imaging conditions are extremely sensitive to the sample chamber pressure, careful regulation of the pressure and of its stability for extended periods is required.
12.3 Benefits of Scanning Electron Microscopy at Elevated Pressures
There are several special benefits to performing scanning electron microscopy at elevated pressures.
12.3.1 Control of Specimen Charging
Insulating materials suffer charging in the conventional high vacuum SEM because the high resistivity of the specimen prevents the migration of the charges injected by the beam, as partially offset by charges that leave the specimen as backscattered and secondary electrons, to reach an electrical ground. Consequently, there develops a local accumulation of charge. Depending on the beam energy, the material properties, and the local inclination of the specimen to the beam, negative or positive charging can occur. Charging phenomena can be manifest in many ways in SEM images, ranging at the threshold from diminished collection of secondary electrons which reduces the signal-to-noise ratio to more extreme effects where the local charge accumulation is high enough to cause actual displacement of the position of the beam, often seen as discontinuities in the scanned image. In the most extreme cases, the charge may be sufficient for the specimen to act as a mirror and deflect the beam entirely. In conventional SEM operation, charging is typically eliminated or at least minimized by applying a thin conducting coating to an insulating specimen and connecting the coating layer to electrical ground.
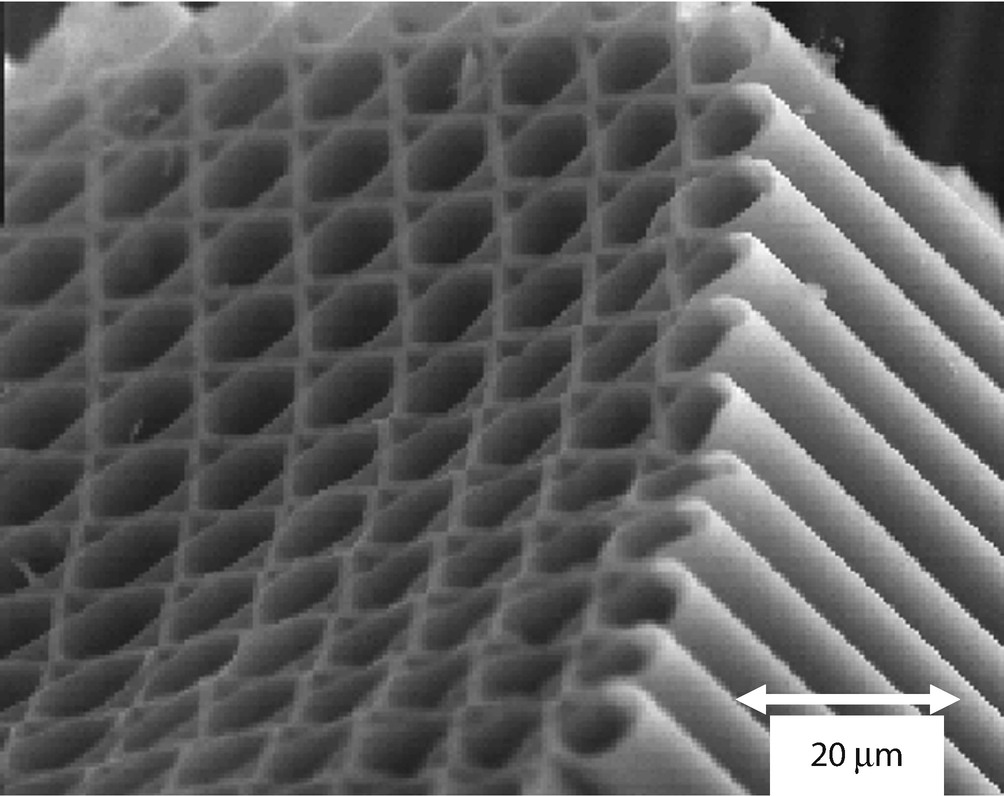
In the VPSEM, incident beam electrons, BSE and SE can scatter inelastically with gas atoms near the specimen, ionizing those gas atoms to create free low kinetic energy electrons and positive ions. Areas of an insulating specimen that charge will attract the appropriate oppositely charged species from this charge cloud, the positively ionized gas atoms or the free electrons, leading to local dynamic charge neutralization, enabling insulating materials to be examined without a coating. Moreover, the environmental gas, the ionized gas atoms, and the free electrons can penetrate into complex geometric features such as deep holes, features which would be very difficult to coat to establish a conducting path for conventional high vacuum SEM. An example of VPSEM imaging of a very complex insulating object is shown in ◘ Fig. 12.1, which is an array of glass microcapillaries examined without any coating. No charging is observed in this secondary electron VPSEM image with E0 = 20 keV (prepared with a gaseous secondary electron detector, as described below) despite the very deep recesses in the structure. Another example is shown in ◘ Fig. 12.2a, which shows a comparison of images of a complex polymer foam imaged in high vacuum SEM at a low beam energy of E0 = 4 keV with an Everhart–Thornley (E–T) detector, showing the development of charging, and in VPSEM mode with E0 = 20 keV and an off-axis backscattered electron (BSE) detector, showing no charging effects. A challenging insulating sample with a complex surface is shown in ◘ Fig. 12.2b, which depicts fresh popcorn imaged under VPSEM conditions with a BSE detector.
Fig. 12.1
Uncoated glass polycapillary as imaged in a VPSEM (conditions: 20 keV; 500 Pa water vapor; gaseous secondary electron detector)
Fig. 12.2
a Uncoated polymer foam imaged (left) with high vacuum SEM, E0 = 4 keV, E-T(+) detector (bar = 200 µm); and (right) VPSEM, E0 = 20 keV, off-axis BSE detector (bar = 500 µm) (Images courtesy J. Mershan, TESCAN). b (left and right) Uncoated freshly popped popcorn imaged with VPSEM, E0 = 20 keV, BSE detector; 60 Pa N2 (left, bar = 500 µm) (right, bar = 50 µm) (Images courtesy J. Mershon, TESCAN; sample source: Lehigh Microscopy School)
Achieving suppression of charging for such complex insulating objects as those shown in ◘ Figs. 12.1 and 12.2 involves careful control of the usual parameters of beam energy, beam current, and specimen tilt. In VPSEM operation the additional critical variables of environmental gas species and partial pressure must be carefully explored. Additionally, the special detectors for SE that have been developed for VPSEM operation can also play a role in charge suppression.
12.3.2 Controlling the Water Environment of a Specimen
Careful control and preservation of the water content of a specimen can be critical to recording SEM images that are free from artifacts or suffer only minimal artifacts. Additionally, when there is control of the partial pressure of water vapor in the specimen chamber to maintain liquid water in equilibrium with the gas phase, it becomes possible to observe chemical reactions that are mediated by water.
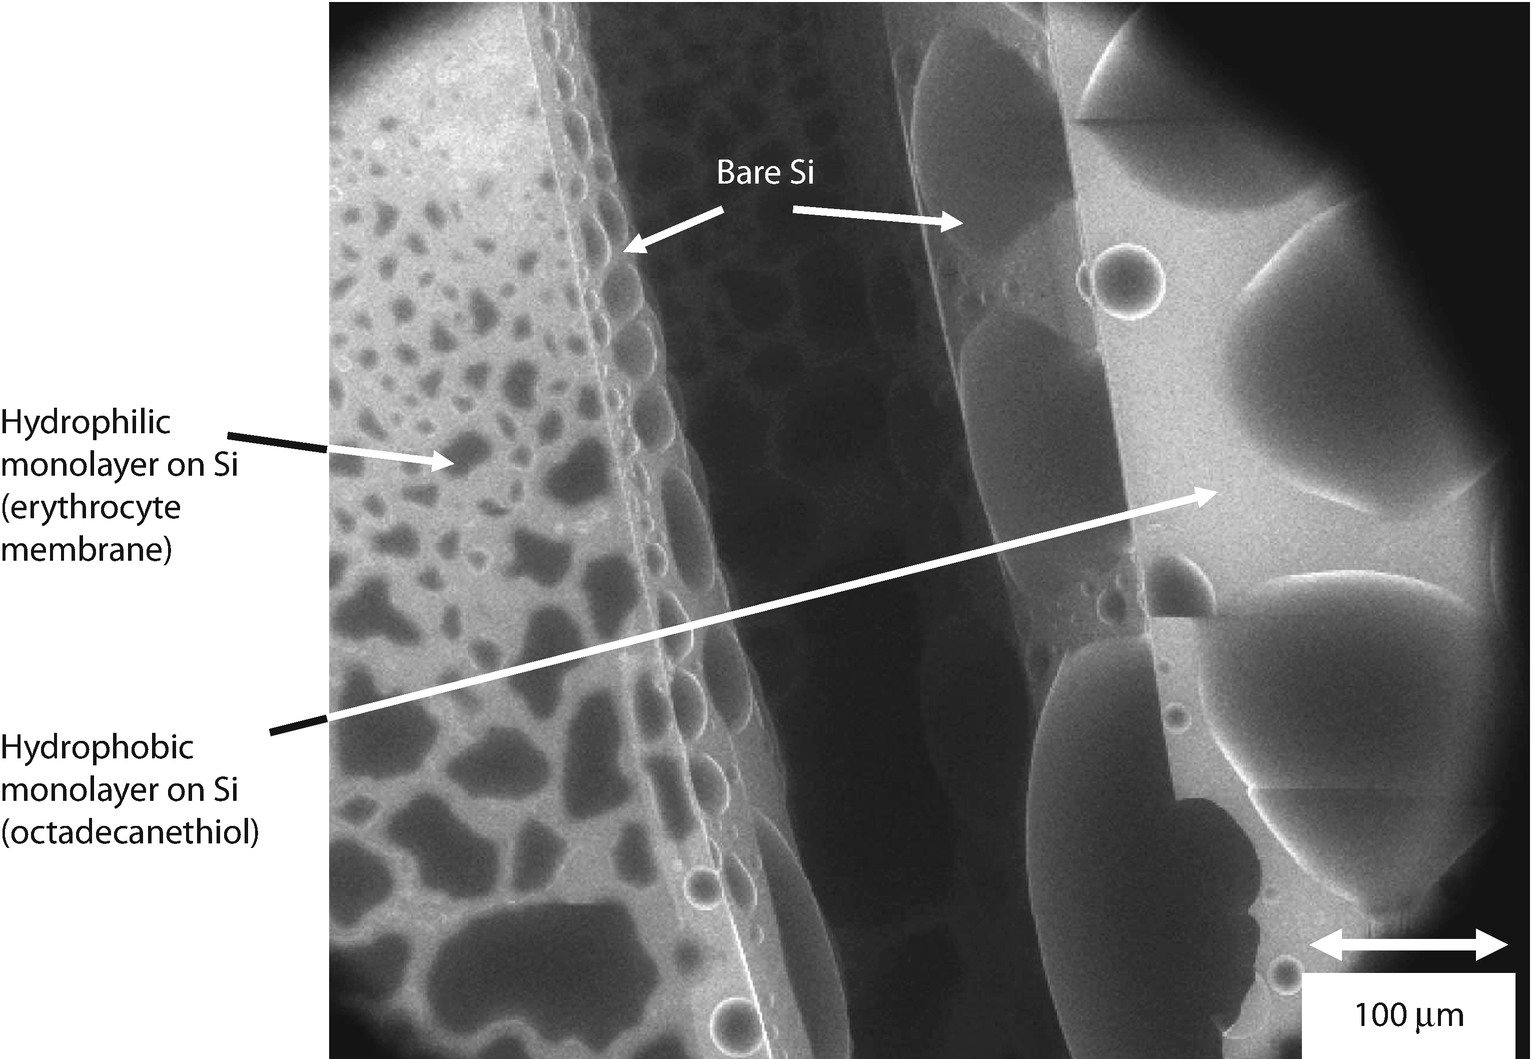
By monitoring and controlling the relative humidity, it is possible to add water by condensation or remove it by evaporation. ◘ Figure 12.3 shows the pressure–temperature phase diagram for water. The pressure–temperature conditions to maintain liquid water, ice, and water vapor in equilibrium can be achieved at the upper end of the operating pressure range of certain VPSEMs when augmented with a cooling stage capable of reaching −5 °C to 5 °C. With careful control of both the pressure of water vapor added to the specimen chamber and of the specimen temperature, the microscopist can select the relative humidity in the sample chamber so that water can be evaporated, condensed, or maintained in liquid–gas or solid-gas equilibrium. In addition to direct examination of water-containing specimens, experiments can be performed in which the presence and quantity amount of water is controlled as a variable, enabling a wide range of chemical reactions to be observed. ◘ Figure 12.4 shows an example of the condensation of water on a silicon wafer, one side of which was covered with a hydrophobic layer while the other was coated with a hydrophilic layer, directly revealing the differences in the wetting behavior on the two applied layers, as well as the bare silicon exposed by fracturing the specimen.
Fig. 12.3
Phase diagram for water
Fig. 12.4
VPSEM imaging of water condensed in situ on silicon treated with a hydrophobic layer (octadecanethiol), a hydrophilic layer (erythrocyte membrane), and bare, uncoated silicon (nearly vertical fracture surfaces) (Example courtesy Scott Wight, NIST)
12.4 Gas Scattering Modification of the Focused Electron Beam
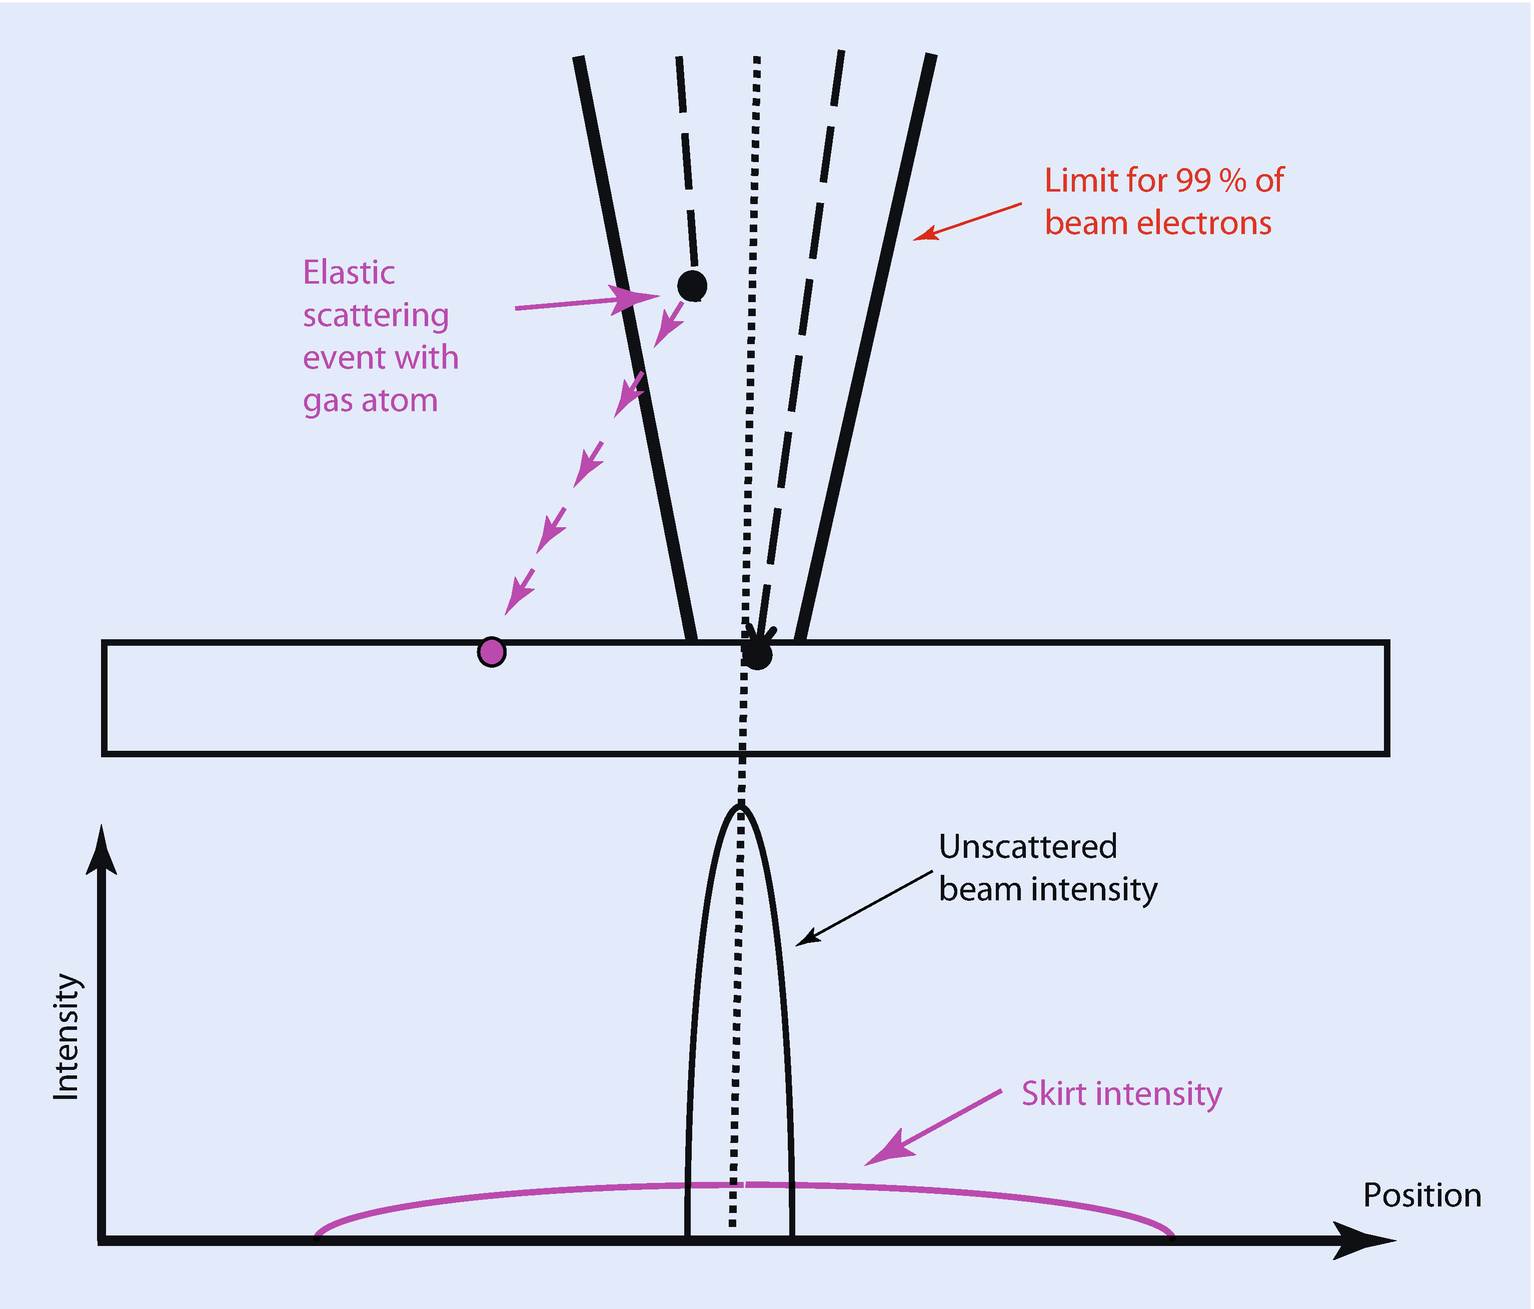
The differential pumping system achieves vacuum levels that minimize gas scattering and preserve the beam integrity as it passes from the electron source through the electron-optical column. As the beam emerges from the high vacuum of the electron column through the final aperture into the elevated pressure of the specimen chamber, the volume density of gas atoms rapidly increases, and with it the probability that elastic scattering events with the gas atoms will occur. Although the volume density of the gas atoms in the chamber is very low compared to the density of a solid material, the path length that the beam electrons must travel in the elevated pressure region of the sample chamber typically ranges from 1 mm to 10 mm or more before reaching the specimen surface. As illustrated schematically in ◘ Fig. 12.5, elastic scattering events that occur with the gas molecules along this path cause beam electrons to substantially deviate out of the focused beam to create a “skirt”. Even a small angle elastic event with a 1-degree scattering angle that occurs 1 mm above the specimen surface will cause the beam electron to be displaced by 17 μm radially from the focused beam.
Fig. 12.5
Schematic diagram showing gas scattering leading to development of the skirt surrounding the unscattered beam at the specimen surface
How large is the gas-scattering skirt? The extent of the beam skirt can be estimated from the ideal gas law (the density of particles at a pressure p is given by n/V = p/RT, where n is the number of moles, V is the volume, R is the gas constant, and T is the temperature) and by using the cross section for elastic scattering for a single event (Danilatos 1988):
(12.1)
where Rs = skirt radius (m)
Z = atomic number of the gas
E = beam energy (keV)
p = pressure (Pa)
T = temperature (K)
L = Gas Path Length (GPL) (m)
◘ Figure 12.6 plots the skirt radius for a beam energy of 20 keV as a function of the gas path length through oxygen at several different chamber pressures. For a pressure of 100 Pa and a gas path length of 5 mm, the skirt radius is calculated to be 30 μm. Consider the change in scale from the focused beam to the skirt that results from gas scattering. The high vacuum beam footprint that gives the lateral extent of the BSE, SE, and X-ray production can be estimated with the Kanaya–Okayama range equation. For a copper specimen and E0 = 20 keV, the full range RK-O = 1.5 μm, which is also a good estimate of the diameter of the interaction volume projected on the entrance surface. With a beam/interaction volume footprint radius of 0.75 μm, the gas scattering skirt of 30-μm radius is thus a factor of 40 larger in linear dimension, and the skirt is a factor of 1600 larger in area than that due the focused beam and beam specimen interactions. Considering just a 10-nm incident beam diameter (5-nm radius), the gas scattering skirt is 6000 times larger.
Fig. 12.6
Development of beam skirt for 20-keV electrons passing through oxygen at various pressures as calculated with Eq. 12.1
While Eq. 12.1 is useful to estimate the extent of the gas scattering skirt under VPSEM conditions, it provides no information on the relative fraction of the beam that remains unscattered or on the distribution of gas-scattered electrons within the skirt. The Monte Carlo simulation embedded in NIST DTSA-II enables explicit treatment of gas scattering to provide detailed information on the unscattered beam electrons as well as the spatial distribution of electrons scattered into the skirt. The VPSEM menu of DTSA-II allows selection of the critical variables: the gas path length, the gas pressure, and the gas species (He, N2, O2, H2O, or Ar). ◘ Table 12.1 gives an example of the Monte Carlo output for the electron scattering out of the beam for a 5-mm gas path length through 100 Pa of water vapor. In addition to the radial distribution, the DTSA II Monte Carlo reports the unscattered fraction that remains in the focused beam, a value that is critical for estimating the likely success of VPSEM imaging, as described below.
Table 12.1
NIST DTSA-II Monte Carlo simulation for 20-keV electrons passing through 5 mm of water vapor at 100 Pa
Ring
Inner Radius, μm
Outer radius, μm
Ring area, μm2
Electron count
Electron fraction
Cumulative (%)
Undeflected
—
—
—
42,279
0.661
—
1
0.0
2.5
19.6
46,789
0.731
73.1
2
2.5
5.0
58.9
2431
0.038
76.9
3
5.0
7.5
98.2
1457
0.023
79.2
4
7.5
10.0
137.4
1081
0.017
80.9
5
10.0
12.5
176.7
834
0.013
82.2
6
12.5
15.0
216.0
730
0.011
83.3
7
15.0
17.5
255.3
589
0.009
84.2
8
17.5
20.0
294.5
554
0.009
85.1
9
20.0
22.5
333.8
490
0.008
85.9
10
22.5
25.0
373.1
393
0.006
86.5
11
25.0
27.5
412.3
395
0.006
87.1
12
27.5
30.0
451.6
341
0.005
87.6
13
30.0
32.5
490.9
271
0.004
88.1
14
32.5
35.0
530.1
309
0.005
88.5
15
35.0
37.5
569.4
274
0.004
89.0
16
37.5
40.0
608.7
248
0.004
89.4
17
40.0
42.5
648.0
224
0.004
89.7
18
42.5
45.0
687.2
217
0.003
90.0
19
45.0
47.5
726.5
204
0.003
90.4
20
47.5
50.0
765.8
191
0.003
90.7
◘ Figure 12.7a plots the gas scattering predicted by the Monte Carlo simulation for a gas path length of 5 mm and 100 Pa of O2, presented as the cumulative electron intensity as a function of radial distance out to 50 μm from the beam center. For these conditions the unscattered beam retains about 0.70 of the beam intensity that enters the specimen chamber. The skirt out to a radius of 30 μm contains a cumulative intensity of 0.84 of the incident beam current. To capture 0.95 of the total beam current requires a radial distance to approximately 190 μm, as shown in ◘ Fig. 12.7b, and the last 0.05 of the beam electrons are distributed out to 1000 μm (1 mm). The strong effect of the gas path length on the skirt radius, which follows a 3/2 exponent in the scattering Eq. 12.1, can be seen in ◘ Fig. 12.7 by comparing the plots for 3-, 5-, and 10-mm gas path lengths.
Fig. 12.7
a Cumulative electron intensity as a function of distance (0–50 μm) from the beam center for 20-keV electrons passing through 100 Pa of oxygen as calculated with NIST DTSA-II. b Cumulative electron intensity as a function of distance (0–1000 μm) from the beam center for 20-keV electrons passing through 100 Pa of oxygen as calculated with NIST DTSA-II (GPL = Gas Path Length)
12.5 VPSEM Image Resolution
Remarkably, despite the strong gas scattering and the development of the skirt around the focused beam, the image resolution that can be achieved in VPSEM operation is very similar to that for the same specimen imaged at the same incident beam energy in a conventional high vacuum SEM. A comparison of high vacuum SEM and VPSEM imaging performance for gold islands on carbon using a modern thermal field emission gun SEM is shown in ◘ Fig. 12.8, showing comparable spatial resolution, as originally demonstrated by Danilatos (1993). This extraordinary imaging performance in the VPSEM can be understood by recognizing that elastic scattering is a stochastic process. As beam electrons encounter the gas molecules and atoms in the elevated pressure region, elastic scattering events occur, but not every electron suffers elastic scattering immediately. There remains an unscattered fraction of electrons that follows the expected path defined by the objective lens field and lands in the focused beam footprint identical to the situation at high vacuum but with reduced intensity due to the gas scattering events that rob the beam of some of the electrons. As the gas scattering path, which is a product of working distance and the gas pressure, increases, the unscattered fraction of the beam decreases and eventually reaches zero intensity. The fraction of unscattered electrons that remain in the beam can be calculated by the Monte Carlo simulation in DTSA-II, and an example is plotted in ◘ Fig. 12.9. For 20-keV electrons passing through 10 mm of water vapor at 200 Pa, approximately 20 % of the original beam current reaches the specimen surface unscattered and contained within the focused beam. The electrons that remain in the beam behave exactly as they would in a high vacuum SEM, creating the same interaction volume and generating secondary and backscattered electrons with exactly the same spatial distributions. The electrons that land in the scattering skirt also generate secondary and backscattered electrons in response to the local specimen characteristics they encounter, for example, surface inclination, roughness, composition, an so on, which may be different from the region sampled by the focused beam. Because these skirt electron interactions effectively arise from a broad, diffuse area rather than a focused beam, they cannot respond to fine-scale spatial details of the specimen as the beam is scanned. The skirt electrons interact over such a broad area that effectively they only contribute increased noise to the measurement, degrading the signal-to-noise ratio of the useful high resolution signal generated by the unscattered electrons that remain in the focused beam. This degraded signal-to-noise does degrade the visibility threshold, which can be compensated by increasing the beam current and/or by increasing the pixel dwell time. The degradation of feature visibility due to gas scattering has the most impact at the short pixel dwell times (high scan rates) that are typically selected for rapidly surveying a specimen to search for features of interest. The prudent VPSEM microscopist will always use long pixel dwell times to reduce the contrast visibility threshold to ensure that a low-contrast feature of interest can be observed.
Fig. 12.8
a High resolution SEM imaging of gold deposited on carbon in conventional SEM; E0 = 30 keV; E–T (positive bias) detector (bar = 200 nm) (image courtesy J. Mershon, TESCAN). b High resolution SEM imaging of gold deposited on carbon in VPSEM; 300 Pa N2; E0 = 30 keV; BSE detector (bar = 200 nm) (Image courtesy J. Mershon, TESCAN)
Fig. 12.9
Fraction of a 20-keV beam that remains unscattered after passage through 10 mm of water vapor at various pressures
As noted above, the E–T detector, or any other detector which employs a high accelerating voltage post-specimen, such as the channel plate multiplier, cannot be used at elevated VPSEM pressures due to ionization of the gas atoms leading to large-scale electrical breakdown. The passive backscattered electron detectors, including the semiconductor and scintillator detectors, are suitable for elevated pressure, since the backscattered electrons suffer negligible energy loss while transiting the environmental gas and thus retain sufficient energy to activate the scintillator without post-specimen acceleration. In fact, an added advantage of elevated pressure VPSEM operation is that the gas discharging allows the bare scintillator to be used without the metallic coating required for conventional high vacuum operation. An example of a VPSEM image of polymer foam prepared with a large symmetric BSE detector placed symmetrically above the specimen is shown in ◘ Fig. 12.10 (left).
Fig. 12.10
Uncoated polymer foam imaged under VPSEM conditions at E0 = 20 keV: (left) large solid angle symmetric BSE detector placed above the specimen; (bar = 500 µm) (right) same area with induced field SE detector (bar = 500 µm) (Images courtesy J. Mershan, TESCAN)
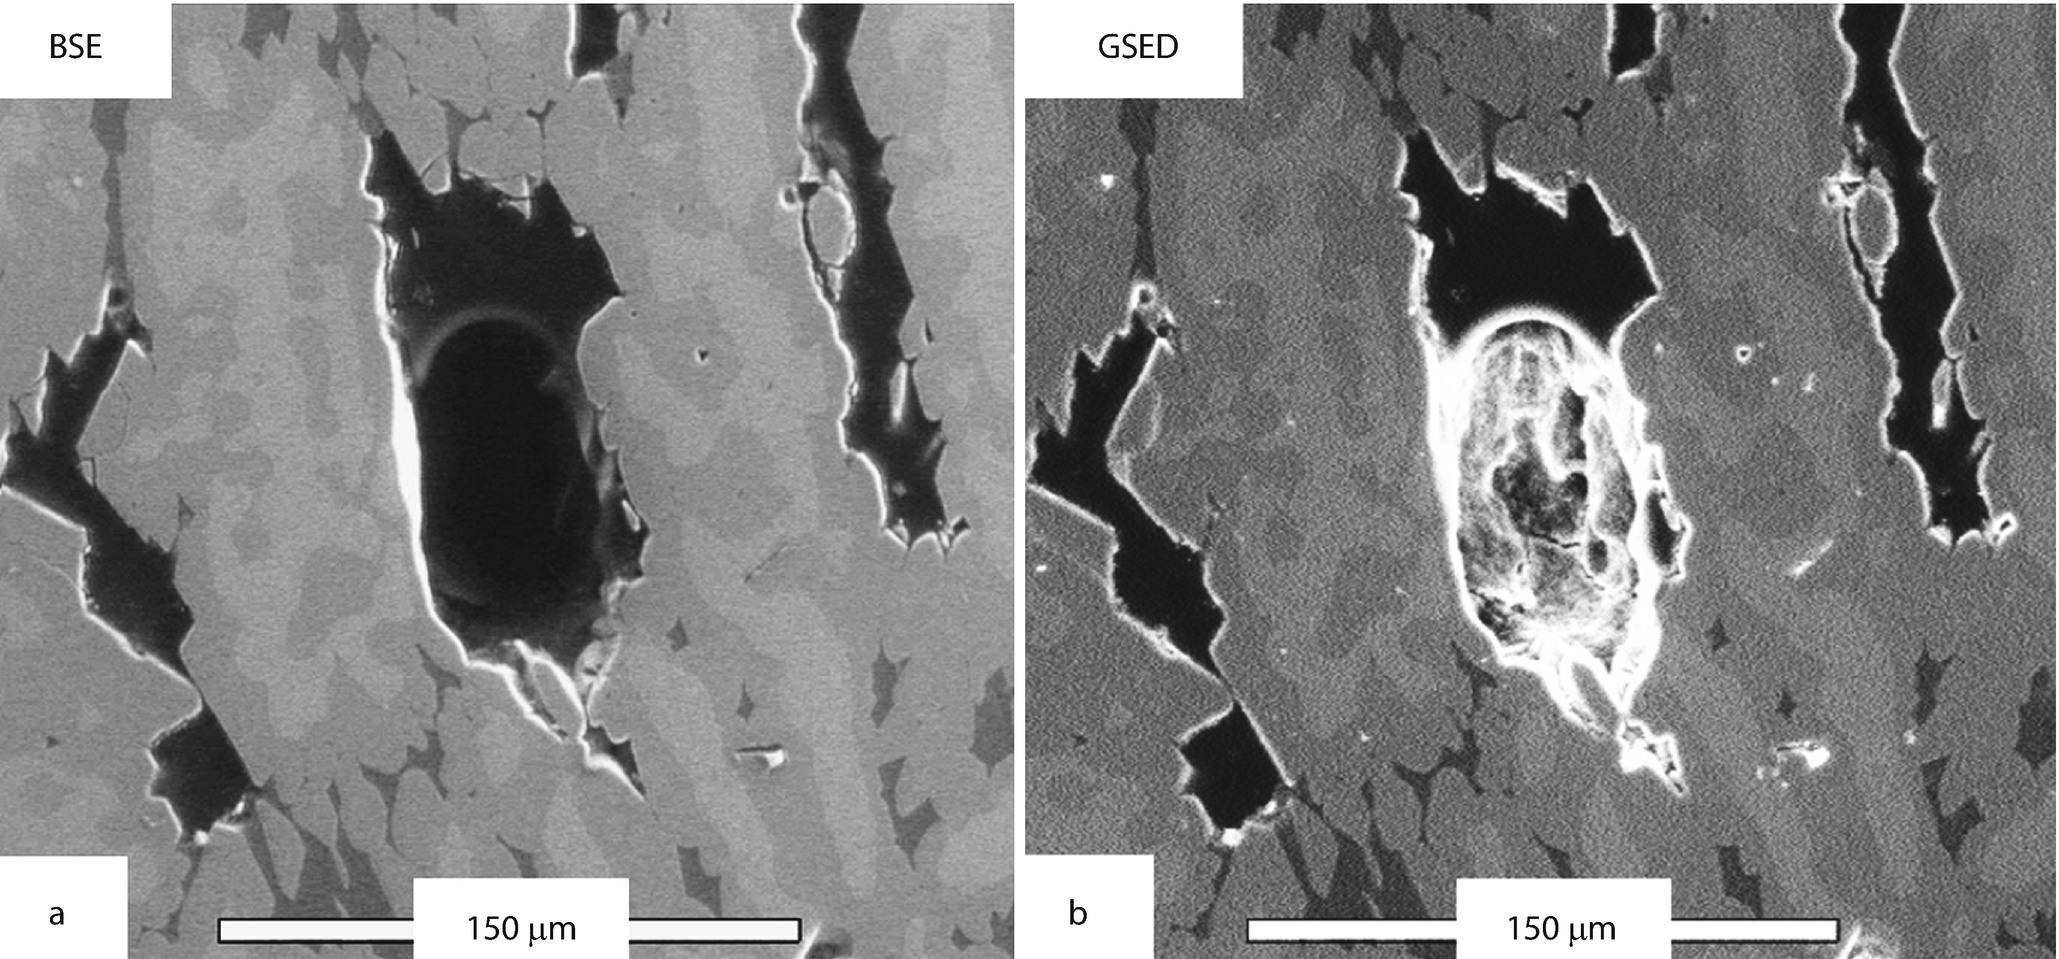
◘ Figure 12.11a shows an example of a BSE image of polished Raney nickel alloy obtained with a passive scintillator detector in water vapor at a pressure of 500 Pa (3.8 torr) with a beam energy of 20 keV. This BSE image shows compositional contrast similar to that observed under high vacuum conventional SEM imaging.
Fig. 12.11
VPSEM imaging of a polished Raney nickel alloy surface. a backscattered electron detector (BSE). b gaseous secondary electron detector (GSED). Note the details visible in the shrinkage cavity in the GSED image
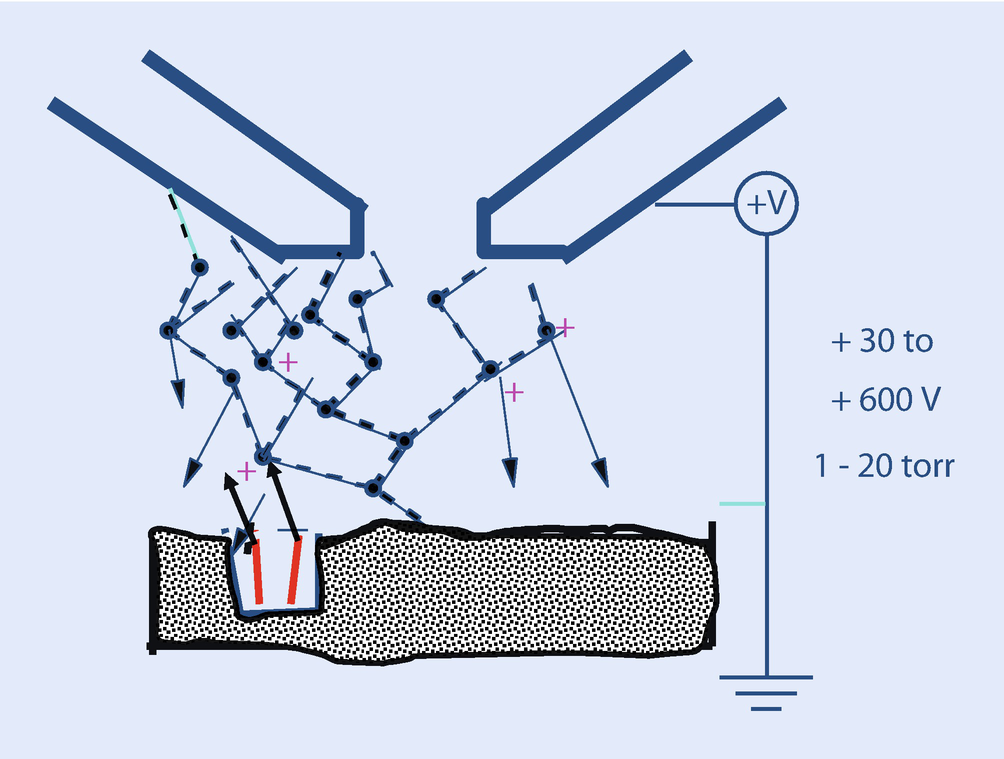
To utilize the low energy secondary electrons in the VPSEM, a special elevated pressure SE detector that utilizes ionization of the environmental gas (gaseous secondary electron detector, GSED) has been developed (Danilatos 1990). As shown schematically in ◘ Fig. 12.12, an electrode (which may also serve as the final pressure limiting aperture) in close proximity to the electrically grounded specimen is maintained at a modest accelerating voltage of a few hundred volts positive. The exact value of this applied voltage is selected so as not to exceed the breakdown voltage for the gas species and pressure being utilized. The SE emitted from the specimen are accelerated toward this electrode and undergo collisions with the gas molecules, ionizing them and creating positive ions and more free electrons. The mean free path for this process is a few tens of micrometers, depending on the gas pressure and the accelerating voltage, so that multiple generations of ionizing collisions can occur between SE emission from the specimen and collection at the positive electrode. Moreover, the electrons ejected from the gas atoms are also accelerated toward the wire and ionize other gas atoms, resulting in a cascade of increasing charge carriers, progressively amplifying the current collected at the electrode by a factor up to several hundred compared to the SE current originally emitted from the specimen. While BSE can also contribute to the total signal collected at the electrode by collisions with gas molecules, the mean free path for gas collisions increases rapidly with increasing electron energy thus decreasing the frequency of gas ionizations by the BSE. The contribution of the high energy BSE to the current amplification cascade is much less than that of the SE. To make simultaneous use of both the BSE and SE signals, a detector array such as that shown in ◘ Fig. 12.13 can be utilized, combining an annular scintillator BSE detector with the GSED. An example of the same area of the polished Raney nickel alloy simultaneously obtained with the GSED is shown in ◘ Fig. 12.11b, operating under VPSEM conditions with water vapor at a pressure of 600 Pa.
Fig. 12.12
Schematic diagram showing principle of operation of the gaseous secondary electron detector (GSED)
Fig. 12.13
Co-mounted BSE and GSED detectors, showing positions relative to the electron beam
Other variants of the GSED have been developed that make use of other physical phenomena that occur in the complex charged particle environment around the beam impact on the specimen, including the magnetic field induced by the motion of the charged particles and the cathodoluminescence of certain environmental gases induced by the SE and BSE. An example of an induced-field SE detector image is shown in ◘ Fig. 12.10 (right).
12.7 Contrast in VPSEM
In general, the contrast mechanisms for the BSE and SE signals that are familiar from conventional high vacuum SEM operate in a similar fashion in VPSEM. For example, in the BSE detector image shown in ◘ Fig. 12.11a, most of the region of the Raney nickel alloy being viewed consists of a flat polished surface. Close examination of this image reveals atomic number (compositional) contrast from the flat surface that is consistent with what would be observed for this specimen with the BSE signal in a conventional high vacuum SEM operating at the same beam energy. This same atomic number contrast can be observed in the simultaneously recorded GSED SE image in ◘ Fig. 12.11b. Atomic number contrast appears in the GSED SE image because of the atomic number dependence of the SE2 class of secondary electrons that are generated by the exiting BSEs and are thus subject to the same contrast mechanisms as the BSEs. This is again familiar contrast behavior equivalent to high vacuum SEM imaging experience with the E–T detector. An important difference in the VPSEM case is the loss of the large contribution to atomic number contrast made by the SE3 class in a high vacuum SEM. The SE3 contribution is not a significant factor in the VPSEM since the SE3 are generated on the chamber walls and objective lens outside of the accelerating field of the GSED and thus do not contribute to the SE signal.
Most BSE and SE images can be interpreted from the experience of high vacuum SEM, but as in all SEM image interpretation, the microscopist must always consider the apparent illumination situation provided by the detector in use. The GSED class of detectors is effectively located very close to the incident beam and thus provide apparent illumination along the line-of-sight. Moreover, the degree of amplification increases with distance of the surface from the GSED detector. These characteristics of the GSED lead to an important difference between ◘ Fig. 12.11a, b. The deep cavity is much brighter in the GSED image compared to the BSE image. The cavity walls and floor are fully illuminated by the electron beam and fine scale features can be captured at the bottom, as shown in the progressive image sequence in ◘ Fig. 12.14. The differing contrast in these images is a result of the relative positions and signal responses of the BSE and GSED detectors. Both detectors are annular, but the GSED detector is effectively looking along the beam and produces apparent lighting along the viewer’s direction of sight. The annular BSE detector intercepts BSEs traveling at a minimum angle of approximately 20 degrees to the beam so that the effective lighting appears to come from outside the viewer’s direction of sight. The cavity appears dark in the BSE image because although the primary beam strikes the walls and floor, there is no line-of-sight from cavity surfaces to the BSE detector. The BSEs are strongly reabsorbed by the walls and/or scattered out of the line-of-sight collection of the BSE detector. Because the environmental gas penetrates into the holes, as long as the primary beam can strike a surface and cause it to emit secondary electrons, the positive collection potential on the final pressure limiting aperture will attract electrons from the ionization cascade and generate a measurable SE signal, as shown schematically in ◘ Fig. 12.15 (Newbury 1996). Because of the added ionization path represented by the depth of the cavity, the SEs generated deep in the cavity create additional generations of cascade multiplication, increasing the signal compared to the flat surface of the specimen, making the cavities appear bright relative to the flat surface.
Fig. 12.14
Sequence of VPSEM images showing details revealed at the bottom of a cavity in polished Raney nickel alloy
Fig. 12.15
Effect of extended gas path length created by a cavity
Open Access This chapter is licensed under the terms of the Creative Commons Attribution-NonCommercial 2.5 International License (http://creativecommons.org/licenses/by-nc/2.5/), which permits any noncommercial use, sharing, adaptation, distribution and reproduction in any medium or format, as long as you give appropriate credit to the original author(s) and the source, provide a link to the Creative Commons license and indicate if changes were made.
The images or other third party material in this chapter are included in the chapter's Creative Commons license, unless indicated otherwise in a credit line to the material. If material is not included in the chapter's Creative Commons license and your intended use is not permitted by statutory regulation or exceeds the permitted use, you will need to obtain permission directly from the copyright holder.