Chapter 23
HOW RICH IS RICH?
While chatting long-distance with a financial entrepreneur in London, I asked, “How much wealth would you need today to retire and live comfortably for the rest of your life?” “I know my exact number,” he replied. “It’s $20 million.” I said, “According to my calculations, each year you can withdraw the equivalent of 2 percent of that amount, or $400,000 in today’s dollars, with only a small probability of ever using up your fortune.” In his early forties, married and with three small children, he said this sounded good to him. But everyone has a different number.
The famous American fiction writer John D. MacDonald characterized levels of wealth in 1970 in his Travis McGee series. As I remember, his economist co-hero Meyer said $100,000 was “adequate” and $250,000 “comfortable,” whereas $1,000,000 was “substantial.” To have $5,000,000 was “impressive.” Since inflation has cut the real buying power of the dollar, MacDonald’s corresponding year 2015 numbers would be six times as large, with $600,000 as adequate, $1,500,000 as comfortable, $6,000,000 as substantial, and $30,000,000 as impressive.
Dinesh D’Souza gave the following classification, which I have adjusted for inflation.
Table 3: Classifications of Wealth
Income |
Wealth |
|
Superrich |
$15 million+ |
$150 million+ |
Rich |
$1.5–15 million |
$15 million–150 million |
Upper-middle |
$112,000–1.5 million |
$750,000–15 million |
Middle |
$50,000–112,000 |
$82,000–750,000 |
Lower-middle |
$22,000–50,000 |
$15,000–82,000 |
Poor |
$0–22,000 |
$0–15,000 |
US household wealth was estimated at $83 trillion at the end of 2014, mainly stocks, bonds, real estate, and personal property. What if we divided it up so everyone had the same amount? With 320 million people participating, each would have about $270,000. However, such estimates of national wealth and of the distribution of wealth and income are problematic. It depends on what’s counted and how it’s counted, and much data is not available.
It’s also true that this increasing national wealth has become more unevenly distributed. The median wealth of a US household fell 36 percent, after inflation, from 2003 to 2013, declining from $88,000 to $56,000. In contrast, a household at the 97.5 percentile was 12 percent better off, with its net worth moving from $1.19 million up to $1.36 million.
A million dollars still sounds like real money, even though it doesn’t buy nearly what it once did. In fact, it would take $20 million today to match the buying power of $1 million a century ago. How many in the United States have a net worth of $1 million? No one knows exactly, because comprehensive information on personal wealth is difficult to collect. Much of it is not available, not reported, or deliberately hidden to avoid taxes, theft, or criminal prosecution, or simply for personal privacy. Most of the available information applies to household units, of which there are about 125 million. Some households consist of only one person and most of the rest have a single economically dominant individual, so counting wealthy households probably gives a good estimate for the number of wealthy individuals.
The number of households worth at least $1 million was thought to be about ten million in 2015. With so many millionaire households, the goal of becoming one of them looks within reach. To see what might be done, imagine you’re an eighteen-year-old blue-collar worker with no savings and no prospects. What if, somehow, you could save $6 a day and buy shares in the Vanguard S&P 500 Index Fund at the end of each month? If that investment grows in a tax-deferred retirement plan at the long-term average for large stocks of about 10 percent, then after forty-seven years you can retire at age sixty-five with $2.4 million. But where do you find an extra $6 a day? The pack-and-a-half-a-day smoker who kicks his drug habit saves $6 each day. If the construction worker who drinks two $5 six-packs of beer or Coke each day switches to tap water he can save $10 a day, $6 of which he puts in an index fund and $4 of which he spends on healthy food to replace the junk calories from the beer or Coke.
Most of us, with greater opportunities to redirect our expenditures, can expect to do better than our poor, young, blue-collar worker. An article titled “Budget Basics: 25 Things You Can Do to Trim Yours Today” began with the excellent suggestion “Write down everything you spend. The waste in your daily spending should soon become apparent.” Number two agrees with my advice to pay off credit card debt as soon as possible. Number four says to give up smoking. Number twenty-three suggests buying a car used rather than new because “A car is worth about 1⁄3 less the minute you drive it off the lot.” Whether or not the immediate loss is that great, it’s generally agreed that the buyer of a new car gets relatively little real useful value in return for the early years of rapid depreciation. Suppose you could settle for a $10,000 used car rather than a $20,000 new car. Invested at a hypothetical after-tax annual return of 8 percent just like the cigarette money, the $10,000 difference grows to over $100,000 in thirty years. To those who balk at changing their ways we can only ask, along with Regis Philbin, “Who wants to be a millionaire?”
Investors I dealt with typically were not just millionaires but multimillionaires with fortunes of $5 million and up. How many households have reached these rarefied heights? The great Italian economist Vilfredo Pareto studied the distribution of income and in 1897 came up with a “power law” formula that seems then and now to describe fairly well how many top wealth holders in a modern society have reached various levels. To calibrate the formula we need just these two facts: The Forbes 400 cutoff for the United States, which was $1.55 billion in 2014, and the total wealth of those four hundred, an amazing $2.3 trillion. The formula gives us Table 4.
Table 4: Estimated Numbers of Wealthiest Households, United States, Year 2014
Wealth Level W: This Amount or More |
Formula Estimate of Number N of US Households Having This Much or More |
|
$1 million |
9,300,000 |
|
$5 million |
1,030,000 |
|
$10 million |
400,000 |
|
$20 million |
155,000 |
|
$50 million |
44,000 |
|
$100 million |
17,000 |
|
$250 million |
4,900 |
|
$500 million |
1,900 |
|
$1 billion |
730 |
|
$1.55 billion |
400 |
The formula is a good fit for only high wealth levels, giving numbers that are too large below a point somewhere in the neighborhood of $1 million.
You might wonder how the numbers corresponding to table 4 would look for your city, county, region, or state. If your area were average, you could simply multiply the estimated number for the United States by the percentage living in your area. Orange County, California, where I live, had just over three million people in 2014, or 1 percent of the total US population, so the numbers were easy. Just move the decimal point two steps to the left in table 4, getting a table for Orange County, and giving a total of forty-nine people worth a quarter of a billion dollars or more, for example. But the distribution of the rich varies widely. Areas like Redmond, Washington, home of Microsoft, or Silicon Valley, California, a center of the dot-com revolution, or Manhattan, New York, the self-proclaimed financial capital of the universe, have far more than their share, while other regions consequently are underrepresented.
Some of the superrich call $100 million a “unit” and, when they have their first unit, proudly announce that “the first unit is the hardest.” Our table estimates seventeen thousand households were in this select group in 2014. With 125 million American households, the politically controversial 1 percent are the wealthiest 1,250,000. The cutoff is around $4 million. However, as we’ll discuss, it’s the top 0.01 percent of all households, a mere 12,500, that run our society. Members of this group are worth at least $125 million.
At the top of the ladder was William F. (Bill) Gates, the co-founder and largest shareholder of the Microsoft Corporation (MSFT), whose fortune at one point made him the first human ever to achieve a net worth of more than $100 billion, an amount which then exceeded 1 percent of the entire gross national product of the United States. Gates—even after giving a large part of his fortune to his charitable foundation—once again led the 2014 Forbes list of the richest people in the US at $81 billion.
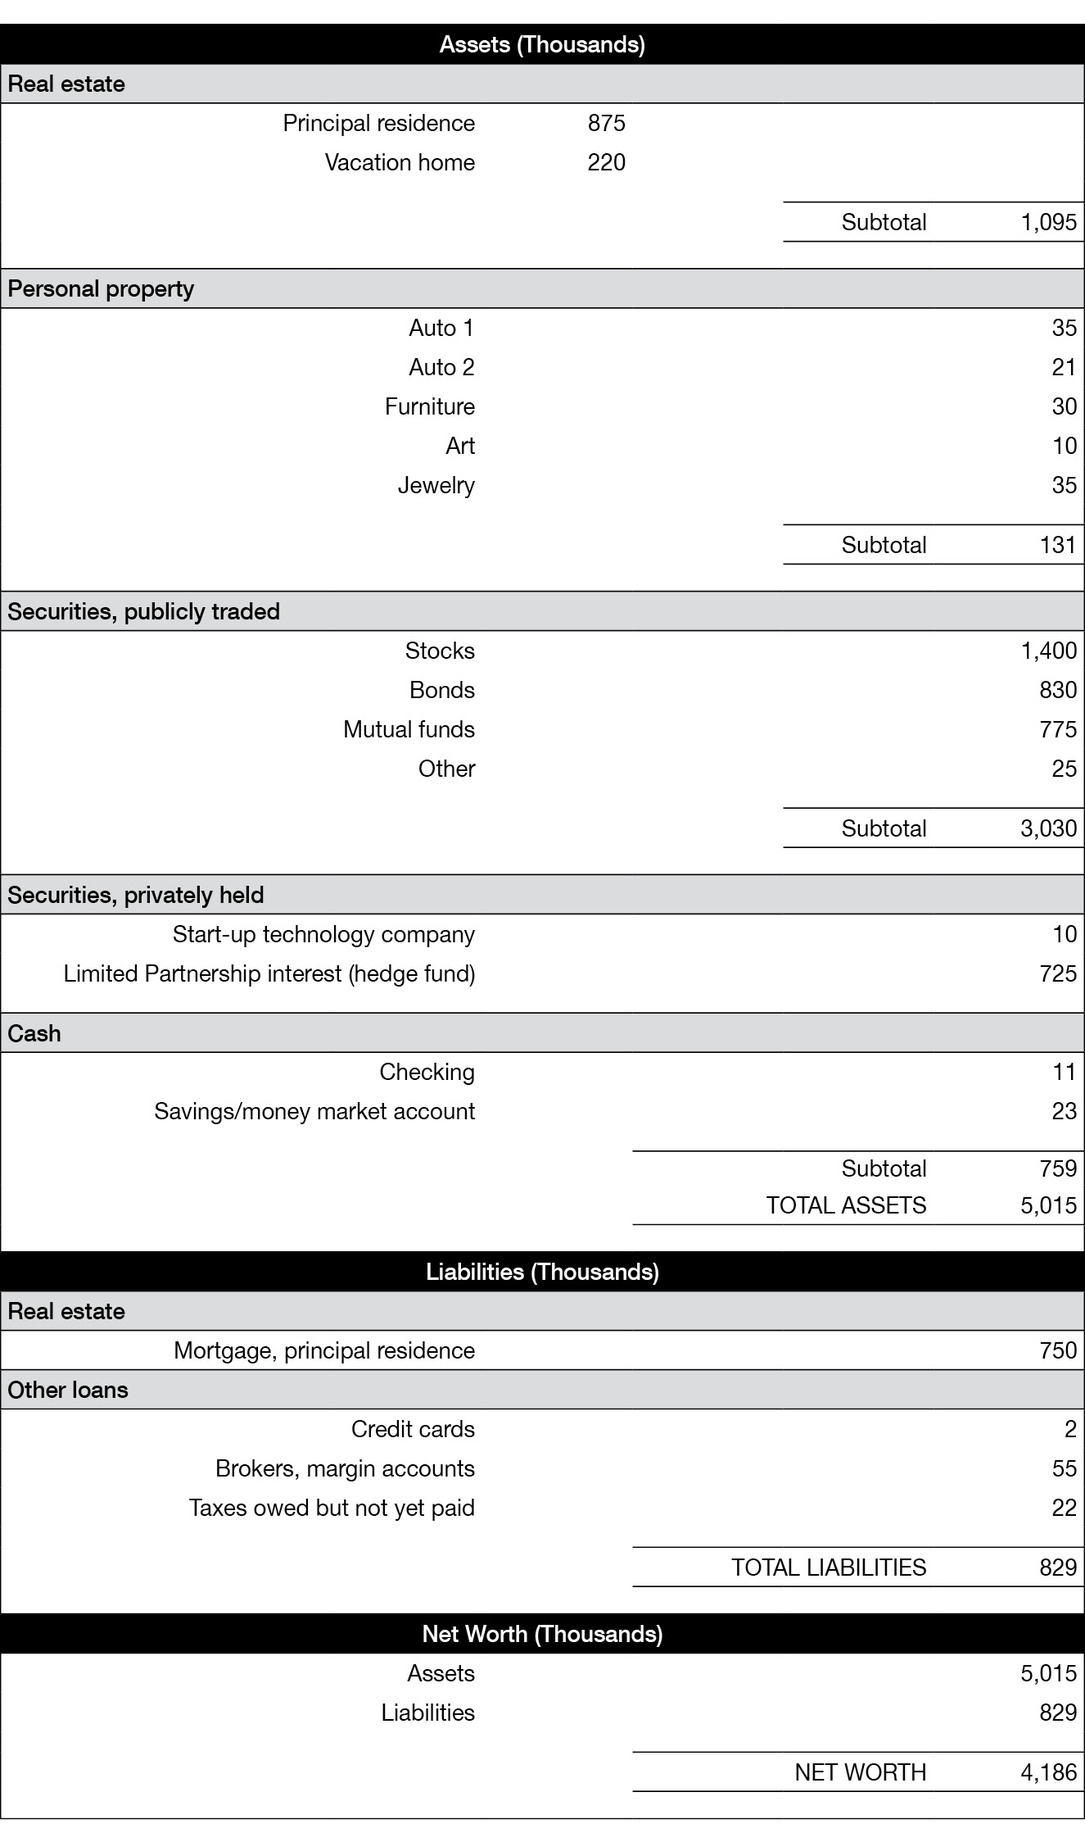
To see where you stand on the ladder of wealth, estimate your or your household’s net worth. List the value of what you own, your assets, and what you owe, your debts or liabilities. The difference is your net worth. To get a quick start, don’t do any research, don’t consult any records. When you don’t know exact numbers, just guess. If you’re uncertain, put in a low value for what you own and a high value for what you owe, leading to a conservative value for what you’re worth. Table 5 is an example, for someone just at the threshold of the top 1 percent, based on a hypothetical composite of several wealthy people I know.
Table 5: Estimating a Household’s Net Worth
This quick assessment gives you an idea of where you stand. Later you will want to make a more accurate balance sheet, which I do about once a year. The difference in balance sheet net worth from one year to the next shows the change in your total wealth after income, expenses, gains and losses. This series of annual balance sheets shows how your wealth is changing over the years.
In the asset section, for each item list the amount of cash you feel sure it would sell for in a reasonably short time. That car you bought new a year ago for $45,000 might have a replacement cost of $39,000 now, but you might be able to sell it for only $35,000. Put down $35,000. Recent sales of houses comparable with yours might range from $925,000 to $950,000, but after all sales and closing costs, you might net only $875,000. Put down $875,000. What you owe on the mortgage will be deducted in the liabilities section.
Unlike liquid listed securities, the current market prices for property such as cars, houses, art, and jewelry are not continuously displayed, but the analogy to securities prices is useful for understanding the impact of commissions on profits and losses. Just as each security has a current price for which you can buy it, the asking price, and a somewhat higher cost to you after paying commissions, we can imagine an all-inclusive “asking” price that we would have to pay for a piece of property identical to what we now own. Call this the replacement cost. And just as each security has a current price someone will pay for it, called the bid price, and a somewhat lower net proceeds to us after commissions, we also can imagine the highest net proceeds we might receive after selling costs for a piece of property. This is the liquidation value that we are listing in the asset section.
This spread between replacement value and liquidation value may be high for real property—often as much as 10 to 20 percent. For instance, I buy a $100,000 painting and pay $7,000 more in sales taxes, for a total of $107,000. The next day I change my mind and sell it for the same price of $100,000, paying $10,000 in commissions, for net proceeds of $90,000. The spread was $90,000 to $107,000, a difference of $17,000 or 17 percent of the “base” price of $100,000. This is what is lost in a round of buying and selling. It’s that way with houses, cars, art, and jewelry. In contrast, the cost to trade listed securities is typically only a small fraction of a percent—which, along with their liquidity, makes them more appealing stores of wealth.
Wealth, which I use synonymously with the accountants’ term net worth, shows how rich you are now, whereas income measures how much money your wealth, labor, and ingenuity are currently generating. A major part of aggregate wealth increase, especially at the higher wealth levels, comes from investments such as stocks, bonds, real estate, and collectibles. Wealth, not income, is the measure of how rich someone is now. However, examples like the movie star who leaps to fame and starts making $20 million per year show that income may lead to future large increases in wealth.
It’s that increase in net worth from year to year that takes you up the ladder of wealth. To measure your increase in wealth from one year to the next, compare the yearly balance sheets. Divide the difference by the beginning wealth to get your percentage change for the year. This gives you an idea of how fast you are compounding. If you also construct an income statement for the period, the net income after expenses should match your change in net worth.
Balance sheets are snapshots that tell you where you are at a particular time. The income statement tells you what happens between two balance sheets. To appreciate the income statement without bothering to look anything up, jot down a list of all the sources that added to, or subtracted from, your wealth during the last twelve months. Do this “rough and dirty”; focus on the ideas rather than details and precision. Here are some categories to check:
A. Income, taxable and nontaxable:
1. Earned income such as wages and salaries.
2. Unearned income such as interest and dividends.
3. Realized capital gains and losses.
4. Royalties, honoraria, all other taxable receipts.
5. Tax-free interest, such as municipal bonds.
B. Nontaxable gains and losses:
1. Appreciation or depreciation of property such as real estate, art, and autos.
2. Unrealized capital gains or losses in securities.
C. Expenses (all money paid out for “costs”—that is, not saved):
1. Living expenses, consumption.
2. Income taxes.
3. Gifts.
4. Any other money earned but not saved.
Category A is what most people call income. Reduced by deductions and nontaxable income, it is what you’ll pay income tax on. Category B is less tangible and psychologically less appreciated or understood, but it adds to your wealth equally, and because taxes on it are deferred or never paid, the money works longer for you. Thus this type of gain is more desirable. Ironically, most people during the last century focused on income such as dividends and interest. As the folly of paying unnecessary taxes dawned on investors, the dividend rate paid by companies in the last part of the twentieth century dwindled and stock prices soared, shifting returns away from income and toward capital gains.
Category C is everything you spend or consume that doesn’t contribute to your wealth. Think of your wealth at the start of the year as liquid partly filling a huge measuring cup. The balance sheet tells you how much is there. During the year categories A and B tell how much you add and category C tells you how much you take out. The difference, A + B − C, is how much you added or subtracted during the year. This is net economic gain and, as an investor, it’s what you want to maximize. The balance sheet at the end of the year corresponds to the liquid left in the measuring cup.
The income statement shows that your taxable income may be very different from your economic income. Statistics for economic incomes are not available, being mostly unknown and not reported. However, though the disparities between economic income and taxable income may vary wildly from taxpayer to taxpayer and from year to year, we do know how taxable incomes are distributed among households. For instance, those American households that paid the most income tax in 2007, the top 0.01 percent, numbering fifteen thousand, each paid taxes on $11.5 million or more. Their 6.04 percent of the entire country’s declared income was then the highest percentage ever. It totaled $557 billion, an average $37 million each.
The journal Tax Notes said the top 0.01 percent of American households expanded their inflation-adjusted income from 1973 to 2007 by 8.58 times whereas the bottom 90 percent gained about $8 per year! This inequality increased further in the next decade.
One of the keys to reaching such great wealth at the top is compound growth.