perf is an abbreviation of the Linux performance event counter subsystem, perf_events, and also the name of the command-line tool for interacting with perf_events. Both have been part of the kernel since Linux 2.6.31. There is plenty of useful information in the Linux source tree in tools/perf/Documentation, and also at https://perf.wiki.kernel.org.
The initial impetus for developing perf was to provide a unified way to access the registers of the
performance measurement unit (PMU), which is part of most modern processor cores. Once the API was defined and integrated into Linux, it became logical to extend it to cover other types of performance counters.
At its heart, perf is a collection of event counters with rules about when they actively collect data. By setting the rules, you can capture data from the whole system, or just the kernel, or just one process and its children, and do it across all CPUs or just one CPU. It is very flexible. With this one tool you can start by looking at the whole system, then zero in on a device driver that seems to be causing problems, or an application that is running slowly, or a library function that seems to being taking longer to execute than you thought.
The code for the perf command-line tool is part of the kernel, in the tools/perf directory. The tool and the kernel subsystem are developed hand-in-hand, meaning that they must be from the same version of the kernel. perf can do a lot. In this chapter, I will examine it only as a profiler. For a description of its other capabilities, read the perf man pages and refer to the documentation mentioned in the previous paragraph.
You need a kernel that is configured for perf_events and you need the perf command cross compiled to run on the target. The relevant kernel configuration is CONFIG_PERF_EVENTS present in the menu General setup | Kernel Performance Events And Counters.
If you want to profile using tracepoints—more on this subject later—also enable the options described in the section about Ftrace. While you are there, it is worthwhile enabling CONFIG_DEBUG_INFO as well.
The perf command has many dependencies which makes cross compiling it quite messy. However, both the Yocto Project and Buildroot have target packages for it.
You will also need debug symbols on the target for the binaries that you are interested in profiling, otherwise perf will not be able to resolve addresses to meaningful symbols. Ideally, you want debug symbols for the whole system including the kernel. For the latter, remember that the debug symbols for the kernel are in the vmlinux file.
If you are using the standard linux-yocto kernel, perf_events is enabled already, so there is nothing more to do.
To build the perf tool, you can add it explicitly to the target image dependencies, or you can add the tools-profile feature which also brings in gprof. As I mentioned previously, you will probably want debug symbols on the target image, and also the kernel vmlinux image. In total, this is what you will need in conf/local.conf:
EXTRA_IMAGE_FEATURES = "debug-tweaks dbg-pkgs tools-profile"
IMAGE_INSTALL_append = " kernel-vmlinux"
Many Buildroot kernel configurations do not include perf_events, so you should begin by checking that your kernel includes the options mentioned in the preceding section.
To cross compile perf, run the Buildroot menuconfig and select the following:
BR2_LINUX_KERNEL_TOOL_PERFin Kernel | Linux Kernel Tools. To build packages with debug symbols and install them unstripped on the target, select these two settings.BR2_ENABLE_DEBUGin the menu Build options | build packages with debugging symbols menu.BR2_STRIP = nonein the menu Build options | strip command for binaries on target.
Then, run make clean, followed by make.
When you have built everything, you will have to copy vmlinux into the target image manually.
You can use perf to sample the state of a program using one of the event counters and accumulate samples over a period of time to create a profile. This is another example of statistical profiling. The default event counter is called cycles, which is a generic hardware counter that is mapped to a PMU register representing a count of cycles at the core clock frequency.
Creating a profile using perf is a two stage process: the perf record command captures samples and writes them to a file named perf.data (by default) and then perf report analyzes the results. Both commands are run on the target. The samples being collected are filtered for the process and its children, for a command you specify. Here is an example profiling a shell script that searches for the string linux:
# perf record sh -c "find /usr/share | xargs grep linux > /dev/null"
[ perf record: Woken up 2 times to write data ]
[ perf record: Captured and wrote 0.368 MB perf.data (~16057 samples) ]
# ls -l perf.data
-rw-------    1 root     root      387360 Aug 25  2015 perf.data
Now you can show the results from perf.data using the command perf report. There are three user interfaces which you can select on the command line:
--stdio: This is a pure text interface with no user interaction. You will have to launchperf reportand annotate for each view of the trace.--tui: This is a simple text-based menu interface with traversal between screens.--gtk: This is a graphical interface that otherwise acts in the same way as--tui.
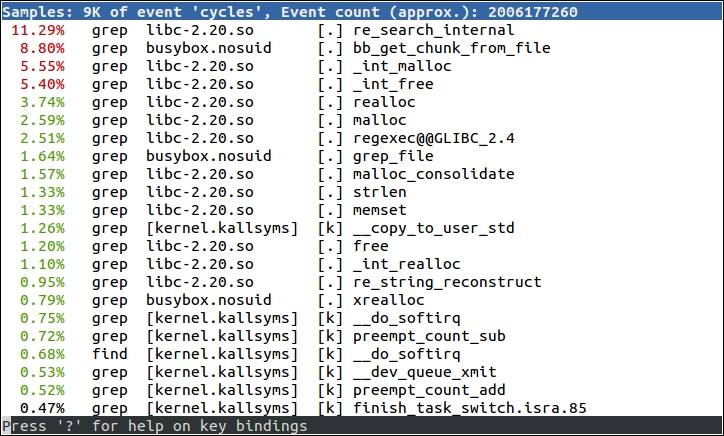
The default is TUI, as shown in this example:

perf is able to record the kernel functions executed on behalf of the processes because it collects samples in kernel space.
The list is ordered with the most active functions first. In this example, all but one are captured while grep is running. Some are in a library, libc-2.20, some in a program, busybox.nosuid, and some are in the kernel. We have symbol names for program and library functions because all the binaries have been installed on the target with debug information, and kernel symbols are being read from /boot/vmlinux. If you have vmlinux in a different location, add -k <path> to the perf report command. Rather than storing samples in perf.data, you can save them to a different file using perf record -o <file name> and analyze them using perf report -i <file name>.
By default, perf record samples at a frequency of 1000Hz using the cycles counter.
This is still not really making life easy; the functions at the top of the list are mostly low level memory operations and you can be fairly sure that they have already been optimized. It would be nice to step back and see where these functions are being called from. You can do that by capturing the backtrace from each sample, which you can do with the -g option to perf record.
Now perf report shows a plus sign (+) where the function is part of a call chain. You can expand the trace to see the functions lower down in the chain:

Note
Generating call graphs relies on the ability to extract call frames from the stack, just as is necessary for backtraces in GDB. The information needed to unwind stacks is encoded in the debug information of the executables but not all combinations of architecture and toolchains are capable of doing so.
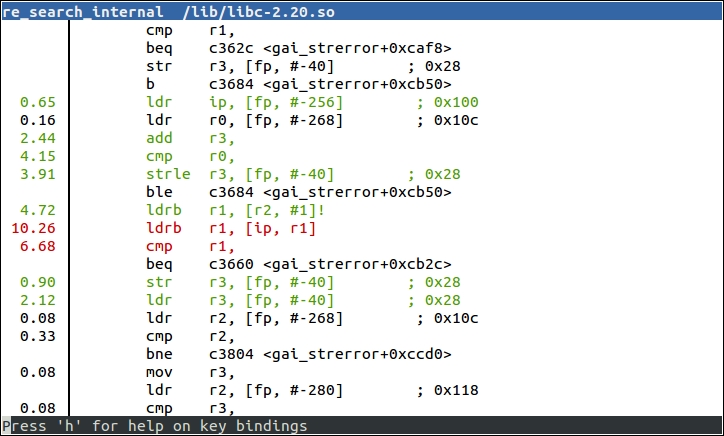
Now that you know which functions to look at, it would be nice to step inside and see the code and to have hit counts for each instruction. That is what perf annotate does, by calling down to a copy of objdump installed on the target. You just need to use perf annotate in place of perf report.
perf annotate requires symbol tables for the executables and vmlinux. Here is an example of an annotated function:

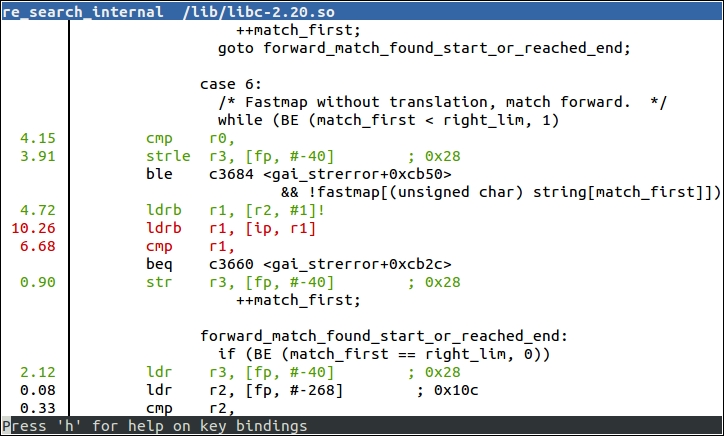
If you want to see the source code interleaved with the assembler, you can copy the relevant parts to the target device. If you are using the Yocto Project and build with the extra image feature dbg-pkgs, or have installed the individual -dbg package, then the source will have been installed for you in /usr/src/debug. Otherwise, you can examine the debug information to see the location of the source code:
$ arm-buildroot-linux-gnueabi-objdump --dwarf lib/libc-2.19.so  | grep DW_AT_comp_dir
  <3f>   DW_AT_comp_dir : /home/chris/buildroot/output/build/host-gcc-initial-4.8.3/build/arm-buildroot-linux-gnueabi/libgcc
The path on the target should be exactly the same as the path you can see in DW_AT_comp_dir.
Here is an example of annotation with source and assembler code:
