All the configuration and tuning you may do will be pointless if you cannot show that your device meets the deadlines. You will need your own benchmarks for the final testing but I will describe here two important measurement tools: cyclictest and Ftrace.
cyclictest was originally written by Thomas Gleixner and is now available on most platforms in a package named rt-tests. If you are using the Yocto Project, you can create a target image that includes rt-tests by building the real-time image recipe like this:
$ bitbake core-image-rt
If you are using Buildroot, you need to add the package, BR2_PACKAGE_RT_TESTS in the menu Target packages | Debugging, profiling and benchmark | rt-tests.
cyclictest measures scheduling latencies by comparing the actual time taken for a sleep to the requested time. If there was no latency they would be the same and the reported latency would be zero. cyclictest assumes a timer resolution of less than one microsecond.
It has a large number of command-line options. To start with, you might try running this command as root on the target:
# cyclictest -l 100000 -m -n -p 99
# /dev/cpu_dma_latency set to 0us
policy: fifo: loadavg: 1.14 1.06 1.00 1/49 320

T: 0 (  320) P:99 I:1000 C: 100000 Min:  9 Act:  13 Avg:  15 Max:  134
The options selected are as follows:
-l N: loop N times: the default is unlimited-m: lock memory with mlockall-n: useclock_nanosleep(2)instead ofnanosleep(2)-p N: use the real-time priorityN
The result line shows the following, reading from left to right:
T: 0: this was thread 0, the only thread in this run. You can set the number of threads with parameter-t.(320): this was PID 320.P:99: the priority was 99.I:1000: the interval between loops was 1,000 microseconds. You can set the interval with parameter-i N.C:100000: the final loop count for this thread was 100,000.Min: 9: the minimum latency was 9 microseconds.Act:13: the actual latency was 13 microseconds. The actual latency is the most recent latency measurement, which only makes sense if you are watchingcyclictestrun.Avg:15: the average latency was 15 microseconds.Max:134: the maximum latency was 134 microseconds.
This was obtained on an idle system running an unmodified linux-yocto kernel as a quick demonstration of the tool. To be of real use, you would run tests over a 24 hour period or more while running a load representative of the maximum you expect.
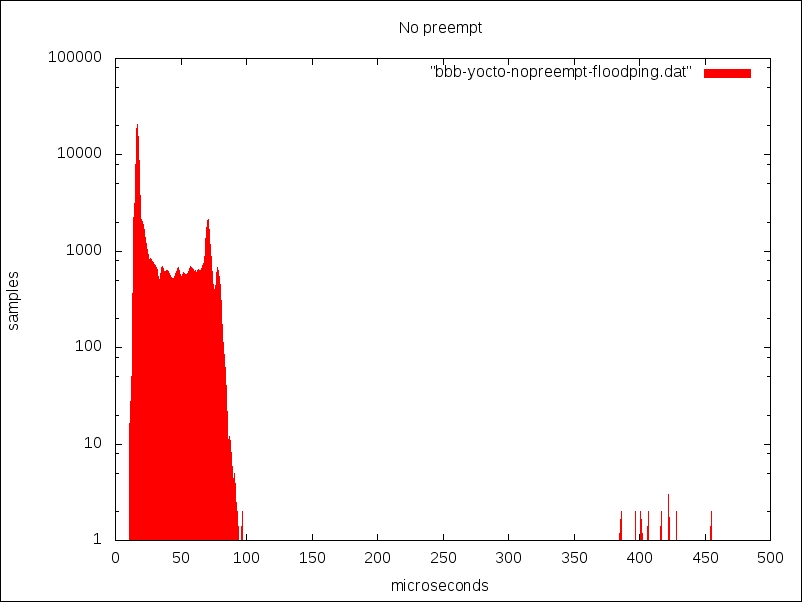
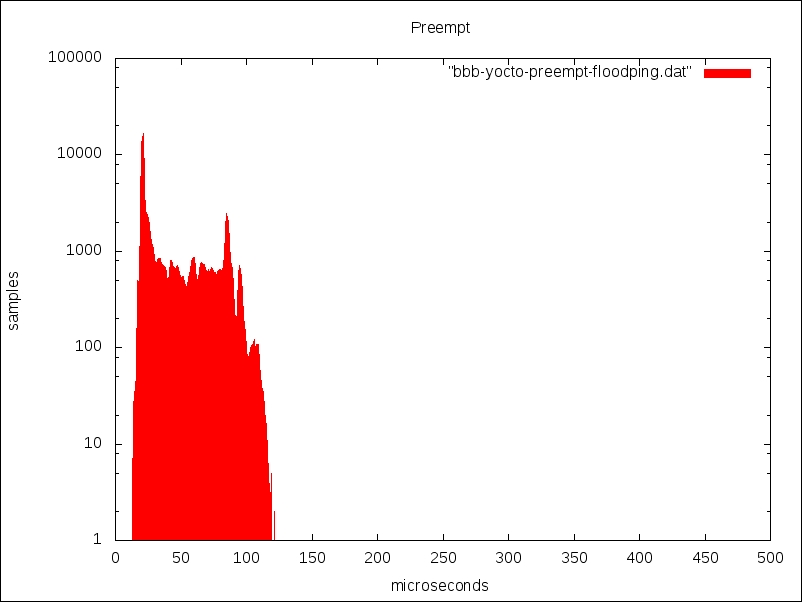
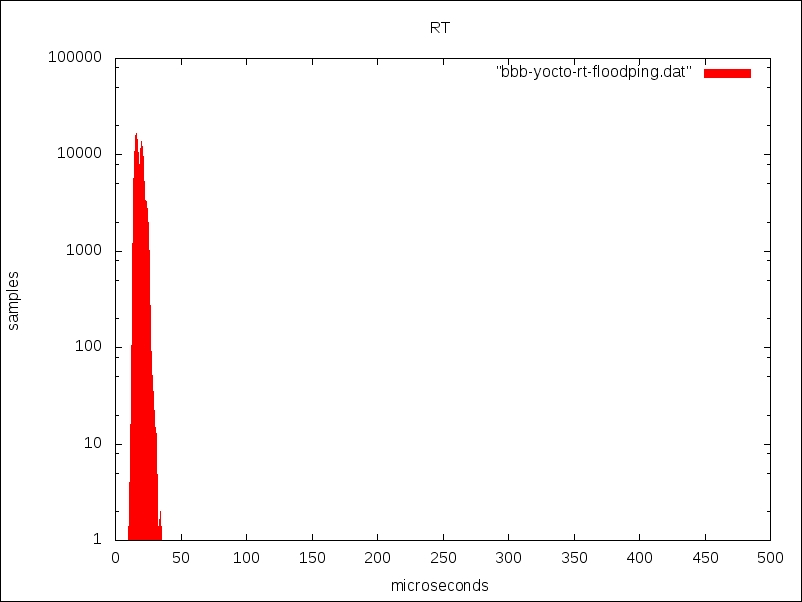
Of the numbers produced by cyclictest, the maximum latency is the most interesting, but it would be nice to get an idea of the spread of the values. You can get that by adding -h <N> to obtain a histogram of samples that are up to N microseconds late. Using this technique, I obtained three traces for the same target board running kernels with no preemption, with standard preemption, and with RT preemption while being loaded with Ethernet traffic from a flood ping. The command line was as shown here:
# cyclictest -p 99 -m -n -l 100000 -q -h 500 > cyclictest.data
The following is the output generated with no preemption:

Without preemption, most samples are within 100 microseconds of the deadline, but there are some outliers of up to 500 microseconds, which is pretty much what you would expect.
This is the output generated with standard preemption:

With preemption, the samples are spread out at the lower end but there is nothing beyond 120 microseconds.
Here is the output generated with RT preemption:

The RT kernel is a clear winner because everything is tightly bunched around the 20 microsecond mark and there is nothing later than 35 microseconds.
cyclictest, then, is a standard metric for scheduling latencies. However, it cannot help you identify and resolve specific problems with kernel latency. To do that, you need Ftrace.
The kernel function tracer has tracers to help track down kernel latencies—that is what it was originally written for, after all. These tracers capture the trace for the worst case latency detected during a run, showing the functions that caused the delay. The tracers of interest, together with the kernel configuration parameters, are as follows:
irqsoff:CONFIG_IRQSOFF_TRACERtraces code that disables interrupts, recording the worst casepreemptoff:CONFIG_PREEMPT_TRACERis similar toirqsoff, but traces the longest time that kernel preemeption is disabled (only available on preemptible kernels)preemptirqsoff: it combines the previous two traces to record the largest time eitherirqsand/or preemption is disabledwakeup: traces and records the maximum latency that it takes for the highest priority task to get scheduled after it has been woken upwakeup_rt: the same as wake up but only for real-time threads with theSCHED_FIFO,SCHED_RR, orSCHED_DEADLINEpolicieswakeup_dl: the same but only for deadline-scheduled threads with theSCHED_DEADLINEpolicy
Be aware that running Ftrace adds a lot of latency, in the order of tens of milliseconds, every time it captures a new maximum which Ftrace itself can ignore. However, it skews the results of user-space tracers such as cyclictest. In other words, ignore the results of cyclictest if you run it while capturing traces.
Selecting the tracer is the same as for the function tracer we looked at in Chapter 13, Profiling and Tracing. Here is an example of capturing a trace for the maximum period with preemption disabled for a period of 60 seconds:
# echo preemptoff > /sys/kernel/debug/tracing/current_tracer
# echo 0 > /sys/kernel/debug/tracing/tracing_max_latency
# echo 1  > /sys/kernel/debug/tracing/tracing_on
# sleep 60
# echo 0  > /sys/kernel/debug/tracing/tracing_on
The resulting trace, heavily edited, looks like this:
# cat /sys/kernel/debug/tracing/trace
# tracer: preemptoff
#
# preemptoff latency trace v1.1.5 on 3.14.19-yocto-standard
# --------------------------------------------------------------------
# latency: 1160 us, #384/384, CPU#0 | (M:preempt VP:0, KP:0, SP:0 HP:0)
#    -----------------
#    | task: init-1 (uid:0 nice:0 policy:0 rt_prio:0)
#    -----------------
#  => started at: ip_finish_output
#  => ended at:   __local_bh_enable_ip
#
#
#                  _------=> CPU#
#                 / _-----=> irqs-off
#                | / _----=> need-resched
#                || / _---=> hardirq/softirq
#                ||| / _--=> preempt-depth
#                |||| /     delay
#  cmd     pid   ||||| time  |   caller
#     \   /      |||||  \    |   /
    init-1       0..s.    1us+: ip_finish_output
    init-1       0d.s2   27us+: preempt_count_add <-cpdma_chan_submit
    init-1       0d.s3   30us+: preempt_count_add <-cpdma_chan_submit
    init-1       0d.s4   37us+: preempt_count_sub <-cpdma_chan_submit

[...]

    init-1       0d.s2 1152us+: preempt_count_sub <-__local_bh_enable
    init-1       0d..2 1155us+: preempt_count_sub <-__local_bh_enable_ip
    init-1       0d..1 1158us+: __local_bh_enable_ip
    init-1       0d..1 1162us!: trace_preempt_on <-__local_bh_enable_ip
    init-1       0d..1 1340us : <stack trace>
Here, you can see that the longest period with kernel preemption disabled while running the trace was 1,160 microseconds. This simple fact is available by reading /sys/kernel/debug/tracing/tracing_max_latency, but the trace above goes further and gives you the sequence of kernel function calls that lead up to that measurement. The column marked delay shows the point on the trail where each function was called, ending with the call to trace_preempt_on() at 1162us, at which point kernel preemption is once again enabled. With this information, you can look back through the call chain and (hopefully) work out if this is a problem or not.
The other tracers mentioned work in the same way.
If cyclictest reports unexpectedly long latencies you can use the breaktrace option to abort the program and trigger Ftrace to obtain more information.
You invoke breaktrace using -b<N> or --breaktrace=<N> where N is the number of microseconds of latency that will trigger the trace. You select the Ftrace tracer using -T[tracer name] or one of the following:
-C: context switch-E: event- -
f: function -w: wakeup-W: wakeup-rt
For example, this will trigger the Ftrace function tracer when a latency greater than 100 microseconds is measured:
# cyclictest -a -t -n -p99 -f -b100