Quantitative Reasoning Practice Set 1
Numbers
All numbers are real numbers.
Figures
The position of points, lines, angles, and so on may be assumed to be in the order shown; all lengths and angle measures may be assumed to be positive.
Lines shown as straight may be assumed to be straight.
Figures lie in the plane of the paper unless otherwise stated.
Figures that accompany questions are intended to provide useful information. However, unless a note states that a figure has been drawn to scale, you should solve the problems by using your knowledge of mathematics, not by estimation or measurement.
Directions
Each of the following questions, 1–8, consists of two quantities, Quantity A and Quantity B. You are to compare the two quantities and choose
- if Quantity A is greater
- if Quantity B is greater
- if the two quantities are equal
- if the relationship cannot be determined from the information given
Common Information
In a question, information concerning one or both of the quantities to be compared is centered above the two quantities. A symbol that appears in both quantities represents the same thing in Quantity A as it does in Quantity B.
-
-
Quantity A Quantity B The number of distinct ways to form an ordered line of 3 people by choosing from 6 people The number of distinct ways to form an unordered group of 3 people by choosing from 10 people - Quantity A is greater.
- Quantity B is greater.
- The two quantities are equal.
- The relationship cannot be determined from the information given.
-
-
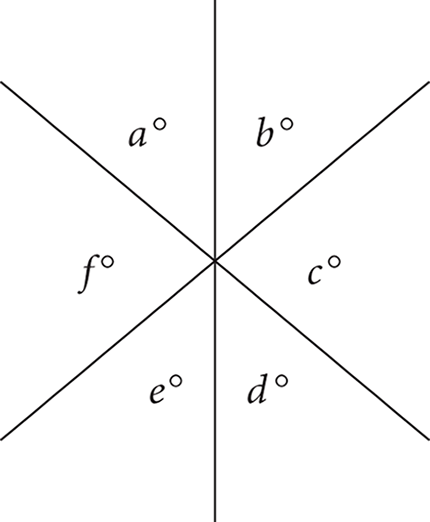
Quantity A Quantity B a + c + e b + d + f - Quantity A is greater.
- Quantity B is greater.
- The two quantities are equal.
- The relationship cannot be determined from the information given.
-
7p + 3 = r
3p + 7 = s -
Quantity A Quantity B r s - Quantity A is greater.
- Quantity B is greater.
- The two quantities are equal.
- The relationship cannot be determined from the information given.
-
The original cost of a shirt is x dollars.
Quantity A Quantity B x The cost of the shirt if the original cost is first increased by 10% and then decreased by 10% - Quantity A is greater.
- Quantity B is greater.
- The two quantities are equal.
- The relationship cannot be determined from the information given.
-
There were x dictionaries in a bookstore. After
 of them were purchased, 10 more dictionaries were
shipped in, bringing the total number of dictionaries to 52.
of them were purchased, 10 more dictionaries were
shipped in, bringing the total number of dictionaries to 52.
Quantity A Quantity B x 50 - Quantity A is greater.
- Quantity B is greater.
- The two quantities are equal.
- The relationship cannot be determined from the information given.
There are n people in a room. One-third of them leave the room. Four people enter the room. There are now
 of the original number of people in the room.
-
Quantity A Quantity B n 20 - Quantity A is greater.
- Quantity B is greater.
- The two quantities are equal.
- The relationship cannot be determined from the information given.
-
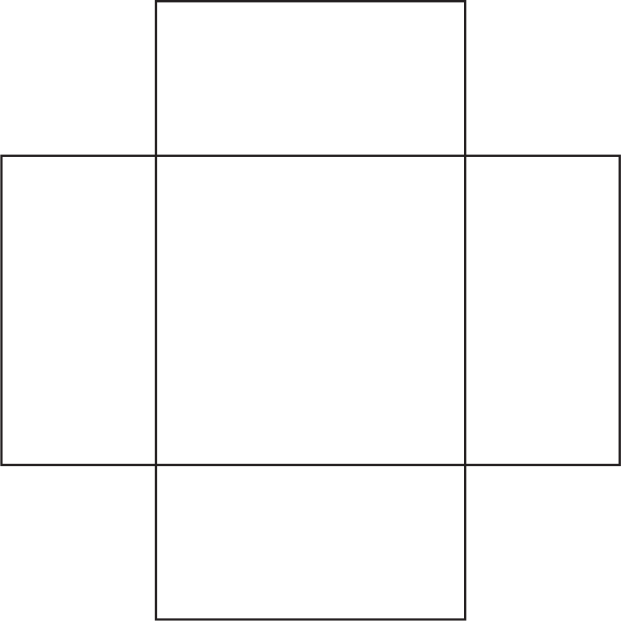
Note: Figure not drawn to scale.
-
Quantity A Quantity B The perimeter of the figure, in meters 16 - Quantity A is greater.
- Quantity B is greater.
- The two quantities are equal.
-
x is an integer.
1 < x < 9
Quantity A Quantity B 

- Quantity A is greater.
- Quantity B is greater.
- The two quantities are equal.
- The relationship cannot be determined from the information given.
-
-
-
If
 and x + y = 15, which of the following is greater than
y?
and x + y = 15, which of the following is greater than
y?
Indicate all possible choices.
-
-
The product of two integers is 10. Which of the following could be the average (arithmetic mean) of the two numbers?
Indicate all possible choices.
- −5.5
- −3.5
- −1.5
- 1.5
- 3.5
-
Which of the following is greater than the sum of the distinct prime factors of 210?
Indicate all possible choices.
- 12
- 17
- 19
- 21
- 24
-
The average (arithmetic mean) bowling score of n bowlers is 160. The average of these n scores together with a score of 170 is 161. What is the number of bowlers, n?
bowlers
-
Set T consists of five integers: the first five odd prime numbers when counting upward from zero. This gives set T a standard deviation of approximately 3.71. Which of the following values, if added to the set T, would increase the standard deviation of set T?
- 11
- 9
- 7.8
- 4.15
- 3.7
-
-
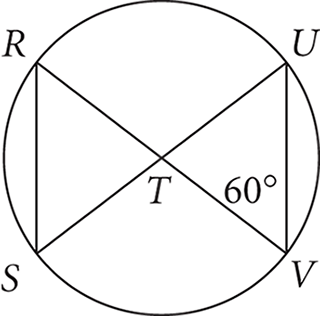
The circle shown has center T. The measure of angle TVU is 60°. If the circle has a radius of 3, what is the length of segment RS?
- 2
-

- 3
-

-

-
What is the probability of rolling a total of 7 with a single roll of two fair six-sided dice, each with the distinct numbers 1–6 on each side?
-
-
If it takes three days for 10 workers to finish building one house, how many days will it take 15 workers to finish four houses?
days
-
-
-
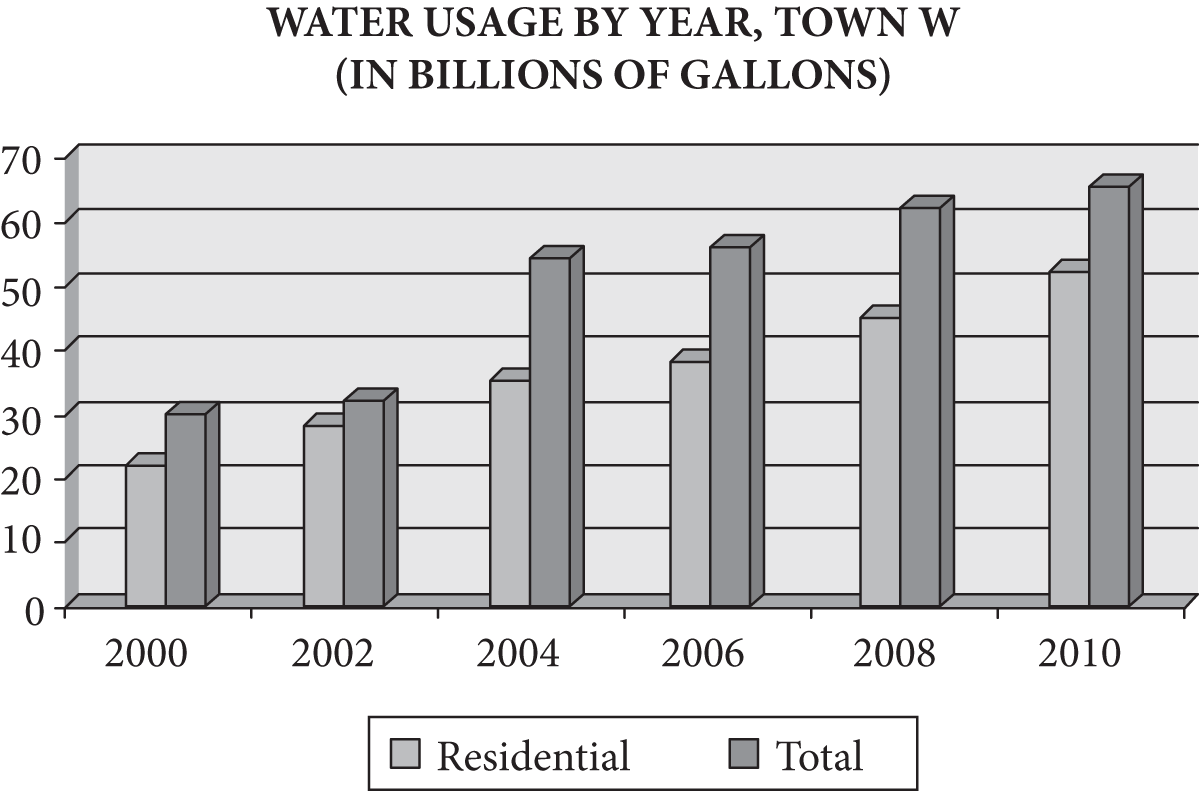
Questions 17–20 are based on the following graph and table.
-
DAILY WATER USAGE STATISTICS (with efficient appliances and good maintenance) Use Gallons per Capita Showers 9 Clothes washers 10 Toilets 8 Leaks 4 Faucets 11 Other 4 -
-
Which best describes the range (in billions of gallons) for residential water consumption from 2000 to 2010, inclusive?
- 10
- 20
- 30
- 40
- 50
-
In the year in which total usage exceeded residential usage by the least number of gallons, approximately what percent of total usage was residential usage?
- 68%
- 75%
- 88%
- 95%
- 98%
-
In 2004, only 10,000 residents of town W lived in homes with efficient appliances and good maintenance. How many gallons per day were used by these residents for the three daily household purposes requiring the most water?
- 110,000
- 160,000
- 270,000
- 300,000
- 460,000
-
Households with efficient appliances and good maintenance can reduce water consumption by about 35%. If half of the residential consumption in town W in 2010 was by households with efficient appliances and good maintenance, how many gallons of water (in billions) were saved that year?
- 5
- 14
- 40
- 52
- 65
-
-


