
6
FAST WATER
At the age of twenty-seven, Henry Stommel was adrift. As a young scientist, he had a strong, intuitive sense of the importance of choosing good problems, but he didn’t yet know what the right problem—scientifically speaking—might be. On the advice of a colleague at Woods Hole Oceanographic Institution, where he worked, he read a paper on hydrodynamics, the study of how water moves. This was a welcome piece of pure science, absent the military objectives that had dominated wartime work and which had disturbed him. It was a promising start. Soon after, at a dance hall in New York, he was introduced to Carl-Gustaf Rossby, who had established the department of meteorology at the University of Chicago (and met a young Joanne Gerould) during the war. This meeting was more decisive, a nudge in a direction he might otherwise not have traveled.
The world was small enough that the dance hall meeting resulted in an invitation to spend a semester in Chicago at Rossby’s lab. He listened to Rossby lecture in a style that appealed to him. Though Stommel was uncomfortable with simple certainties, he was not afraid of simplicity itself. Rossby made bold physical simplifications in his drive to understand atmospheric motions, and this boldness appealed to Stommel. It may have had something to do with a chance event in his life. Stommel himself thought so. As a teenager, due to a typographical error, he received a prescription for eyeglasses that were much too strong for him. He could not read or see the blackboard easily and learned to compensate by seeking out problems with relatively few components, problems that he could easily ponder with what he called his mind’s eye.
FIG. 6.1. Henry Stommel thinking with pen and paper, c. 1950. Photo by Jan Hahn. © Woods Hole Oceanographic Institution.

FIG. 6.2. Henry Stommel was a maker, here hammering something c. 1950. Photo by Jan Hahn. © Woods Hole Oceanographic Institution.
The problem Stommel now decided to think about was why the major currents in the world’s oceans are asymmetrical. Simple as it sounds, no one had yet thought to ask this question, though the phenomenon had long been observed. In every major ocean basin of the globe, the currents are stronger on the western than the eastern side.1 This fact holds true in the Atlantic, the Pacific, and the Indian Ocean even though those basins have strikingly different coastlines and ocean floor landscapes. Topography could not account for it, so what, wondered Stommel, could? Remembering Rossby’s boldness, Stommel imagined an ocean that was rectangular, straighter and simpler even than a bathtub. He then perturbed it only with a few variables—wind stress at the top and friction at the bottom—and added in the effect of the rotation of the earth on the waters within. He painstakingly hand-calculated the effects of these simple variables on his even simpler ocean, completing his calculations with a slide rule. He discovered, to his surprise, that this simple model of the ocean reproduced the crowding of streamlines on the west. He wrote this up in a paper that was five pages long. It was called “The Westward Intensification of Wind-Driven Ocean Currents.”2
He was not yet twenty-eight years old, and he had just created a new science, dynamical oceanography. It was concerned with understanding how the waters of the oceans move. What Stommel had shown is that it is possible to describe the large-scale movements of water in the ocean using physics and mathematics. He had done so without a PhD, a fact about which he was for some time self-conscious, despite the advice he received from elder oceanographic statesman Columbus Iselin, director of WHOI. He’d written to Iselin asking for advice about whether he should pursue an advanced degree. Iselin replied that “If you are set in making a professional career in the geophysical sciences, I doubt that a PhD is worth a cent to you. In so far as it would take you time to earn, it would, in fact, cost you good money.”3 The movements of the ocean could be, at least in certain respects, deduced from very simple physical laws. This is how Stommel described it, many years later: “There is a great hydrodynamical machinery of the ocean” that “governs how the flow of the water responds to the winds that drive it at the surface and to the differences of density that are sustained by climate at different latitudes.”4 In other words, a good mechanic can hope to understand what it is that makes the oceans move.
Stommel believed in the existence of this machinery. He believed it was possible to describe the ocean according to the laws of fluids in motion. But—and this is an important if rather a subtle point—he didn’t believe that insights into the oceans could be deduced from such laws. The laws were too general, and the ocean too complex. He believed that the only way to achieve understanding was by a leap of insight followed by a process of exhaustive iteration. He called the leap a “seed image,” something that he had to invent from somewhere that lay beyond analysis, beyond even language. The iteration is the relationship between this image and something Stommel called reality, for which he took observations of the ocean to be an acceptable proxy. He saw this as a process of crystallization, or, more accurately, of trying (and mostly failing) to get crystals to form. Once he accumulated enough ideas about a particular problem, but had achieved no great insight, he went into an almost trancelike state. He described this state in his memoir. In order to achieve insight, he wrote, “I defocus my mind, to deliberately lose it all, to melt the fragments of ideas into something akin to a hallucinatory vision. In effect, I try to raise the conceptual temperature to some equilibrium value where structure disappears for a few days, and then try lowering it to see what crystallises out.” Rarely was one round enough. Once an image was achieved, he then tested it against observations of the actual ocean. What he wanted to know was whether the image from his mind helped generate the right kind of ocean, the ocean that was actually observable and whose motions it was possible to measure.5
* * *
Henry Stommel had grown up near the sea, in Brooklyn and on Long Island. He had studied mathematics and astronomy as an undergraduate at Yale, and when he graduated in 1942, he had registered for the draft as a conscientious objector. Despite his objections to war, he was assigned to teach the mathematics needed for navigation to other young men being prepared by the navy’s accelerated V-12 training program to serve as officers, a task he ended up enjoying despite its military setting. When the war ended, he enrolled in the divinity school at Yale, but he soon realized that he was no more comfortable with the certainties offered by religion than he was with those offered by war.6
Then, in 1944 he took a job as a researcher at WHOI. His undergraduate education and his experience as a teacher on the navy’s training course had equipped him enough to get him a job at what was then a small but fast-growing institution. He did varied bits of research, but nothing really captured his attention. He was adrift. And there he might have remained, but he was lucky (he was fond of saying so himself). He had come of age at a time and a place when the public was interested in sponsoring scientific research. It was also, not incidentally, a time when the military was pouring vast amounts of money and resources into the sciences that could tell them how to safely fly and land airplanes and how to hide (and detect) submarines at sea. He was lucky, most immediately, to be surrounded by others who took a benevolent interest in him.
Appropriately enough, his first address in Woods Hole was the old rectory house for a local church, a generous building with plenty of room for a rotating assortment of live-in bachelor oceanographers. On the walk from home to work, Stommel could see the harbor, and he checked each morning to see whether the boats were still safe at their moorings. Life was both small and large, occupied by domestic amusements (of a bachelor flavor) and outsized adventures on the waters of the Atlantic that teased the shores of Cape Cod. The house in which he lived was itself a kind of ship. In it, the lines between work and life were blurred. A prankish atmosphere, full of punning and physical humor, reigned. This was a new kind of freedom: the conjunction of like-minded but differently skilled souls, each a specialist in his own area, sharing a passion for the ocean.
He also spent time on real ships, on the seas around Woods Hole and beyond. By his own admission he was an unadventurous sailor and a rather inept seaboard technician, trying to take temperature readings aboard a small ship in the icy winter seas off the Gulf of Maine, mostly in vain. He was not sure what the measurements were for, and he was not confident that they were accurate. The bathythermograph, the instrument then used for taking the water temperature, was itself intemperate, full of mechanical faults. Stommel tried mostly to stay out of the way of the men and the heavy instruments they deployed over the side of the ship. Despite his inelegance, he loved both the idea of being there and, for as long as he could stomach it, the being there as well. He developed a belief, which stayed with him throughout his life, that to know the ocean required spending time on it. He believed it was possible to develop a physical intuition for the water, a gut sense of how it moves, even on scales incommensurate with human experience. Seagoing was also a social activity; he got practice in working with many different kinds of people, and getting along with most of them. “Work at sea rubs off the sharp edges, and makes us better people,” he later wrote.7
Woods Hole in those years was a little utopia of scientific research. Money from the Office for Naval Research (ONR) poured in, the legacy of oceanography’s great wartime contribution and testament to the need to maintain expertise in the ensuing Cold War. During short trips out to sea, Stommel studied the upper layers of the ocean, trying to work out the patterns of hot and cold that enable submarines to hide in the acoustical shadows made when water bends sound. The pacifist in Stommel flinched at the thought of contributing directly to violence, but he saw the practical need for knowledge that could help in defense of his country, and the funds offered by the ONR in aid of a basic physical understanding of the ocean came with few strings attached. To refuse the opportunity to learn more about the ocean would have been perverse.
With the results of his five-page paper on wind-driven currents in mind, Stommel traveled to Britain in 1948, mimeographed copy of the paper in hand, to see what he could learn by observing rather than theorizing the ocean.8 While his mind’s eye had led him to imagine the effect of the rotation of the earth on the movements of a planet’s worth of water, he was also driven to understand the disorder in the ocean. For this, he needed to start on a considerably smaller scale. He set out to knock on the door (this is almost, but not literally, true) of a man who had studied the behavior of fluids when they break down into turbulence at a range of scales, from the smoke that rose from chimney pots to seeds set loose on the wind and balloons that rose above excited crowds in Hyde Park and Brighton, fluttering tags which members of the public were encouraged to send in once the balloons eventually fell to earth. From these sorts of observations, this man, Lewis Fry Richardson, had come up with a deceptively simple equation that described the speed at which objects in a turbulent fluid separate.
Richardson’s interest in turbulence arose in tandem with his dream—dating to the early 1920s—of achieving what he called “weather prediction by numerical process”; in other words, of predicting the future by crunching numbers. To do so meant coming up with mathematical equations that described the motion of the atmosphere. This included accounting somehow for the ways in which the movement of air was obstructed, and thereby disordered, through contact with vegetation and mountains at the surface, and through the collision of masses of different kinds of air—hot, cold, wet, and dry. Richardson was aware of the importance of atmospheric turbulence even as he recognized that to make any kind of weather forecast, he would have to dramatically simplify the weather of the planet, to make it fit into imaginary squares which he used to order the globe. Within these squares, 200 kilometers to a side, all messy turbulent phenomena were reduced to a single number.9
Some thirty years after Richardson had first envisioned numerical weather prediction as a far-off dream, Stommel traveled to visit him. Richardson had devoted the latter part of his life to understanding not natural systems, but human ones. A pacifist like Stommel, he had tried to use mathematics to explain why arms races happen, and why they unfold the way they do. This he considered more important than understanding how the turbulent fluids of the planet behave. But he had consented to join Stommel for a late return back into the nature of physical, rather than human, systems. Previously, Richardson’s observations had been limited to the motion of the atmosphere. The question Stommel and Richardson both wanted to answer now was: How similar is the ocean to the atmosphere?
They did a watery version of the experiments on diffusion in the air that Richardson had performed two decades earlier using balloons and other objects. Stommel would remember for years to come the damp, heavy soil in the garden from which, on the suggestion of the older man, he dug up the parsnips—parsnips!—and the cold room in which he and Richardson worked together, slicing and weighing the vegetables, before they cycled down to the loch together. There, they walked to the end of the pier and dropped them into the water and tracked the speed at which they separated, using an ad hoc bit of equipment Richardson had worked up out of bits of wood and string to provide some means of accurately gauging the distance traveled by the vegetables.
Their choice of parsnip as experimental apparatus is telling. If you drop a parsnip into the ocean, its buoyancy is such that it will float low in the water, with just a sliver of itself protruding above the waterline, unaffected by the wind. Floating freely and easy to see, humble parsnips make good oceanographic measuring devices. When given the choice of a simple, robust approach versus a complex, relatively fragile one, Richardson—and Stommel—both chose the former. Later in life, Stommel frequently commented on his own perceived lack of mathematical skill and the effect it had on his working practices. “When I contemplate the superb skills of some of my colleagues as mathematicians, as instrument designers, as masters at squeezing information out of masses of data, as scholars of encyclopedic knowledge, as scientific administrators with considerable power of decision, I realize how limited and amateurish my own ideas are,” he explained. “Therefore when I get an idea, I simply have to pass it on to someone else who has the skills to develop it. That’s not really generosity—it is just being practical.”10 Though he could be defensive about his limited mathematics, he also welcomed the way it forced him to simplify the questions he asked—as well as to seek collaboration with others.
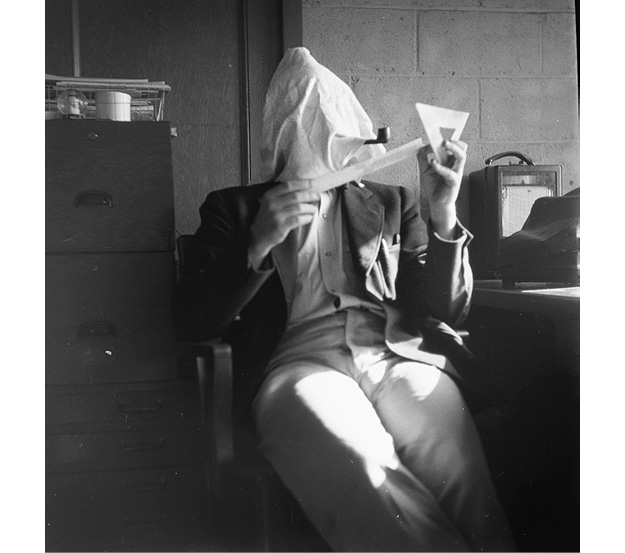
FIG. 6.3. Henry Stommel, “oracle” mathematician. Though he was self-conscious about what he felt were the limits of his mathematical skills, he credited them with forcing him to simplify problems. Photo by Jan Hahn. © Woods Hole Oceanographic Institution.
Richardson was less conflicted. He spent his life seeing beyond the limitations that hemmed others in. The power of his imagination outstripped, by far, the power of any contemporary computational abilities when he imagined a great human machine for numerical weather prediction. He estimated that some 64,000 computers—then the only such kind were human beings—would be necessary to make it work, but such detail did not daunt him. He imagined something extraordinary which would eventually come to pass: a means of predicting the future state of the atmosphere based on a knowledge of its current state and a finite set of equations that would describe the motions of its particles.
He recognized that some features of the weather would need further study. It was not yet possible, he knew, to reduce all the features of the atmosphere to simple equations. He therefore envisioned experiments that would be ongoing—in the basement of the great meteorological theater—to study the motions of eddies, large spirals of whirling water that spun out from and eventually pinched out of major ocean currents, such as the Gulf Stream. Turbulence was too important, and too fascinating, to ignore. At the same time, it was possible—even necessary—to begin the task of crunching the numbers before waiting for turbulence to be fully understood. Richardson set about understanding turbulence by observing it, first with balloons and trails of smoke, then with thought experiments, and finally with Stommel at the end of the pier.
Together, the two men dropped forty-five pairs of parsnips off the end of the pier, and watched which way they went, hoping to understand what happened as they traveled farther away from each other. Based on what they observed of the bobbing parsnips in the Scottish loch, they concluded that energy diffused in the loch water according to the same principle as it did in the atmosphere. The results they achieved recall a paper Richardson had published nearly thirty years earlier, in 1920, describing the counterintuitive possibility that eddies acted like “thermodynamic engines in a gravitating atmosphere,” which added, rather than dissipated, energy from the system.11 The paper they published together is today remembered as much for the peculiar audacity of its first line—“We have observed the relative motion of two floating pieces of parsnip”—as for its conclusion that the atmosphere and the ocean exhibit similar forms of turbulent diffusion.12 It is important to note that scale mattered to the final result. What happens in a bathtub’s worth of water differs significantly from what happens in the loch, and what happens in the ocean again would require an even larger leap.
It was Stommel’s Gulf Stream paper, rather than the parsnip paper, that would galvanize the field. It stimulated new work on that most familiar of ocean currents, work that would lead in turn to further understanding of the circulation of all the water in the oceans. The questions raised by Stommel’s parsnip collaboration with Richardson about the role of turbulence in ocean circulation would have to wait considerably longer until they could be addressed. They lay in wait, aspects of the movements of water that could neither be solved nor ignored, like a shadowy creature whose exact dimensions are not understood, and which is only glimpsed in fragments. In the meantime, Stommel’s mind’s eye ranged freely across scales, considering the basin-wide gyre of water of which the Gulf Stream is a mere component and the relatively tiny motions that force those parsnips now this way, now that. It would take time, years and even decades, but eventually those twinned images of the ocean, at the very large and the very small scale, would be brought together once again, not only in Stommel’s mind’s eye, but in the minds of his fellow oceanographers. Then the seemingly quixotic attempt to map the motion of parsnips on a Scottish loch would be revealed as a step in the global understanding of oceans. For now, this all lay in the future.
* * *
Pressures in the ocean are almost unimaginably great. They are the reason that the depths of the ocean remain nearly as hostile and unfamiliar a place as the surface of the moon. Just ten meters of water provides the equivalent of an entire atmosphere’s worth of pressure. The pressure at two kilometers below sea level is two hundred times greater than that of the atmosphere at sea level. This pressure is also the reason that it took so long for the discipline of oceanography to catch up with what any individual sailor knows in the gut: that water moves quickly and in ways that are somehow both ordered and chaotic. Experienced sailors know which currents run where, and what kinds of winds are to be expected in a given region, and they also know that the sea is a surprising and fast-changing place. What they know relates to but cannot directly access what lies below. For that, both instruments and ideas are needed which can connect a ship at the roof of the ocean to the mysteries that lie below.
For a long time, an ocean congruent with the felt experiences of sailors—an ocean that moved in the sometimes chaotic ways they reported—did not emerge from the descriptions of those who tried to study the oceans on the large scale. For most of human history, the ocean was accessed by the ship’s sail and by a sounding line dropped over its side and a variety of instruments deployed at the end of it. Navigation on the surface of the ocean and penetration to its depths were possible but limited by the buffetings of wind and current. Bottles strewn on the surface gave a very rough idea of the speed of the very top layer of the ocean, but no instrument could go deep and stay there. Saltwater, pressure, strong currents, and wildlife conspired to render most instruments useless. Added to these problems was the basic difficulty of tracking and recovering an instrument that might be sent to flow with the currents. Under these circumstances, measuring the flow of deep water directly was impossible. Without the right tools, almost nothing was known about the depths of the ocean for most of human history. The result was that those who studied the oceans assumed that nothing of much import was happening deep below.
Despite these limitations, there were many aspects of the water that could be sampled. A key episode in the history of the study of ocean currents was the moment in 1751 when Henry Ellis, captain of an English slave ship, noticed that if he sent a bucket down deep enough when the ship was in warm waters near the equator, it was full of cold water when brought back to the surface. The only explanation for how such cold water could be found in such permanently warm places was that it had somehow traveled there from colder places—from the far north or the far south. In 1798, Benjamin Thompson (also known as Count Rumford) published an essay titled “Of the Propagation of Heat by Fluids,” in which he noted that quite unlike freshwater, which begins expanding once it reaches four degrees Centigrade and continues to do so until it freezes, seawater contracts as it cools, right up to the point at which it freezes. Cold saltwater, Rumford saw, would be very dense, dense enough to sink to the depths of the ocean. The idea of a closed circulation—one that returned on itself—seemed to follow directly from the physics of freshwater. Rumford argued that the sinking of cold water in the ocean implied a circulation, or a current, consisting of the equator-ward flow of cold water and a corresponding and opposite flow at the surface.13 The surface winds, which had so long been seen as the main force in moving the oceans, seemed to pale in significance to the great masses of water moving according to their density.
Much later, in the 1860s, William Carpenter, a physiologist searching for new species of crinoids (feathery echinoderms that were found to live at great depths in the ocean) in the North Atlantic, noted an area between the Shetland and Faroe Islands where warm and cold deep waters were found in close proximity. He developed a theory of what he called “general oceanic circulation,” where the emphasis was squarely on the first word (to distinguish it from local circulation). His “magnificent generalization” was that the waters of the globe moved around the entire planet. Carpenter’s idea was that cold water that sank at the poles was continually replacing the warm water that was transported north by currents like the Gulf Stream. Similar movements could be inferred in the Southern Hemisphere.
Not everyone agreed. James Croll, the Scottish autodidact who had come up with a grand theory to account for the ice ages, had strong opinions about the relative importance of wind or density to account for the movement of the oceans. His theory of the ice ages depended on the imbalances in the earth’s climate brought about indirectly by very long-term changes in the eccentricity (or shape) of its orbit. For his theory to work, he needed wind to be a significant driver of ocean circulation. He argued that as ice built up at the poles as a result of feedback effects, the trade winds would also strengthen and therefore push the Gulf Stream farther to the north, adding even further to the cooling effect that had been triggered by changes in the earth’s orbit. Due to insufficient evidence, Croll and Carpenter’s disagreement about whether it was winds at the surface or the deep motion of dense water that held the key to ocean circulation reached a temporary stalemate.14
By the 1870s, mechanical instruments that could withstand the monumental pressures at depth and the corrosive effects of seawater made it possible to accurately measure how warm, how salty, and how deep any particular spot in the ocean was. In a laborious series of surveys, tens of thousands of observations were made, starting with the British expedition aboard the Challenger ship of 1872–1876. At the time the most expensive and comprehensive voyage ever undertaken for the purpose of studying the ocean alone, the Challenger and her crew spent four years traveling 130,000 kilometers (70,000 nautical miles) around the globe. Fifty years later, the German Meteor expedition made an even more systematic survey of a smaller portion of the world’s oceans. Zigzagging between South America and Africa fourteen times, they covered a similar distance to the Challenger.15 Soon, even the treacherous waters of the southern ocean began to be measured, thanks to the efforts of the British Discovery expeditions.
Challenger, Meteor, and Discovery: the names say it all. These were single-ship operations. No matter how long and ambitious the journeys they made, the outcome of their expeditions was constrained by the simple fact of having been made by a sole ship. Measurements were by necessity taken one after another—serially—and only after the expeditions finished were they were brought together. By plotting the records of temperature and salinity on a map, lines could be drawn between the dispersed data points. These lines traced what were assumed to be the contours of actual bodies of water in the ocean, masses of water defined as having the same properties. But these maps performed a sleight of hand. By combining in a single image observations that had been made years and sometimes decades apart, they created pictures of the ocean that gave the appearance of being snapshots of the ocean at a particular moment. In fact, they were idealized—and, in a very real sense, therefore imaginary—average bodies of water, based on measurements widely separated in both time and space.
These atlases suggested the ocean was a very orderly place. Great tongues of water were revealed to be spreading across the ocean. By studying these slablike masses while keeping in mind the basic properties of water—that cold water sinks and spreads and that salty water is heavier than fresher water—it was possible to guess how the water might be flowing. These guesses were the hard-won product of thousands of hours of surveying. They gave specific contours to the theoretical movements of deep water that men such as Rumford and Carpenter had described in the nineteenth century. On the scales of time and space that these expeditions were able to measure, the ocean was a stable place in which certain large-scale features, such as the Gulf Stream and the world’s other western boundary currents, stood out. Water in this averaged ocean acted more like cooling lava or even solid rock than a fast-moving liquid. There was no drama in these deep waters: nothing like the hurricanes and squalls whipped up on the surface, nothing equivalent to the thunderstorms, fronts, and cyclones of the atmosphere. Instead, there was the slow ooze of cold water as it moved across the ocean floor at a distinctly funereal pace—decades, hundreds, and even thousands of years were needed before much would change. Time passed slowly. Any features of the ocean smaller than several hundred kilometers across and shorter in duration than several hundred days could be (and were) easily missed from one data point to the next. The absence of these phenomena from the data led many to assume they must be absent from the oceans themselves.
This image of a slow and steady deep ocean was a product of inference. Taking the information that was available to them about the ocean—primarily the readings taken by the single-ship expeditions that had been compiled into atlases—oceanographers had used the basic rules by which physicists described the motion of fluids to infer the machinery of the ocean. It was impossible to do as Stommel did and iterate their inferences with reality, that is, with observations, simply because very few such observations existed. As late as 1954, a one-page table could easily list every such series of measurements ever made, the longest of which showed only the periodic changes associated with the tide and was therefore useless for understanding currents. The Meteor expedition had made its current measurements by dropping a meter overboard and attempting to keep the ship as still as possible above it—a tricky maneuver that produced unreliable results. The data they collected had indicated some deep waters that moved more quickly than would be expected based on the so-called dynamical method. But these measurements could still be explained according to the old paradigm of a deep ocean that was, on average, sluggish. (“Even when determinations of deep currents, based on several days’ observations, are not in agreement with the deductions by indirect methods, it does not necessarily follow that either is wrong,” wrote one analyst of such data.)16 Measurements at the surface sometimes revealed small-scale features—swirls and eddies—which suggested movements that stood out boldly from the average currents expected in the area, but these minor anomalies did not seem significant enough to put the slow-motion entire ocean machinery into question.
Sometimes evidence emerged that seemed more forcefully to contradict, or at least to complicate, this image of the deep ocean as a lifeless and nearly motionless place. Sailors occasionally pulled up from the depths strange and wonderful creatures that previous theories of an abyssal oceanic dead zone had declared impossible, feathered crinoids waving like Alice in Wonderland phantasmagoria, barnacle-encrusted samples of the first telegraphic cables to stretch across the Atlantic, witnesses to a strange underworld which still had mysteries to surrender. Jarring bits of data were also pulled up from the deep, when thermometers brought to the surface showed warm water where cold was expected, salty when fresh was in order, and vice versa. If plotted, these bits of data interrupted the smooth contours of the water slabs, grains of grit in a vast oceanic oyster shell. These anomalies were not entirely ignored by oceanographers. Small-scale, random-seeming currents were clearly represented on a map of Norwegian sea surface currents that was created in 1909 by eminent Norwegian oceanographers Bjorn Helland-Hansen and Fridtjof Nansen.17 In hindsight these messy squiggles seem important. At the time, they generally did not. Often they were dismissed as mere noise in the data, a result of kinks in the instruments, mistakes made by those who tended to them. Sometimes they were viewed as accurate but simply irrelevant measurements. Such small-scale and supposedly short-lived phenomena were assumed to have little effect on the larger circulation. The alternative—that small-scale phenomena might influence large-scale circulation—was more or less unthinkable to oceanographers who observed the ocean at the time.
Theoreticians also had their reasons for believing that turbulence on the small scale was unlikely to be a driver of ocean circulation. Since Osborne Reynolds had first identified the moment at which a flow of water transitioned from smooth to disordered motion, turbulence had been understood as a phenomenon by which energy dissipated out of a system. In this view, turbulence was important because it acted as a brake on the system, allowing energy to dissipate “down gradient,” into ever smaller scales until the energy was evenly dispersed throughout the system. It is this idea that Lewis Fry Richardson captured in his memorable poem, included as a frontispiece in his 1922 book setting out the possibility of numerical weather prediction. “Big whorls have little whorls which feed on their velocity,” summarized Richardson, “And little whorls have lesser whorls and so on to viscosity.”18 The idea that there might be significant interaction across disparate scales—that turbulence might “skip” from big whorls to lesser whorls without stopping at the middle whorls, or, more provocatively, that energy might travel “upwards” from relatively small-scale motions in the ocean back into the largest scales—was pretty much as anathema to theoreticians of fluid dynamics as it was, for different reasons, to seagoing oceanographers.
* * *
Stommel knew very well the limitations of the data. For the moment, there was little he could do directly about it. What he could do was keep thinking about the ideas in his westward intensification paper. Missing from his first stab at the problem was any acknowledgment of how differences in the density of the deepest waters of the ocean contribute to its circulation. Like others before him, he had concentrated only on the wind. Thinking about it more deeply, he realized that the same physical logic that explains the crowding of streamlines at the surface of the western side of the ocean basins, streamlines caused by the action of wind, would also produce currents beneath them running in the opposite direction. He made the rarest of things: an oceanographic prediction. A southward current, never before detected, should be found beneath the northward-flowing Gulf Stream. His prediction relied on the forcing action of wind on the surface as well as the movements of deep water according to its density. For the first time, the forces that moved the water at its surface and in its deepest abysses—forces about which Carpenter and Croll reached an unbreakable stalemate in the 1860s—were joined in a single theory. Stommel united wind at the surface and differences in temperature and salinity in the deep to create a machine of ocean.
In doing so, he changed the way oceanographers think.19 Instead of considering the Gulf Stream an independent and isolated oceanic phenomenon, similar to the flow of water gushing from a garden hose (which is how even Rossby thought of it), he imagined it as one part of a rotating gyre of water that spans the entire Atlantic basin. In a sense, what Stommel did is to show that the Gulf Stream doesn’t exist separately from a basin-wide system, that it could only be fully understood as an aspect of a larger system. The payoff for this large-scale thinking was that the Gulf Stream—and the whole basin-wide system—became mathematically and physically explicable. But the cost of this insight was that henceforth the ocean would need to be considered as a whole. In revealing the hydro-machinery of the ocean, Stommel had also made a case for the interconnectedness of its parts.
His papers were both a challenge and a gift to those who cared to read them and recognize what they meant. Not everyone did, for they came in a deceptively modest package and spoke in a language that was, oceanographically speaking, new. For those who were listening, he had opened things up. Two things followed from these papers and the ideas behind them—one, a blossoming of theoretical interest in models of the ocean, and two, a series of expeditions designed to test these theories. These were related but separate developments. There was between them something of the iteration that Stommel had described as central to his own creative thinking. The dance between ideas about the ocean and observations of it had sped up.
New pictures would be drawn, some like Stommel’s—big and bold as a Rothko painting. Unlike the old atlases, the images that the theoreticians who approach the problem now came up with portrayed a much more active ocean. Water was moving not simply according to its density, but thanks largely to the effects of the wind. But for all their innovations, for the way forces were now directly enrolled in the quest to describe the oceans, these models were still constrained by the imaginations of those who created them. Those imaginations, fed on the data collected by mechanical devices (based in some cases on technology more than one hundred years old), still observed a sluggish ocean. So the theoreticians were bound to provide what was, in essence, a new explanation for an old description of what the ocean looks like. It was an ocean that was still sluggish, sticky and, to use the technical term, laminar: layered with neat slabs of water.
Thanks to Stommel’s 1948 paper and the subsequent theoretical work that it inspired, the idea that the ocean was a moving fluid whose motions could, in theory, be explained by the physics of fluid dynamics had been established. But—and here was the rub—physics remained inadequate to deduce the motions of the ocean. The ocean was too big and too complex for the equations—and the computational capacity—of the time. (It remains, in many respects, too big and too complex even today.) Stommel’s successful prediction of a deep boundary current is still the exception rather than the rule. New mental images, new oceanographic seeds, are usually generated not by the ferment of physical theories but by new observations. And those observations only become possible when clever people come up with new ways to measure the ocean.
The pictures of the ocean made by the observers in the years following Stommel’s 1948 paper looked like pointillist portraits from which most of the dots had been erased. They were both (relatively) precise and fragmentary. They were made not out of the imagination but out of hours spent on ships and in workshops—making devices, tinkering with bits of metal and wire to see if something could be made robust enough to withstand the terrible pressure of the deep ocean and the pernicious effects of salt and water and yet remain sensitive enough to make useful measurements. These images, which seemed so limited to begin with, would eventually be the ones from which a whole new understanding of the ocean would arise. In 1950, just two years after the parsnip visit and the publication of Stommel’s westward intensification paper, the first expedition designed to scrutinize the Gulf Stream using multiple ships at the same time got underway. This expedition marked the start of twenty years of exploration that would fundamentally transform our image of the ocean from a slowly moving slab of treacle to a turbulent fluid.
Like the Wyman/Woodcock expedition, the background of the two men responsible for the expedition (dubbed Operation Cabot) says a lot about the values it embodied. Fritz Fuglister was trained as a painter and was working as a muralist on WPA-sponsored projects on Cape Cod when he joined WHOI as a research assistant to work on drafting charts. He had even fewer formal oceanographic qualifications than Stommel did—precisely none—but that had not stopped him from bringing his intelligence to bear on the question of how to make the ship and its allied equipment a more powerful oceanographic instrument. Val Worthington was another so-called technician lacking advanced academic degrees.20 In 1961, they would appoint themselves as members of SOSO, the Society of Subprofessional Oceanographers, in acknowledgment of their collective lack of professional degrees. (Stommel was the third and only additional member of this society.)
Using six ships and a set of recording devices that could measure pressure and temperature at greater depth than ever before, Fuglister and Worthington mapped the Gulf Stream over the course of ten days. They took temperature measurements simultaneously aboard the different ships, a coordinated effort that paid off when they happened upon a pronounced meander of the stream south of Halifax. They spent the final ten days of the expedition tracking this meander. As they did, they watched it extend south until it eventually pinched off from the Stream, forming a ring of fast-moving cold water—an eddy. It was the first time anyone had ever observed such a phenomenon unfolding in real time.21
Looking back, this moment appears to be a clear milestone—the first definitive sighting of an ocean eddy and therefore the “discovery” of weather in the deep ocean. The data Fuglister and Worthington gathered would eventually force oceanographers to consign their image of a sluggish ocean to the dustbin. At the time, the data was simply ambiguous. What Fuglister and Worthington had managed to do was record a single sighting of an elusive and still very mysterious phenomenon. Question marks festooned the results. Of these, the most pressing was to determine how representative a single eddy associated with the Gulf Stream was. It was possible such eddies were to be found only near powerful, fast-moving western boundary currents like the Gulf Stream. It was also possible, however, that the entire ocean could be laced with them. No one knew which was the case.
More data were needed to feed the iterative process of theorizing and observing. To collect that data, more and better instruments were required. So too was a big enough frame of reference. Fuglister and Worthington had relied on luck and a device called the smoked-glass-slide bathythermograph, a tool for recording temperature at depth, as well as the new system of long-range navigation based on radio waves, called loran. As lucky as they had gotten in finding and tracking their eddy, it still seemed almost impossible to measure currents at the depths and scale necessary to build up a good enough understanding to begin to relate site-specific measurements to a general theory of ocean circulation. Getting enough observations at deep enough locations spread out across the relevant area remained a major technological hurdle for which existing instruments were inadequate.
Stommel unleashed his imagination on the problem—envisioning a system of underwater devices that would operate like meteorological radiosondes, floating with the underwater currents the way such balloons float on currents of air.22 Tracking the floats would depend on hearing them, and for this he imagined a timed explosion, a sort of underwater bomb that would alert listening devices to the location of the floats. This was an inventive but ungainly idea and, luckily, before he needed even to attempt to convince others of its practicability, Stommel discovered that someone else had come up with a simpler, more elegant solution to the problem. His name was John Swallow.23 Using scavenged scaffolding tubes and a vat of caustic chemicals to thin them to precise thicknesses, Swallow was able to devise a tool sturdy enough to withstand the ocean depths but delicate enough to be adjusted (using ballast) so that it could achieve neutral buoyancy. Like an air balloon that could be made to hover at any altitude with the right combination of sandbags and hot air, Swallow imagined long floats that could be balanced to float in the ocean at predetermined depths. Instead of bombs he used a simple electronic circuit to create a ten-Hertz signal—a noise at a precise frequency—that could then be tracked by a pair of hydrophones on a nearby ship.
Swallow initially set up big tubs of water in the stairwell of the building where he worked, so he could carefully weigh and adjust his floats as necessary. By 1957, he was taking the floats out to sea. With Val Worthington, he went hunting for the deep countercurrent that Stommel had predicted would be found underneath the Gulf Stream.24 The data Swallow managed to collect were not as clean as they needed to be to settle the matter. Even if the measurements indicated that there was a countercurrent below the Gulf Stream, it was impossible to know what this meant for global currents. The big question which Stommel and many others now wanted to answer was whether such motion could be observed in the depths of the mid-ocean, the places that were supposed to be the sleepiest, and most stable, of all.
Soon, more and better results were acquired. In the summer of 1958, Swallow went hunting again, this time for deep currents in the eastern North Atlantic off the coast of Portugal. He thought he could detect currents as slow as a millimeter a second, roughly the speed of the sluggish deep waters of the oceans.25 Strange results began to appear as soon as he started to measure. Floats were found to move ten times faster than expected and to change directions abruptly. Two floats 2.5 kilometers deep and just 25 kilometers apart moved at dramatically different speeds, one ten times faster than the other.26

FIG. 6.4. John Swallow preparing one of his neutrally buoyant floats for deployment, as the ship’s cat observes. Credit: Archives, National Oceanographic Library, National Oceanography Centre, Southampton, UK.
So strong was the prevailing belief that deep currents are weak that even in the face of these measurements, a second expedition was designed on the assumption that only slow-moving currents will be found at depth. This is important because the ships that were needed to track the floats could not refuel fast enough (they had to return to harbor to do so) to find them if they went much faster than one centimeter per second. In late 1959, using a ninety-three-foot ship called the Aries, Swallow and others set out to study the mid-ocean, in the Sargasso Sea west of Bermuda. The first readings that they managed to take indicated something extremely surprising. Expecting to find evidence once again for the deep northward flow that Stommel had predicted, they found something else. It looked like there were unexpected numbers of fast-moving eddies beneath the surface, swirling vortices of water some 100 kilometers wide with velocities some hundred times faster than expected. (Luckily, the crew was able to change its approach to gathering data so that the ship could keep up with the floats.) Not only were the currents faster than expected, but they also seemed to increase in speed the farther down they were measured. Nothing in Stommel’s theories had predicted, or could easily explain, such a result.27 Not only had eddies been found in the north Atlantic, they were more powerful than had been imagined.
The tail was starting to wag the dog. What had been noise had gotten so loud it was now impossible to either ignore or explain according to the old model.28 Counting the number of eddies—the original research question—was one thing. Determining how important these eddies were in the larger ocean circulation was another challenge altogether. The time had come when it was possible to try to determine what exactly was happening beneath the surface. There was a distinct possibility that the Gulf Stream might be less significant, energetically speaking, than the eddies it threw off, an unlikely physical state that would temporarily reverse the otherwise relentless dissipation of energy to ever smaller and smaller scales. It would be the oceanographic equivalent of unscrambling eggs, of a cup of coffee getting warmer rather than colder. The only way to see these eddies more clearly, and to therefore understand them better, was to find a way to measure them more thoroughly.
In the ocean, resolution is a matter of both time and space. The biggest challenge is to observe multiple locations in the ocean simultaneously. This kind of view—called synoptic—was pioneered by meteorologist Robert FitzRoy in the 1850s when he linked coastal observers via a telegraphic network. Some 120 years later, oceanographers were finally on the cusp of doing the same for the ocean. The task was much harder not only because the ocean is a wild and unforgiving place to live and work, but because water is so much denser than air. As a result, it packs much more turbulence into an equal area, and that turbulence—the eddies—lasts much longer than storms in the atmosphere. Ocean eddies are roughly a tenth the size of atmospheric storms, and they last weeks and even months instead of days.
The task that now faced Stommel was to understand how eddies fit into the large-scale structure of the ocean. “We are not interested in describing these eddies in isolation,” he wrote in a piece intended to serve as a wake-up call to oceanographers, “we are concerned with discovering whether they play a significant role in driving the large-scale circulation. Is there interaction of eddies and large-scale circulation in the ocean as there is in the atmosphere?”29 What, for example, is the relationship between these newly discovered underwater storms and the large-scale circulation of the ocean? Do eddies work to dissipate energy, to counterintuitively add energy back into the system, or do they do a bit of both? Stommel had demonstrated that the ocean was susceptible to simple physical explanations. He had given the burgeoning field the confidence to start drawing—sketching—a representation of the movements of the ocean. And he insisted that to know the ocean it must be observed repeatedly, with patience and determination.
For the past twenty years, the way scientists had imagined the atmosphere and the ocean had differed dramatically. The atmosphere had become, thanks to the network of radiosondes, and to the work of Joanne Simpson and others, a turbulent, fast-changing environment. The ocean had remained, in theoretical terms, remarkably still: a “steady smooth flow,” in contrast to the “highly non-linear fluid-dynamical flow, with large eddies [storms] playing an essential and dominant role.”30 It was time, argued Stommel, to determine once and for all whether the ocean was as nonlinear in its motions as the atmosphere. The questions Stommel and Richardson had investigated on the loch were about to be explored on a much bigger scale. “We anticipate that the eddies will be found to play a dominant role in the dynamics of the ocean circulation,” predicted Stommel, “and that our whole theoretical concept of ocean currents, developed over the past twenty years, will be changed.”31 It was a risky undertaking that threatened to consign to the dustbin the hard-won theories on which many of the participating scientists had worked, but “if anybody was going to correct or demolish our old theories, we wanted to be the ones who did it.”32
The best way to determine the answer to this question was not, as Stommel made clear on numerous occasions, to set up a vague and unfocused survey that would passively gather data. “After all,” explained Stommel, “anyone can sprinkle dots on a map of the world and call it a plan for future measurement.”33 To really understand the ocean would require a series of experiments with clear hypotheses to test and protocols for assessing their outcome. The planners called the project MODE, for Mid-Ocean Dynamics Experiment. Every word of that tidy acronym was a signal of the reach of its ambitions: to bring motion and the methods of physical experiments to a part of the ocean that had previously evaded observation. The name was a sword to slay the legacy of the descriptive atlases of the kind produced by the Meteor that even in the 1970s still haunted oceanography. For this was, quite self-consciously, an experiment—not a survey, not a series of hydrographic stations, but an experiment. The well-defined question this experiment sought to ask was “Do eddies exist on this scale in the deep ocean?” and it set out to do so in a similarly well-defined length of time.
Stommel had identified the “problem” of experiment in oceanography as early as 1963, when he’d written an important paper for Science, titled “Varieties of Oceanographic Experience,” in a sly reference to William James’s classic study on religion. In it, he had made the case for considering every oceanographic expedition as a scientific experiment (“if we regard an expedition as a scientific experiment, then we must propose to answer certain specific questions . . .”),34 and for taking careful account of the range of scales on which the ocean varies—its varieties of experience. The ocean, it was becoming more and more clear, varied across an astonishing range of time and space. Designing good experiments—experiments that had the possibility of yielding definitive results—meant taking careful account of just what kind of variety existed in the ocean. As the initial results from Aries had made clear, it wasn’t possible to simply use statistics to average out energy in the ocean across convenient scales. Answering particular oceanographic questions—say the variation in sea level in a particular ocean basin—would require asking questions at the right scale. To this end, Stommel included a diagram which served as a visual index of the range of scales on which energy varied in the ocean, from the hundreds of meter-long gravity waves that lasted just minutes to the tidal variations that happened on a daily and monthly basis, to meteorological effects that transpired on similar scales with much less regularity, to the mammoth variations, occurring over thousands of years and thousands of kilometers, that constituted the ice ages. This diagram was classic Stommel—a deceptively simple tool for ordering complexity. It was both a map of the energy of the ocean and, as Stommel tried to argue, should also be a road map for oceanographers if they ever hoped to catch the most meaningful oceanographic phenomena with the instruments at their disposal. Though the task seemed overwhelming, if matters of scale received their proper due, Stommel thought there was reason to hope that in the future “theory and observation will at last advance together in a more intimately related way.”35
Working alongside colleagues including Carl Wunsch, Francis Bretherton, and Allan Robinson, Stommel developed a plan to catch an eddy in the ocean.36 If the holes in the experimental net were too big, an eddy could pass through it undetected. Too small, and they would only see a fraction of it. The entire ocean was, from Stommel’s point of view, neither more nor less than a problem in what he called hydrodynamics—the movement of water—on a scale “larger than a laboratory, smaller than a star.” Similarly, an eddy was an object of definite size (though what size precisely they could only guess) to which appropriately scaled detectors would need to be directed.37 Stommel and colleagues determined that a parcel of ocean approximately 300 kilometers square, stretching from the surface to a depth of roughly four kilometers, would be the right size. Like a hunter waiting for its quarry, the scientists would have to set up a trap of detectors and then simply wait, and hope that an eddy would pass in the time allocated to the experiment.
They reckoned it would take six ships, two airplanes, dozens of moorings, neutrally buoyant floats, free-fall velocity profilers, air-current dropped probes, and 121 pressure gauges arrayed on the ocean floor to capture the eddy.38 To create such a complex system of instrumentation and monitor it during the study would require the coordination of fifty oceanographers from fifteen institutions, including, for the first time, modelers who would be integral to the design and execution of the project.39 The experiment itself would last four and a half months at a location between Bermuda and Florida. The experiment made use of a new kind of floating instrument—called SOFAR, for SOund Fixing And Ranging floats—that could be sent to specific locations in the deep ocean and moored there, taking measurements of the temperature, speed, and salinity of the water that flowed by them. At the same time, instruments were deployed to follow the currents in an area, floating freely.
If MODE was successful, it could be used to refine the most fundamental theories of the general circulation of the ocean, and would have a corresponding impact on the climate model that combined, or “coupled,” the ocean and atmosphere that had been published in 1969 by Syukuro Manabe and Dick Wetherald, at the GFDL at NOAA. Another hoped-for dividend was a better understanding of the ocean—including the possible discovery of the ocean’s “weather”—that would improve forecasting for the kinds of weather that affected people on land and at sea. The plan was bold, and the timing seemed auspicious. There was consensus among those whose voices mattered that this was a worthy use of time and money. Nevertheless, there was real uncertainty about whether it would be successful. It was entirely possible that the “eddy trap” they laid would fail to catch anything.
A film made at the time captures the uncertainty (and copious facial hair) of the moment. Scientists sit scattered across a lawn, seemingly performing oceanography in the open air, relaxed, engaged, and egalitarian. “We may all be retired before something’s happened,” cautioned one scientist, while another worried they might find nothing at all. Deciding where to site the experiment required the scientists to make assumptions about how the oceans operated that the experiment itself was designed to test. There was thus real uncertainty not only about the kind of results that would emerge but about whether anything at all would be measured. A crucial decision concerned whether the experiment should be centered over a relatively flat piece of ocean or a rocky piece of ocean. The answer depended on how much you thought the landscape of the ocean floor—its topography—affected the mixing of the water above it. To what extent could any piece of ocean give the results that oceanographers were hoping for? Carl Wunsch, for one, suggested that “There is no such thing as a typical piece of the ocean, every piece of the ocean is different.” When someone countered that the experiment could be centered at the boundary between a rocky and a smooth ocean floor, Wunsch replied that “maybe nobody’s going to be satisfied with that compromise.” The men laughed, but Wunsch wasn’t really joking.40

FIG. 6.5. Early sketch of instrumentation for the Mid-Ocean Dynamics Experiment. The experimental area measured 300 miles square and four kilometers deep. On the seafloor, 121 pressure gauges were arrayed with thirty-mile spacing, to be augmented by three to four moored hydrophones and a set of pinging constant-level floats floating at four different depths. These physical systems were to be augmented by a “computer-numerical-model” for prediction of float positions to enable the experiment to be tracked and adjusted in real time. Source: Memo from Henry Stommel, August 11, 1969, Mid-Ocean Dynamics Experiment records, AC 42 Box 2, Massachusetts Institute of Technology Institute Archives and Special Collections, Cambridge, MA. Courtesy of Institute Archives and Special Collections, MIT Libraries.
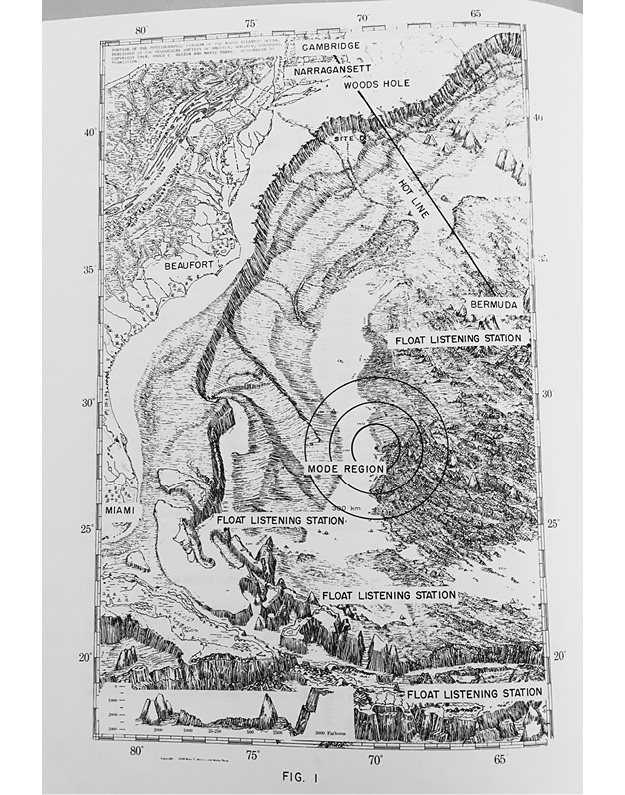
FIG. 6.6. The MODE research zone, straddling an area of smooth and rough ocean floor topography. Source: MODE-1: The Program and the Plan, March 1973, Mid-Ocean Dynamics Experiment, AC 42, Box 1, Massachusetts Institute of Technology Institute Archives and Special Collections, Cambridge, MA. Courtesy of Institute Archives and Special Collections, MIT Libraries.
Eventually, the MODE team compromised on a location in the Atlantic (the Pacific was never an option, for reasons that were primarily logistical), choosing a spot that was both rocky and smooth. The experiment itself ran remarkably smoothly, making use of special “hot-line” phones that enabled the on-ship scientists to communicate with a headquarters. The only major setback was the disappearance of the central mooring, a hazard of leaving large pieces of equipment unsupervised in the open sea but a puzzling disappearance nevertheless.
The audacious plan paid off. An eddy was found and tracked. MODE showed that eddies were common and widespread and, most importantly, contained a staggering ninety-nine percent of all the kinetic energy in the ocean. Eddies, in this sense, were the dark matter of the oceans, until MODE revealed that oceanography had been missing the biggest story of all. The mysteries of turbulence and flow were beginning to be fully revealed, if not yet solved—or resolved.
That was a clear success. Less clear-cut was what the legacy of MODE would be for oceanography. MODE had “established a reputation as one of the most tightly run field programs ever, much to the dislike of some of the participants,” a writer for Science noted. The need for consensus on planning among such a large group meant that, as one scientist put it, “on sticky points, we would take people into the back room and intellectually beat each other into agreement.”41 This was a far cry from the intellectual independence that Stommel had so appreciated. The success of MODE broadcast to the wider world that oceanography could now operate on big scales, with big budgets and dozens, if not hundreds, of researchers working together. It was, as the Science article put it, “big science, new technology.” But with institutional heft came what many lamented as the loss of individual freedom, and the success of the project was a source of deep ambivalence for many of those who had participated in it. Francis Bretherton, a theoretician who clearly enjoyed the chance to participate directly in a field experiment, nevertheless remarked that “it would be disastrous if the success of oceanographic big science persuades people that it is the only way to do things.”42
MODE created new ways to think about energy and motion in the ocean. It also, and just as fundamentally, created a whole new way of doing oceanography. Dozens of scientists from several countries had collaborated for an intense and short-lived moment in which an enormous amount of data was generated. For Richardson, for whom the image of a massive calculating organization, consisting of some 64,000 human computers, represented a utopian fantasy, such data would have signaled the arrival of a long-hoped-for future for meteorology. Whether he, an intensely independent-spirited man, would have liked to actually live in such a brave new world is unknowable. Stommel was there to see the day arrive and found himself recoiling from both the administrative pitfalls of big projects and the use of brute force rather than physical theories to crack oceanographic problems. For him, scientific breakthroughs were an intensely personal achievement. “Breaking new ground in science is such a difficult process that it can only be done by an individual mind,” he wrote in a cri de coeur titled “Why We Are Oceanographers.” “For some of us, this is the main attraction of doing scientific work. In this respect, it is like the art of painting or musical composition or poetry . . . it all begins with an individual’s choice of medium, choice of theme and style and subject.”43
Stommel sought to maintain and celebrate the contribution that a single individual (or a group of like-minded individuals choosing freely to work together, as upon an idealized ship expedition) could make to the biggest questions about the ocean. He believed that the biggest questions about the ocean—how it circulated on the basin scale or even the global scale—were accessible only to the best individual minds. But he needed data, not too much or too little, but just enough. To get the data required organization, grant-writing, logistical planning, all of which threatened to consume the time needed for thinking and doing science. The paradox was that the bigger Stommel’s ideas about circulation got, the more he needed data to test them, and the bigger the projects got. He could not repeat the 1948 achievement, when he essentially deduced the Gulf Stream from a few equations.
The success of MODE was a source of abiding ambivalence for Stommel. MODE made it possible, even necessary, to think about the old sluggish ocean in an exciting new way. It also raised the possibility that the kind of science that he loved—driven by mental pictures and intense collaboration with a few individuals—would become increasingly difficult to justify. This was a transitional moment, when the discipline stood poised between the old ways (already the object of nostalgia), when it had been possible for individuals to make their own destiny, scientifically speaking, and the future, in which oceanography would be defined by its large projects rather than the ideas of its individual practitioners. This had not yet come to pass, but with MODE, Stommel saw the metamorphosis beginning.
* * *
Stommel concluded that the best way—the only way—forward was to “take up various oceanographic phenomena separately as though they were mutually independent (which of course they are strictly not).”44 To study the machinery meant taking it apart, conceptually, all the while remembering that the machine only functions when it is whole. The questions raised by MODE, in other words, could only be answered with other experiments similar to it which could probe different elements of the ocean system. And so, despite his deep, almost constitutional, misgivings about the new “bigness” of oceanography, Stommel continued to involve himself in projects similar in scale to MODE, including a follow-on project, a contentious collaboration with the Russians, called POLYMODE. The pace with which these new experiments occurred was intense. Between 1973 and 1978, a total of nine field experiments were planned, an entire alphabet soup of acronyms from MODE to GARP, NORPAX, JASIN, CUEA, SDO, INDEX, ISOS, and GEOSECS.
Thanks to these experiments, it became clear through the course of the 1970s that the answer to the question of where eddies existed was relatively straightforward. Almost everywhere people looked, they found eddies.45 Eddies in the North Pacific. Eddies in the Arctic. Eddies in the Indian Ocean. Even eddies in the Antarctic. The question become not where eddies were, but where they weren’t. By 1976, John Swallow was wondering whether there was any place in the ocean from which they were absent. It appeared there was not, and this fact, added to the energy that they contained, made it conceivable that eddies were not incidental to ocean circulation but essential to it.46
Near the Gulf Stream, rather than decreasing the energy of the Gulf Stream, eddies seemed to be adding to it. In other words, the viscosity of the eddies—that is, the extent to which they acted as a brake or drain on the energy of the system—was found to be negative. Looking at the data, a theoretical oceanographer named Peter Rhines wrote that it was possible to see that “the small eddies have coalesced to form a few lazy gyres. This is just the reverse of the result for totally chaotic, three-dimensional turbulence in which energy is degraded into smaller and smaller eddies until ultimately being lost to viscous smoothing.” Given this surprising and counterintuitive coalescence of eddies, Rhines noted that it would be necessary to rethink our understanding of how turbulence functioned in the ocean. The classic example used to explain turbulence—a cup of tea into which milk has been stirred—was no longer a reliable model. “Clearly the ocean is not a teacup,” concluded Rhines, “and energy put into eddies and intense currents cannot simply flow out of the system into minuscule eddies and thence be dissipated by viscosity.”47
If eddies were adding energy to the system rather than enabling it to dissipate, then any description of the circulation that simply ignored them (because they were too small to see) would be fundamentally inadequate. Whatever theories existed for explaining the large-scale circulation were suddenly much less secure. Joanne Simpson and other meteorologists had already covered this ground (so to speak), in the air. It had taken roughly fifty years, beginning at the turn of the century, for them to realize that storms in the atmosphere were not merely a means by which the system threw off excess energy. Instead, they came to understand that storms—what we would call “weather”—in fact feed energy back into the system and affect climate on the largest of scales. Rhines imagined what the implications of negative viscosity in the ocean would be for a world circulation. “Eddies, if fast enough, can gang up to drive a systematic flow. It is just possible that the ocean works as a sort of Rube Goldberg device, with the wind driving a strong circulation that breaks down into eddies; the eddies then drift off and radiate into the far reaches of the ocean, where they recombine to drive new elements of circulation. Models of this sort are now being explored.”48
Personally, Stommel worked hard to reconcile the need for collaboration in order to answer the “big and difficult” problems posed by the ocean with his desire to keep oceanography a bureaucracy-free zone. He characteristically found inspiration in the ocean itself. “We are beginning to see spontaneous and fluid groupings of oceanographers,” he declared hopefully, in a document written for just the sort of government program he might have wished to steer clear of, “whose aim is to grapple with certain long-period and large-scale phenomena in the ocean.” These eddies of researchers come together for time-limited events—called “experiments”—which “the scientists involved expect to carry out themselves.”49 Little autonomy would be lost if these groupings could somehow be relied upon to spontaneously form and dissipate. Though MODE was “a form of Big Science,” he hoped it could be just a temporary form, summoned into being for a “particular job and dissolved in a few years when that job was done.”50 The contrast with studies that, as Stommel put it, “depend on large volumes of data gathered in routine fashion by governmental agencies” could not have been stronger. If Stommel was polite enough to acknowledge that both types of investigation were useful, it was more than clear on which side his sympathies (and creative energies) lay.

FIG. 6.7. Henry Stommel in conversation with George Veronis. Photo by Vicky Cullen. © Woods Hole Oceanographic Institution.
All of this research took a toll on Stommel, who was central to the planning of almost all of it and the implementation of a significant portion of it. Stommel, who was accustomed to publishing up to six papers a year (often with coauthors), published nothing at all between 1974 and 1976. It didn’t help that he had been living since 1960 in a self-imposed exile from WHOI, first at Harvard and then for fifteen years at MIT. He had left WHOI in the year that Paul Fye had taken over the directorship of the Institute, having found it impossible to work under him. With Fye in charge, the wolves of bureaucracy seemed to be circling ever closer. This period of creative drought only ended when Fye retired, and in 1978, after eighteen years, Stommel finally felt he could return to his intellectual home at Woods Hole. Then, in his words, “I gave up teaching and all administration and began to live again.”51
* * *
All of these anxieties about both the changes in how oceanography was practiced and the possibility of understanding the ocean globally were to a certain extent internal to the field of oceanography, reflecting its particular disciplinary history and the coming-of-age of the postwar ambition to create a physical science of the ocean. By the early 1970s, in oceanography as in meteorology, new external pressures were beginning to play a decisive role. The military applications of oceanography that had garnered it funding and prestige during and after the war were, by the 1970s, increasingly being supplanted by the climate-predicting utility of oceanography. By 1974, there was a growing awareness that it would not be possible to understand changes to the earth’s atmosphere as a result of rising carbon dioxide without understanding the ocean as well.52 It was incumbent upon oceanographers to determine how “to make progress toward building their oceanic part of the model,” according to a National Research Council panel on “The Role of the Ocean in Predicting Climate.”53 A steering committee, chaired by Stommel, was set up to investigate the “large-scale ocean-atmosphere coupling (particularly as they relate to the ocean’s effect on climate).”54 The models to which Rhines had referred in his report on the role of eddies in the general ocean circulation were numerical computer models, which had, by the 1970s, assumed a central role in the way climate variability was investigated. At the end of the decade, the National Research Council appointed a committee, which came to be known as the Charney Committee, to consider the role of rising carbon dioxide and major climate change. Stommel was one of three oceanographers in the group. Their report made some guesses about future global mean temperatures and noted strongly that much remained unknown about the ocean’s response to atmospheric warming, its uptake of carbon, and its thermal memory.55
The drive to consider the ocean as part of a global climate system coincided with the possibility of seeing the earth from space. Such a prospect had been seriously considered ever since 1960, when the TIROS series of weather satellites had returned the first images of cloud patterns taken from space. Oceanographers realized that if satellites could one day provide them with sufficiently accurate measurements of sea surface elevations (to within around fifty centimeters), it would be possible to map the location of ocean currents from space because these currents are warmer than surrounding waters and cause the ocean to bulge upward. Fifteen years later, what had once seemed like science fiction became a reality. In 1975, Geos 3 provided the first comprehensive picture of the ocean geoid, the bumpy average sea level that would be visible if the effects of tides and waves could be magically subtracted from ocean surfaces, leaving only the variable effects of gravity on the ocean. To prove that the data from Geos 3 was good, scientists used it to find a so-called “cold core ring” or eddy, which had been compared with data collected from buoys in the sea, aircraft in the skies, and infrared (versus altimetrical) readings from satellites.56 In 1978, the picture from space got sharper still when SEASAT provided even more precise sea surface readings, revealing the presence of the Gulf Stream.57
In addition to the new global visions of the oceans that satellites seemed on the cusp of being able to deliver, there was another global ocean that seemed well within reach. This was the global ocean created by the climate modeling community, a fast-growing group of researchers who relied upon advances in computing power to enable them to calculate ever more finely resolved numerical models of the earth, in which the grid which was laid down, numerically, over the earth, became ever tighter. These models held the promise for a new kind of global knowledge in which physical equations mimicked the actions of real water. Without data from the actual ocean with which to check—or calibrate—these models, however, they risked becoming elaborate fictions with no connection to reality. Unlike the velveteen rabbit, the models demanded not love but data to make them real.58
The same year that Stommel helped chair the NRC panel on ocean-atmosphere coupling, a meeting was held in Miami by a new group called the Committee for Climate Change and the Ocean. The question of the ocean’s role in climate had become increasingly pressing, thanks to the work of the modelers who demanded data to calibrate their tools and to the growing understanding of scientists working in a range of climate-related disciplines that the earth’s climate was a global and coupled system, of which the ocean was a critical component. Building on this growing awareness, oceanographers and other researchers met in Miami to consider climate change and the oceans. There, Carl Wunsch suggested that in order to understand the ocean’s contribution to the climate, it would be a good idea to at least try to measure the ocean circulation globally.59 And so the stage was set for a new project that brought together two important groups of researchers, whose fates would henceforth be intertwined.60 The project brought together physical oceanographers studying the circulation of the ocean as a problem in ocean dynamics alongside newly christened climate scientists (inheritors to some extent of climatologists’ concern with average temperatures), who wanted to understand the relationship between the ocean and the atmosphere as it related to the uptake of man-made carbon dioxide.61
Like MODE, the new project was also an experiment—the World Ocean Circulation Experiment (WOCE). Also like MODE, it was a program designed to answer a particular question. It just so happened that the question was a big one: What is the nature of the world ocean circulation? The breadth of the question begged another one: Was WOCE really still an experiment, in the sense of a time- and process-focused singular event? Or, to get anywhere close to an answer about the world ocean, would it be necessary to set up a program on such a scale that WOCE would become a newfangled version of the old-style, observation-rich, theory-poor hydrographic surveys?
Stommel stayed well clear of WOCE. Though he had always been attuned to the ways in which theoreticians, modelers, and observers related to each other, and emphasized the need for close contact between them, the scale of WOCE was too big for him. With MODE, he felt, the size of the project had worked well. But when it came to larger undertakings such as WOCE, the connections between researchers, he feared, became necessarily more rigid and more problematic. The bigger the model, the more observations it required, and the more organization. The way MODE had functioned—“a loose association of individual investigators to raise the neighbor’s barn” is how Stommel put it—would not be sustainable over the time frames needed to support the longer-scale models. “If you think about joining one of these longer-term, big-scale things, you’re really sort of becoming an employee of a construction company. And that’s not very attractive to many of us. We’re a little bit scared of the long-term commitments that might be involved in programs like this.”62
It took roughly thirty years from the first planning stages until the data from WOCE had been fully analyzed. In the process, WOCE helped transform oceanography. In 1985, it had been hoped that WOCE would “provide the first comprehensive global perspective of the ocean as an element in the planetary climate system . . . the driving force for attempting a WOCE is the recognition that predicting decadal climate change will depend on accurate calculation of changes in the large scale flow of heat, freshwater and chemicals in the oceans.”63 It had achieved this, enabling a simplified but powerful quantitative estimate of the ocean’s role in transporting heat, which could be combined with that of the atmosphere to offer a model of the earth’s climate at the global scale.
As impressive as this achievement was, perhaps the greatest legacy of WOCE was to more meaningfully reveal the ignorance of oceanographers and what shape a program meant to ameliorate that ignorance might take. Pondering the future of their discipline in the early 1980s, while planning for WOCE was ongoing, Carl Wunsch and Walter Munk had written that “we can now appreciate the magnitude of the job facing oceanographers who wish to understand how the ocean ‘works,’ and who might one day hope to forecast changes in ocean conditions. The ocean is a global fluid, not unlike the atmosphere, and one wishes to observe the global system on all important space and time scales.”64 Envisioned as a snapshot of the ocean of unprecedented scope, WOCE engendered the felt need for a sustained program of global observation. It wasn’t a return to the old survey days but it was, in its own way, a return to the discipline of sustained looking. The difference was that as a result of rising concerns about climate variability, looking had become monitoring. The oceans could no longer be simply a place to search for knowledge (if they had ever been that). They had become a signal of a changing global climate that had to be monitored.
* * *
Stommel had hoped that WOCE would be the best of both worlds, a blend of the traditional and novel, between the comprehensive and the specific: a compromise between geographically oriented surveys and process-oriented experiments designed to test key physical hypotheses. “Perhaps,” he wrote in a heartfelt 1989 essay, WOCE “isn’t really Big Science at all—just an assemblage of the miscellaneous smaller projects that people would have wanted to do anyway.”65 This sounds like a man trying very hard to convince himself of something. He sounded more convincing when he considered the unknown scientists yet to come, young people who would challenge the accepted notions of his generation, who would risk their own predictions and who might once again remake the oceans in a new image. Whatever form science might take in the future, whatever organizations were deemed necessary to answer the questions scientists seek to pose, Stommel still believed that for any one individual who seeks to do science, it was the personal endeavor, the “wrestling match with some aspect of the universe,” that was the main challenge and central reward. “All alone, one confronts the unknown and divines some meaning from it. We sort the pieces and arrange them in new patterns.” In the ocean, as Stommel knew better than anyone, the pieces are innumerable, the patterns more infinite still.66
Given the depth of his feeling for what the personal experience of oceanography could be, it is more than a little jarring to listen to Stommel, in a recording made in 1989, sharing his thoughts on the relationship between science and faith. Rather than providing answers to questions that had previously been unthinkable, Stommel here describes science as limited in its scope. “It seems to me that science,” he says, “is really very restricted in what it can tell us about the world, how it can meet our needs, the things that we desperately want to know.” Just three years before his own death at the age of seventy-two, Stommel describes a visit to the deathbed of his friend and mentor Ray Montgomery (the man who had suggested to him back in 1947 that it might be worth considering why streamlines crowd on the west). Stommel asked Montgomery his thoughts on the meaning and wonder of life and what he thought it all added up to. Montgomery replied that his mind was closed on the subject. He offered neither Stommel nor himself any solace in the face of death, remaining steadfast in his refusal to seek the comforts of spirituality. The exchange made a deep and disquieting impression on Stommel.
If he did not himself reject spiritual values, Stommel was rigorous in separating them from his scientific activity. Though he had spent his life wrestling with—and finding great joy in—the mysteries of the universe as manifest in the ocean, at the end of his life he was adamant that it was dishonest to arrogate to science the kind of wonder long associated with religion. “We have ideas of reverence,” he said, referring to the way people sometimes thought of science as a kind of religion. “We get a great thrill out of going into Westminster Abbey and seeing Newton’s grave and Kelvin’s grave. I regard the library here [at Woods Hole] as some kind of a temple. Now what in the world do words like beauty and reverence and temple have to do with science as we know it?” he asked. “I don’t have an answer to that,” he replied, pausing before adding, “This is a subject which troubles me a good deal.”
By the end of his life, it seems that Stommel’s own desire for wonder had far outstripped his sense that science had any claim to provide it. There are echoes here of Tyndall’s compulsive revisiting of the idea that science produced wondrous things—including the human capacity for wonder—for no reason at all. But while Tyndall never failed to be satisfied with the wonder that his appreciation of nature produced, in Stommel’s remarks there is a sense that his frustration at the limits of science has outstripped his awe at the productions of nature.
Stommel was in agreement with Tyndall on this materialist point. Science was, he clarified, “like the instructions on a microwave oven.” It was “awfully dry and dead and unkind,” devoid of any of the moral and emotional value that gave human life meaning. The problem was not that science couldn’t deliver these things, but that we made the mistake of expecting it to. Science dazzles us with its successes, Stommel explained, “and then all of our hopes and wishes and anxieties somehow diffuse into it and then we talk about the beauty of science and our love of it and our reverence for it, and there isn’t anything like that in it at all as far as I can see.”
He hoped that the new limits to what science could hope to know—limits that he himself had helped uncover in the turbulence that lay within the very machinery of the ocean—might help recalibrate the place of science in our emotional landscape. Maybe, in other words, we could learn with time to expect not more but less from science, and to be better off as a result. “My own feeling about science is that for me it’s been useful as a diversion from more important things. It has been a measure of relief from getting crushed by wonder and anxiety. It’s a form of whistling in the dark.”67