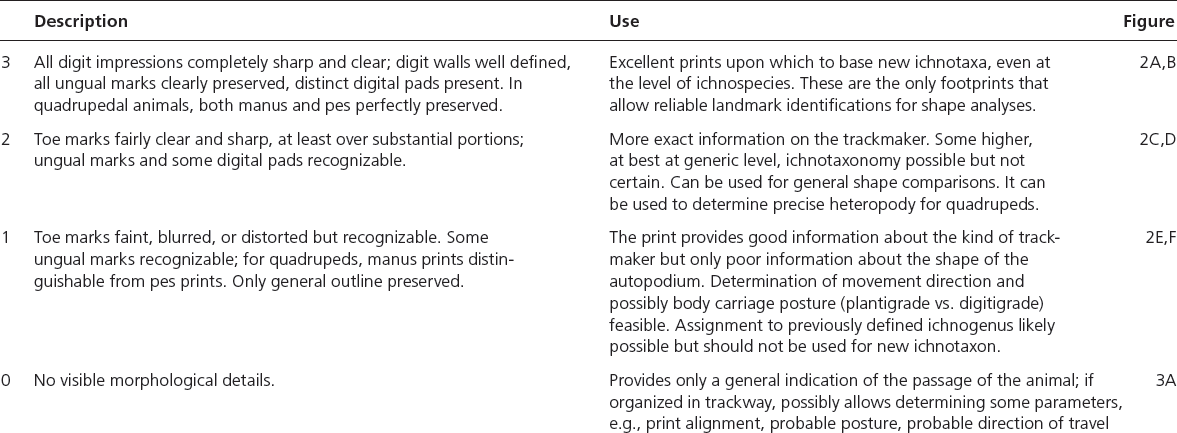
6.1. Photos of the emu tracks used to define Farlow’s (unpubl.) preservation scale. (A) Grade 1; (B) grade 2; (C) grade 3; (D) grade 4.
6.1. Photos of the emu tracks used to define Farlow’s (unpubl.) preservation scale. (A) Grade 1; (B) grade 2; (C) grade 3; (D) grade 4.
A Numerical Scale for Quantifying the Quality of Preservation of Vertebrate Tracks |
FROM ITS BEGINNING, VERTEBRATE ICHNOLOGY HAS described fossilized footprints in a qualitative, descriptive way. At the same time, considerable effort has gone into illustrating footprint morphology. In recent years, new technologies (e.g., laser-scanning and close-range photogrammetry) and methods (e.g., geometric morphometrics) have allowed more objective, quantitative approaches to vertebrate ichnology. However, quantitative shape analyses need to be based on data of high quality, and comparisons are best made between tracks comparable in quality of preservation. Thus, determining which footprints constitute the most reliable sample for quantitative analyses is fundamental for the progress of ichnology.
We introduce here a numerical scale to quantify the quality of preservation of vertebrate footprints, based on morphological details present in the prints. The numerical grades conceptually arise from theoretical assumptions about the fossil record, and also from experimental observations of footprints of the extant emu (Dromaius novaehollandiae). The numerical scale is ordinal in character, reflecting progressively better preservation of morphological details. Values range from zero (the worst prints, occurring only as aligned depressions) to three (the best preserved prints), plus some coded letters to specify the occurrence of certain morphological or preservational features (e.g., skin impressions).
Introducing this numerical scale will facilitate easier and faster comparisons among footprints, reducing the need to refer to drawings or photographs of the traces to assess their quality. This will make possible more accurate evaluation of the track record, with comparisons made only from the best preserved footprints. This scale could potentially be used when creating new ichnotaxa, which should be based on well preserved tracks (such as those with numerical values of at least two, for simple-shaped tracks). Morphometric analyses might likewise be restricted to prints of the same quality, because the results of such analyses are highly dependent on the preservation of the specimens analyzed.
INTRODUCTION
Vertebrate ichnology has usually been based on qualitative descriptions of specimens, from its beginning (e.g., Duncan, 1831; Hitchcock, 1836) to the most recent papers (e.g., Milàn, 2011; Lockley et al., 2012). This approach resulted in a very detailed lexicon (e.g., Leonardi, 1987; Thulborn, 1990) for morphological description of tracks and trackways, including some standardization of illustrations of morphological features through outline drawings, although some ambiguities and differences in techniques still remain.
In recent years, many research groups have introduced new, quantitative methods in order to update ichnology as a more mathematical, less descriptive discipline (Falkingham, 2012, and references therein); this has progressed through increasingly more common use of digitized models of specimens made with laser scanners and/or photogrammetric methods. In spite of their demonstrated weaknesses and strengths, these new methods result in comparable levels of resolution and accuracy (Remondino et al., 2010; Adams et al., 2010; Petti et al., 2011; Belvedere et al., 2012). These methods allow collection of digital data that are virtually identical replicas of the true specimen (submillimeter resolution is nowadays readily achievable). They also permit ichnologists to share objective three-dimensional (3-D) data and not just photos (whose objectivity is limited by lighting, the angle of the shot and, above all, interpretation) or interpretative outline drawings, the accuracy of which depends on many subjective factors (e.g., the experience of the person making the drawing, and light conditions).
Geometric morphometrics (i.e., landmark analysis [Rasskin-Guttman et al., 1997; Azevedo-Rodriguez and Santos, 2004; Belvedere, 2008]) is also taking root in ichnology, but, although its methods can be applied in new studies, its use with previously published data is difficult, because most of the figures and drawings in literature are generally too small and of too low resolution to permit recognition of clear landmarks. Moreover, the description of the track may not accurately represent what is figured, making it thus very dubious that prints of similar preservation are being compared. In fact, the main problem in the application of landmark analysis is identifying the same reference points among different tracks. Ideally this method should be applied to very well preserved tracks (“elite tracks,” sensu Gatesy, 2003) that preserve internal morphology (e.g., digital pad impressions) and not just a general footprint outline; comparing tracks of different quality can gives unreliable results. The study of the autopodium morphology, recorded in a footprint, gives numerous insights for the identification of the trackmaker, and thus for the evaluation of the (ichno)biodiversity. Through ichnotaxonomy, autopodium morphology may provide clues about the global distribution of certain taxa that can be used for paleobiological and paleogeographical considerations.
Table 6.1. Schematic descriptions and possible uses of the preservation grades
In this light, by “preservation,” we mean the record of morphological features that can be related to the anatomy of the trackmaker’s autopodium. Whether the diagnosable features of a footprint are due to the rheological features of the substrate or to the weathering of the lithified surface is not the aim of this scale; the purposes of the application of quantitative data for morphological and taxonomical purposes, in fact, are independent from the variable occurring in the track formation.
For the same reason, footprints with a great potential for biomechanical studies may not reach a high value in the proposed scale, as the features preserved are not sufficient for a quantitative approach to morphological studies. For example, the tracks analyzed by Gatesy et al. (1999) in his biomechanical studies are a perfect example of what we mean: they preserve a lot of valuable and remarkable information that allowed creation and validation of a model of the foot movement through the sediment, but, from a taxonomical point of view, they cannot be of any use; indeed, the determination of a possible trackmaker is made through the assignment to an ichnogenus (e.g., Grallator) of other tracks present in the site (Jenkins et al., 1995). At the same site, other tracks also occur (Gatesy, 2001) that present clear outlines together with skin impressions; these would achieve a higher score in the scale because of their potential use for morphological identification, and they are also extremely important as records of foot movement. Unfortunately none of the quantitative methods of comparison can work if applied to footprints with different preservation grades; such comparisons would only increase confusion, compromising the validity of the results. Thus far, the quality of preservation of footprints has only been described verbally, without any codification or rule, and consequently depends on the opinions and descriptive skills of the authors.
For these reasons, we here introduce an ordinal numerical scale to characterize the preservation quality of footprints, with values ranging from 0 to 3, plus the possibility of adding letter codes to highlight specific features that may occur independently from the overall track preservation. The aim of this numerical scale is to provide a consistent means of assessing the preservation quality of footprints, both for future descriptions and for retroactive characterization of previously published material, thus facilitating application of new, quantitative methods of footprint shape analysis to previously described dinosaur tracks. The use of such a scale is not intended to replace qualitative descriptions of morphology but rather to integrate it with a numerical value, resulting in improved understanding of the morphological features present in the specimens. This numerical value will make the identification of comparably preserved prints easier, enhancing the reproducibility of comparisons of specimens.
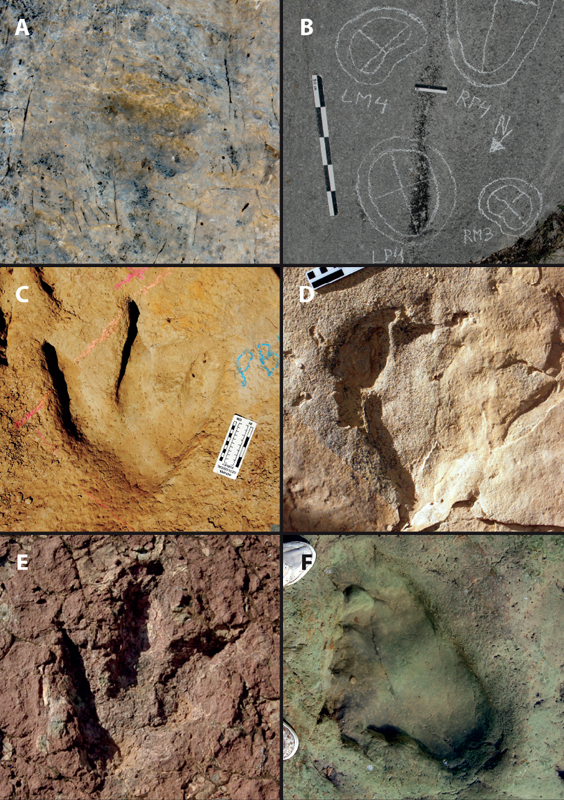
6.2. Examples of the preservation scale for tridactyl and sauropod tracks. (A) Biped grade 1, Late Triassic, Dolomia Principale Formation, Italy (Leonardi and Mietto, 2000). (B) Quadruped grade 1, Early Cretaceous, Twannbach Formation, Switzerland (Les Grattes-S1, LP4-MP4, modified from Marty et al., 2013). (C) Biped grade 2, Early Cretaceous, Glen Rose Formation, Texas (Dattilo et al., 2014). (D) Quadruped grade 2, Early Cretaceous, Villar del Arzobispo Formation, Spain (specimen LCR14.6p, Castanera et al., 2011:fig. 5B). (E) Biped grade 3, Late Jurassic, Iouaridène Formation, Morocco (specimen Deio CXVIII/16, Belvedere, Mietto, and Ishigaki, 2010). (F) Quadruped grade 3, Early Cretaceous, Glen Rose Formation, Texas (Dattilo et al., 2014).
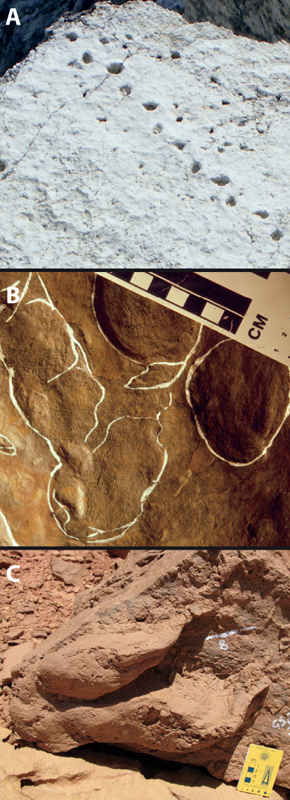
6.3. Examples of the preservation scale. (A) Grade 0, Mt. Pelmetto, Late Triassic, Dolomia Principale Formation, Italy (Leonardi and Mietto, 2000). (B) Grade 3s: “elite track” with all anatomical details and scales impression preserved. Early Jurassic, Franklin County, Massachusetts (specimen 56/1, Beneski Museum of Natural History at Amherst College, courtesy of the Trustees of Amherst College). (C) Grade 2.5pst: most of the phalangeal pad impression well preserved, partial (one digit is missing) with scale striations along the print walls. Early Cretaceous, Gara Sbaa, Morocco (Belvedere et al., 2013).
THE SCALE
The proposed scale is modified from one initially created by Farlow (unpubl.) during a study of footprint formation by emus (Dromaius novaehollandiae) (Fig. 6.1), the details of which will be published elsewhere. One preservation grade has been added at the bottom and one deleted from the top and the scale is now extended to prints beyond the digitigrade and tridactyl prints of ratites. Some coded letters are added to specify the occurrence of certain details or, when clearly recognizable, some preservational features. Footprint quality continues to be expressed as an ordinal variable, with larger numbers reflecting better preservation, without specifying how much better footprints of higher numerical rank are than those of lower numerical rank.
As defined, the scale is completely independent of substrate characteristics, or gait and behavior of the trackmaker, and is based only on the morphological characteristics visible in the footprint. This permits comparisons of the largest number of footprints, from the broadest range of sedimentary paleoenvironments and modern localities, subject to different weathering conditions. This scale is intended to provide a tool to quantify the preservation quality of a track without impacting ichnotaxonomic analyses of the footprint.
In Farlow’s (unpubl.) emu footprint study, values of the scale ranged 1–4, with intermediate values (e.g., 1.5, 2.5) permitted when the quality of preservation of a print did not neatly fall into the defined footprint values. For fossil tracks, further aspects have to be considered, such as diagenetic processes, weathering, and mechanical erosion, which could completely obliterate the morphological details of a footprint. However, even where footprints lack any morphological detail, they cannot be ignored and need to be characterized. For this reason, a footprint quality value of 0 has been added to the scale. Grade 4 of Farlow’s (unpubl.) original scale was eliminated to allow the use of a single scale for digitigrade, plantigrade, and semiplantigrade footprints. Although very different in morphology, it is possible to define common key features to discriminate the preservation grade (Fig. 6.2). A series of letter codes added to the scale’s value is introduced to specify the occurrence of certain details or, when clearly recognizable, some preservational features: s for skin/scale impressions; st for skin/scale striations; p for partial preservation (e.g., broken/missing toe impressions); u if preserved as an undertrack or transmitted track; o if preserved as an overtrack (sensu Lockley, 1991); e for epirelief; h for hyporelief.
As with Farlow’s (unpubl.) original emu footprint quality scale, intermediate footprint quality categories can be assigned to tracks that have characteristics that fall between the defined categories. The detailed scale and the identification features are presented in Table 6.1, with footprints illustrating each numerical value illustrated in Figure 6.2 and examples of the letter use in Figure 6.3. Three-dimensional models of most of the key steps can be downloaded from http://dx.doi.org/10.6084/m9.figshare.1332454 and http://dx.doi.org/10.6084/m9.figshare.1322110.
DISCUSSION
Introducing a scale for numerical characterization of footprint quality provides an easy-to-use tool for sharing data, which would improve application of shape analysis to ichnology by ensuring that prints of comparable quality are employed in comparisons. Even though our scale is originally defined on the basis of true tracks (sensu Lockley, 1991), the fact that it is based on morphological characteristics present in a footprint means that the scale can be applied to any kind of footprint, such as true tracks, undertracks, overtracks, although these would have a lower score in the scale.
Poorly and only moderately well preserved (values of 0–1) footprints, nonetheless, still retain great relevance. At the very least, even the poorest (category 0) prints indicate the presence of a trackmaker. Prints of higher quality yield information of progressively greater value about the nature of trackmakers and the ichnotaxa to which they should be assigned.
We suggest that use of the scale is appropriate any time tracks from a new site are described, or previously published prints are redescribed, and should be part of the characterization of any new ichnotaxa. Usually only the best-preserved tridactyl tracks (grade 3 in our scale) should be used as holotypes to avoid generating confusion and misinterpretations. However, certain tracks, such as those of large theropods, seldom show well-defined digital pad impressions, even though the quality of preservation of other features is quite good. In such cases new taxa can justifiably be defined from prints with a slightly lower quality grade (grade ≥2). For the same reasons, only high-score prints should be used for making reliable identifications of trackmakers. A similar reasoning can be applied also to sauropod tracks, although, in this case, the fewer morphological details commonly preserved in footprints of sauropods as opposed to tridactyl footprints of bipedal dinosaurs (due to the more compact construction of sauropod fore and hind feet) mean that grade values ≥2 would probably be adequate for describing new sauropod ichnotaxa.
“Elite tracks” were originally defined by Lockley and Hunt (1995:22–23) as “the most recently formed (youngest) tracks on the same surface” that “will stand out clearly” among the other prints in the surface, without focusing on the overall quality of the footprint. However, even though the term is still intended to identify the relatively best track(s) of a site (e.g., Wagensommer et al., 2012; Matsukawa et al., 2014), the term “elite track” can also be used to describe very well preserved tracks more generally, those which “reflect plantar morphology with digital pad, claw, and skin impressions” (Gatesy, 2003:97, fig. 6). Although the two meanings are not very different, the numerical values of elite tracks as interpreted on the basis of the quoted passages could range from grades 2 to 3 in our scale. We therefore suggest, following the definition of Gatesy (2003), that “elite track” should be used to describe only those tracks with a value of 3 in our scale (Fig. 6.3). Finally, as a general suggestion, we recommend that the verbal descriptions of footprints jointly reflect the quality of the footprints under consideration and should be always accompanied by high-quality illustration and, when possible, 3-D models of the specimens.
ACKNOWLEDGMENTS
We wish to thank the Beneski Museum of Natural History at Amherst College, and The Trustees of Amherst College for the permission to the publication of the image in Figure 6.2F; Ignacio Díaz Martínez (University of La Rioja, Spain) whose comments to an the early version have been very useful for the perfection of the manuscript; Heinrich Mallison for his accurate review; and Peter Falkingham for providing some of the three-dimensional models and for his constructive discussion, review, and suggestions that deeply improved the manuscript and the definition of the scale here proposed.
Adams, T., C. Strganac, M. J. Polcyn, and L. L. Jacobs. 2010. High resolution three-dimensional LaserScanning of the type specimen of Eubrontes (?) glenrosensis Shuler, 1935, from the Comanchean (Lower Cretaceous) of Texas: implications for digital archiving and preservation. Palaeontologia Electronica 13: 1T: 11p.
Azevedo Rodrigues, L., and V. F. dos Santos. 2004. Sauropod tracks: a geometric morphometric study; pp. 129–142 in A. M. T. Elewa (ed.), Morphometrics: Applications in Biology and Paleontology. Springer-Verlag, Heidelberg, Germany.
Belvedere, M. 2008. Ichnological researches on the Upper Jurassic dinosaur tracks in the Iouaridène area (Demnat, central High-Atlas, Morocco). Ph.D. dissertation, Università degli Studi di Padova, Padua, Italy, 128 pp.
Belvedere, M., P. Mietto, and S. Ishigaki. 2010. A Late Jurassic diverse ichnocoenosis from the siliciclastic Iouaridène Formation (Central High Atlas, Morocco). Geological Quarterly 54(3): 367–380.
Belvedere, M., A. Baucon, C. Neto de Carvalho, S. Venturini, F. Felletti, and G. Muttoni. 2012. To (laser) scan or not to scan? Hamletic question at the Pramollo ichnolagerstätte (Carboniferous, Italy-Austria); Abstract 3 in Abstract Book of DigitalFossi12012, September 24–26, Berlin, Germany.
Belvedere, M., N.-E. Jalil, A. Breda, G. Gattolin, H. Bourget, F. Khaldoune, and G. J. Dyke. 2013. Vertebrate footprints from the Kem Kem beds (Morocco): a novel ichnological approach to faunal reconstruction. Palaeogeography, Palaeoclimatology, Palaeoecology 383–384: 52–58. doi: 10.1016/j.paleo.2013.04.026.
Castanera D., J. L. Barco, I. Díaz-Martínez, J. Herrero-Gascón, F. Pérez-Lorente, and J. I. Canudo. 2011. New evidence of a herd of titanosauriform sauropods from the lower Berriasian of the Iberian range (Spain). Palaeogeography, Palaeoclimatology, Palaeoecology 310: 227–237. doi: 10.1080/10420940490428805.
Dattilo, B. F., S. C. Howald, R. Bonem, J. O. Farlow, A. J. Martin, M. O’Brien, M. G. Blair, G. Kuban, L. K. Mark, A. R. Knox, W. N. Ward, and T. Joyce. 2014. Stratigraphy of the Paluxy River tracksite in and around Dinosaur Valley State Park, Lower Cretaceous Glen Rose Formation, Somervell County, Texas; pp. 307–338 in M. G. Lockley and S. G. Lucas (eds.), Fossil Footprints of Western North America. Bulletin 62. New Mexico Museum of Natural History and Science, Albuquerque, New Mexico.
Duncan, H. 1831. An account of the tracks and footprints found impressed on sandstone in the Quarry at Corncockle Muir in Dumfries-shire. Transaction of the Royal Society of Edinburgh 11: 194–209.
Falkingham, P. L. 2012. Acquisition of high resolution three-dimensional models using free, open-source, photogrammetric software. Palaeontologia Electronica 15(1): 1T: 15p.
Falkingham, L. P., and J. O. Farlow. 2015. Latex peel of theropod tracks from the Paluxy River. Figshare. Available at http://dx.doi.org/10.6084/m9.figshare.1322110. Accessed October 22, 2015.
Gatesy, S. M. 2001. Skin impressions of Triassic theropods as records of foot movement. Bulletin of the Museum of Comparative Zoology 156: 137–149.
Gatesy, S. M. 2003. Direct and indirect track features: what sediment did a dinosaur touch? Ichnos 10: 91–98.
Gatesy, S. M., K. M. Middleton, F. A. Jenkins, and N. H. Shubin. 1999. Three-dimensional preservation of foot movements in Triassic theropod dinosaurs. Nature 399: 141–144.
Hitchcock, E. 1836. Ornithichnology: description of the foot marks of birds (Ornithichnites) on New Red sandstones in Massachusetts. American Journal of Science 29: 305–339.
Jenkins, F. A., Jr., N. H. Shubin, W. W. Amaral, S. M. Gatesy, C. R. Schaff, L. B. Clemmensen, W. R. Downs, A. R. Davidson, N. Bonde, and F. Osbaeck. 1994. Late Triassic continental vertebrates and depositional environments of the Fleming Fjord Formation, Jameson Land, East Greenland. Meddelelser om Gronland, Geoscience 32: 1–25.
Leonardi, G. 1987. Glossary and Manual of Tetrapod Footprint Palaeoichnology: Departamento Nacional da Produçao Mineral, Brasilia, Brazil, 137 pp.
Leonardi, G., and P. Mietto, eds. 2000. Dinosauri in Italia. Accademia Editoriale, Pisa, Italy, 494.
Lockley, M. G. 1991. Tracking Dinosaurs: A New Look at an Ancient World. Cambridge University Press, Cambridge, U.K., 238 pp.
Lockley, M. G., and A. P. Hunt. 1995. Dinosaur Tracks and Other Fossil Footprints of the Western United States. Columbia University Press, New York, New York, 338 pp.
Lockley, M. G., J. Li, M. Matsukawa, and R. Li. 2012. A new avian ichnotaxon from the Cretaceous of Nei Mongol, China. Cretaceous Research 34(1): 84–93.
Marty, D., C. A. Meyer, M. Belvedere, J. Ayer, and K. L. Schäfer. 2013. Rochefort-Les Grattes: an Early Tithonian dinosaur tracksite from the Canton Neuchâtel, Switzerland. Revue de Paléobiologie 32(2): 373–384.
Matsukawa, M., M. G. Lockley, K. Hayashi, K. Korai, C. Peiji, and Z. Haichun. 2014. First report of the ichnogenus Magnoavipes from China: new discovery from the Lower Cretaceous inter-mountains basin of Shangzhou, Shaanxi Province, central China. Cretaceous Research 47: 131–139.
Milàn, J. 2011. New theropod, thyreophoran, and small sauropod tracks from the Middle Jurassic Bagå Formation, Bornholm, Denmark. Bulletin of the Geological Society of Denmark 59: 51–59.
Petti F. M., M. Bernardi, R. Todesco, and M. Avanzini. 2011. Dinosaur footprints as ultimate evidence for a terrestrial environment in the late Sinemurian Trento Carbonate Platform. Palaois 26(10): 601–606.
Rasskin-Gutman, D., G. Hunt, R. E. Chapman, J. L. Sanz, and J. J. Moratalla. 1997. The shapes of tridactyl dinosaur footprints: procedures, problems and potentials; pp. 377–383 in D. L. Wolberg, E. Stump, and G. D. Rosenberg (eds.), Dinofest International Proceedings. Academy of Natural Sciences, Philadelphia, Pennsylvania.
Remondino, F., A. Rizzi, S. Girardi, F. M. Petti, and M. Avanzini. 2010. 3D Ichnology – recovering digital 3D models of dinosaur footprints. Photogrammetric Record 25(131): 266–282.
Thulborn, T. 1990. Dinosaur Tracks. Chapman and Hall, London, U.K., 410 pp.
Wagensommer, A., M. Latiano, G. Leroux, G. Cassano, and S. D’Orazi Porchetti. 2012. New dinosaur tracksites from the Middle Jurassic of Madagascar: ichnotaxonomical, behavioural and palaeoenvironmental implications. Palaeontology 55(1): 109–126.