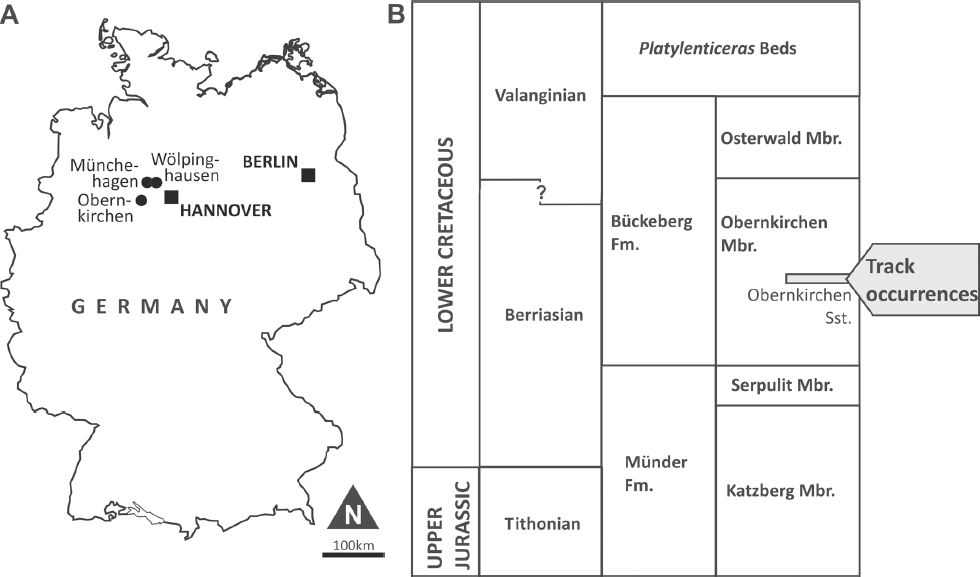
12.1. (A) Locality map and (B) stratigraphic position of the material studied herein.
Diversity, Ontogeny, or Both?: A Morphometric Approach to Iguanodontian Ornithopod (Dinosauria: Ornithischia) Track Assemblages from the Berriasian (Lower Cretaceous) of Northwestern Germany |
IDENTIFYING THE CAUSES OF MORPHOLOGICAL VARIAtion (including taxonomic diversity, ontogeny, sexual dimorphism, and individual variation) observed in a set of vertebrate tracks – especially from different closely related trackmaker species – is difficult and often not straightforward due to imperfect knowledge of biological variation in the autopodia of the trackmakers, and a number of ethological, preservational, and taphonomical influences. Here we use multivariate data sets obtained from 14 homologous two-dimensional (2-D) landmarks to evaluate the range and potential causes of variation in iguanodontian ornithopod pes tracks from the Berriasian of northwestern Germany.
In order to minimize the nonanatomical-related effects associated with track morphology (extramorphological track modifications), the specimens included in the analysis were selected by application of a rigorous check of preservational quality. The data sets were normalized by full Procrustes fitting and reduced to one- or two-dimensional data by principal components analysis (PCA). Comparison of multitrack trackway segments with the entire data set shows that the variation found in the former only accounts for a maximum of 32.2% (median: 8.9%, arithmetic mean: 13.2%, n = 10) of total variation. The latter is therefore interpreted to be informative with respect to variation between individual trackmakers. Different approaches (nondiscriminatory PCA of the entire data set, group-wise PCA of a priori defined provenance groups, and discriminant analysis) found two overlapping clusters of scores, interpreted to represent two morphotypes (O and M), correlating to the geographical and stratigraphical provenance of the tracks. Morphological extremes are related to smaller size, whereas larger specimens occupy the zone of overlap between the morphotypes. In morphotype O, a clear morphological trend correlates with an increase in size, suggesting an ontogenetic signal and appendicular allometry of the trackmaker.
The data suggest that qualitatively quite different ornithopod tracks form a morphological continuum, in which variation is partly explainable by ontogeny. On the other hand, the data set is interpreted to contain at least two distinct morphotypes, which, however, cannot be sharply defined by qualitative characters due to a considerable morphological overlap. The method presented here is promising to evaluate variation in track data sets and to interpret it in terms of ichnotaxonomy, orthotaxonomy, and ontogenesis of the trackmaker.
INTRODUCTION
One outstanding character of vertebrate track fossils is the fact that they represent a mode of preservation of body parts of their producers, in contrast to most invertebrate tracks and traces, which mostly reflect the behavior and activity of the trackmaker but not necessarily its anatomy (e.g., Hunt and Lucas, 2007; Lockley, 2007). As such, their interpretation is subjugated largely to the same problems as that of skeletal remains, including the recognition of individual and ontogenetic variation, population structure and dynamics, and even paleopathologies. For example, ontogenetic allometry is often encountered in dinosaurs, commonly including the limbs (e.g., Foster and Chure, 2006; Brett-Surman and Wagner, 2007; Kilbourne and Makovicky, 2010), and therefore potentially affecting the track morphology (e.g., Breithaupt and Matthews, 2012). However, these aspects are rarely addressed by ichnological studies because the influence of kinematics and substrate properties on track morphology cannot easily be examined. From this thematic complex, potential social behavior (which is affected by population dynamics) is most abundantly investigated in dinosaur track studies (e.g., Ostrom, 1972; Thulborn and Wade, 1979; Lockley, Houck, and Prince, 1986; Farlow, 1987; Leonardi, 1989; Pittman and Gillette, 1989; Hawthorne, 1990; Carpenter, 1992; Barnes and Lockley, 1994; Lockley, Meyer, and dos Santos, 1994; Matsukawa et al., 1997; Lockley and Matsukawa, 1999; Lockley, Schulp, et al., 2002; Lockley, Wright, et al., 2002; Day et al., 2004; Barco, Canudo, and Ruiz-Omeñaca, 2006; Myers and Fiorillo, 2009; Castanera et al., 2011), whereas an ontogenetic or paleopathological impact on track morphologies is proposed sporadically (e.g., Abel, 1935; Dantas et al., 1994; Lockley et al., 1994; Matsukawa, Lockley, and Hunt, 1999; Avanzini, Piñuela, and García-Ramos, 2008; Ishigaki and Lockley, 2010). On the other hand, the limited range of morphological information on the trackmakers preserved in their tracks often hampers the assessment of the signal of biological variation and its potential causes (individual variation, ontogeny, taxonomy). This is further acerbated by imperfect knowledge of the degree, origins, and phenotypical expression of variation in the trackmakers. The second strong bias includes the impact of extramorphological and taphonomical modification frequently experienced by tracks (e.g., by differences in substrate, subsequent erosion), which can often only be assessed or estimated to a limited level of certainty. Current concepts in ichnotaxonomy, which are based mostly on isolated qualitative morphological traits (e.g., ichnotaxobases, Bromley, 1990; Bertling et al., 2006) rarely pay attention to these factors that may potentially prove to be problematic, such as when synapomorphy-based track/trackmaker relations are studied (Carrano and Wilson, 2001) or when ichnotaxonomic definitions are used to interpret ichnocoenoses in terms of biological diversity or ichnostratigraphy.
A potential approach to these problems is a multivariate, 2-D homologous landmark (MHL) analysis of large data sets of similar and taxonomically related tracks (for similar approaches and techniques in dinosaur tracks, see Rodrigues and Santos, 2004; Belvedere, 2008; Moratalla and Marugán-Lobón, 2009; Castanera et al., 2015; Buckley, McCrea, and Lockley, 2016; Wings, Lallensack, and Mallison, 2016). By categorizing the material in qualitatively defined groups, this method allows a quantification of morphological traits that can otherwise only be described in qualitative terms and has the potential to expose morphological trends, which would otherwise be obscured. On the other hand, unlike numerical analyses of continuous shape landmarks (based on an outline shape defined by a theoretically infinite number of [semi] landmarks, e.g., Rasskin-Gutmann et al., 1997; Zelditch, Swiderski, and Sheets, 2012), it allows the application of an a priori filter (using objective criteria) to eliminate random and other nonanatomy-related shape transformations from the data set. It also has the advantage of being applicable to isolated footprints (even those from old collections with limited data on their origin), independently from the preservation of trackways or their length (though their availability will strongly bolster the meaning and reliability of the data set). Even specimens represented only by (suitable) photographs or sketches can be used as data sources, provided that the accuracy of both is properly assessed and included in the interpretation of the results (see also Falkingham, 2016). It does not require special hardware and employs only software that is freely available.
AIMS OF THIS STUDY
Here we apply MHL analysis to a data set obtained from iguanodontian ornithopod tracks occurring in the upper Berriasian Obernkirchen Sandstone (Bückeberg Formation) of northwestern Germany, which form a dominant component of the local dinosaur ichnofauna (e.g., Struckmann, 1880; Grabbe, 1881; Ballerstedt, 1905, 1914; Stechow, 1909; Dietrich, 1927; Lehmann, 1978; Diedrich, 2004; Lockley, Wright, and Thies, 2004; Böhme et al., 2009; Hornung and Reich, 2012). These tracks have been referred to as “tracks of Iguanodon” for most of their research history (e.g., Struckmann, 1880; Dollo, 1883; Kuhn, 1958; Lehmann, 1978). With increasing acceptance that there is no evidence to relate these tracks to the Barremian-Aptian orthogenus Iguanodon Mantell, 1825, and the advent of a more formalized ichnotaxonomic nomenclature for iguanodontian tracks (Sarjeant, Delair, and Lockley, 1998), these tracks were mostly collectively referred to the ichnogenus Iguanodontipus Sarjeant, Delair, and Lockley, 1998, with more or less certainty (e.g. Diedrich, 2004; Lockley, Wright, and Thies, 2004; Hornung and Reich, 2007; Böhme et al., 2009; Richter et al., 2012). However, there is growing evidence that the material encompasses a range of morphotypes: Böhme et al. (2009) additionally found a distinctly different morphotype, which they tentatively associated with the ichnogenus Caririchnium Leonardi, 1984, and Hornung and Reich (2012) stated that only a small part of the studied ornithopod tracks can be referred to Iguanodontipus when applying the qualitative definitions of this ichnogenus by Sarjeant, Delair, and Lockley (1998) and Meyer and Thüring (2003; but see also Díaz-Martinez et al., 2015). The relationships of very small, tridactyl ornithischian tracks from this stratum are evaluated by Hübner (2016).
At track localities in the Obernkirchen Sandstone, the ornithopod tracks and trackways often occur in large numbers on the same track horizon (Dietrich, 1927; Lehmann, 1978; Diedrich, 2004; Hornung and Reich, 2012; Richter et al., 2012; Wings et al., 2012). Though it may be open to discussion whether this indicates a level of true gregarious behavior (which seems probable at least in some places), these animals apparently occurred abundantly within very short time intervals. However, various sizes and variable morphologies of these tracks may indicate either the sympatric occurrence of different orthotaxa, of different ontogenetic stages, or of both. To test the proposed method and evaluate the preceding questions, we quantified the morphology of a subset of these tracks, assembled by adhering to strict criteria of preservational quality, by obtaining a set of homologous landmarks from the pes tracks.
Table 12.1. Overview of tracksites from which material was used for the MHL analyses
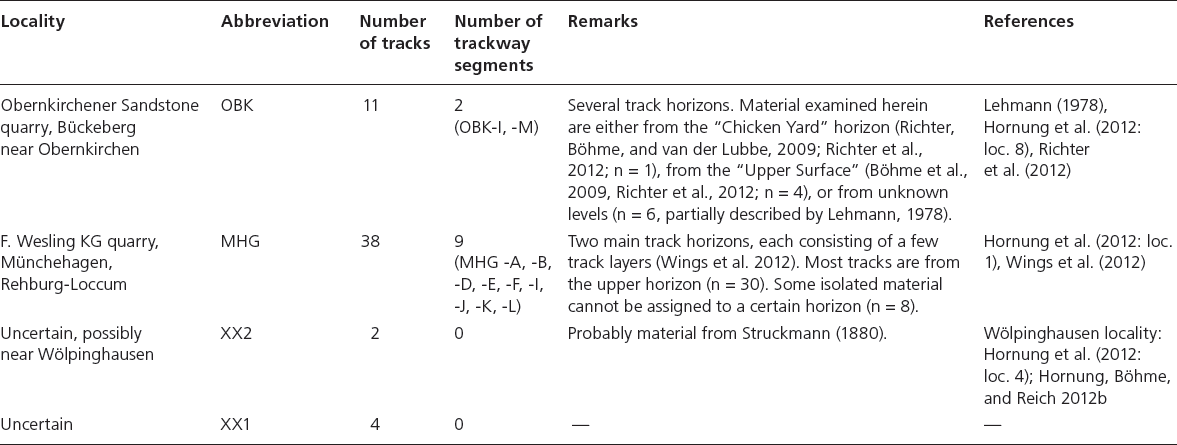
Notes: Trackway segments refer to trackways (two or more footprints left by the same individual) used in this study. MHL, multivariate, two-dimensional homologous landmark.
MATERIALS AND METHODS
Geological Setting
All material originates from a number of outcrops (Table 12.1, Figure 12.1) located in the Obernkirchen Sandstone, Wealden 3, Cypridea alta formosa ostracod subzone, Obernkirchen Member, lower Bückeberg Formation of Late Berriasian age. The tracksites are located in an area west of Hannover, Lower Saxony, northwestern Germany. The Obernkirchen Sandstone represents a relatively thin sandstone intercalation formed as a deltaic and sandy shore-face barrier system, prograding into predominantly pelitic lacustrine basin sediments deposited in the Lower Saxony Basin (Pelzer, 1998). Dinosaur tracks (including ornithopod, theropod, sauropod, and ankylosaur footprints) are abundant in a number of subenvironments, including barrier sands and shallow-water delta plains. For a detailed account on the geology, vertebrate ichnofauna, and paleoenvironment, as well as descriptions of tracksites from the Obernkirchen Sandstone, see Hornung et al. (2012) and Hornung, Böhme, and Reich (2012a).
A strict lateral correlation between track horizons in different outcrops and therefore proof of isochrony cannot be provided, and hence the Obernkirchen Sandstone track occurrences were not classified as a megatracksite by Hornung et al. (2012). However, according to the sedimentation rate model for the Bückeberg Formation by Berner (2011), and dating of the Obernkirchen Sandstone by Elstner and Mutterlose (1996), the total time for deposition for this unit lasted 104 to 105 years, and its dinosaur ichnoassemblage is considered to represent a coherent ichnocoenosis (sensu Hunt and Lucas, 2007).
Though the paleoenvironmental interpretation differs between the track localities, the general lithofacies, type, and quality of track preservation are similar. The tracks are mostly preserved at bedding surfaces of heterolithic successions of thin- to thick-bedded, fine-grained, highly mature, mostly textureless but also planar laminated, cross-laminated, or cross-stratified, often oscillation ripple-marked sandstone with thin layers of mudstone, ranging in thickness from 0.1 to >5 cm. As an exception, tracks may also be preserved within sandstone successions at bedding planes between distinct beds. The most common type of preservation is that of true tracks or – in the case of heterolithic contacts – “nearly true” tracks in which the tracks may have been left in sand covered by a millimeter-thin layer of mud. Technically undertracks, or underprints, these tracks have the potential to preserve faithfully the autopodial morphology of the trackmaker because the very thin layer of mud only marginally influences the relief produced in the underlying sand. Deeper undertracks are rare and related to thinly bedded sandstone successions.
Structures (tracks, ripple-marks, etc.) on sandstone bedding planes are often preserved in pristine condition and were protected by the mudstone covers, suggesting rapid, episodic high-energy depositional events (storms, seasonal floods) for the sandstones, followed by calm suspension settling. Carbonaceous films on such well-preserved surfaces suggest the development of microbial mats, stabilizing the sediment, and favoring track preservation (see also Marty, Strasser, and Meyer, 2009). In some instances, especially at Münchehagen, reticulated or knobby patterns of raised ridges and pits on sandstone surfaces are very reminiscent of similar structures in desiccating microbial mats (Bose and Chafetz, 2009), suggesting emersion after mat formation. Tracks on these surfaces often show poor preservation. At Obernkirchen, such surface structures are commonly associated with root-traces (Grupe, 1931), indicating longer phases of emersion. Other indicators of subaerial exposure (e.g., mud cracks) are extremely rare and the track horizons with well-preserved tracks were most probably permanently covered by shallow water until final burial. Omission surfaces are also very rare, though the densely track-covered, lower, “Chicken Yard” level at Obernkirchen (Richter et al., 2012) was probably exposed for some time, resulting in a slight surface degradation and destruction of subtle superficial sedimentary structures.
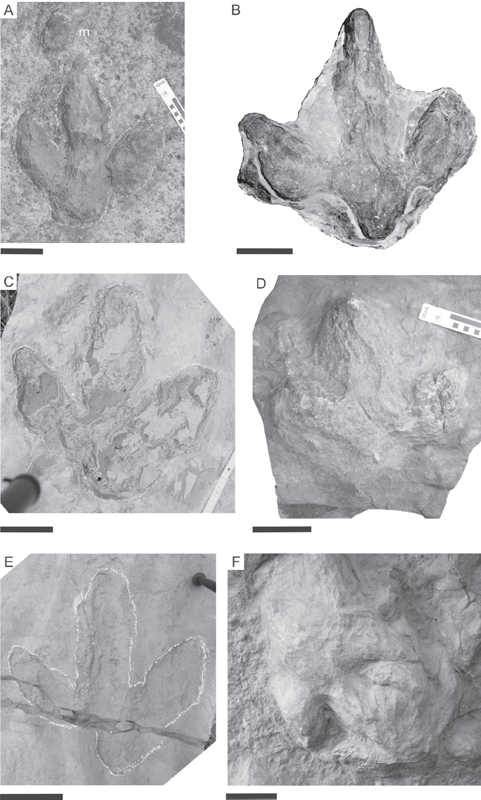
12.2. (A–D) Examples of track specimens included in the multivariate, two-dimensional homologous landmark (MHL) analysis. (A) Morphotype M, in situ specimen, data-ID OBK-N-1, epichnial relief, left pes impression (m, left manus impression), Obernkirchen quarry, Chicken Yard track horizon. (B) Morphotype ?O, NLMH 105.746 (in the Niedersächsisches Landesmuseum Hannover collection), data-ID XX2-X-2, natural hypichnial cast, left pes impression, uncertain locality, probably Wölpinghausen. (C) Morphotype M, NLMH unnumbered, data-ID MHG-L-2, artificial cast of natural epichnial relief, right pes impression, Münchehagen, Wesling quarry, upper track horizon. (D) Morphotype M, NLMH unnumbered, data-ID MHG-X-8, natural hypichnial cast, right pes impression, Münchehagen, Wesling Quarry, uncertain track horizon. (E) Tectonically distorted (clefted) specimen, not used for analysis, NLMH unnumbered, artificial cast of natural epichnial relief, right pes impression, Münchehagen, Wesling Quarry, upper track horizon. (F) Overstepping pes tracks, not used for analysis, GPMH unnumbered ([in the Geologisch-Paläontologisches Museum der Universität Hamburg collection]; see Lehmann, 1978) natural hypichnial casts, Obernkirchen Quarry, uncertain track horizon. (A, B) Preservational class I; (C, D) preservational class II; (E, F) preservational class III. Scale bars: 10 cm.
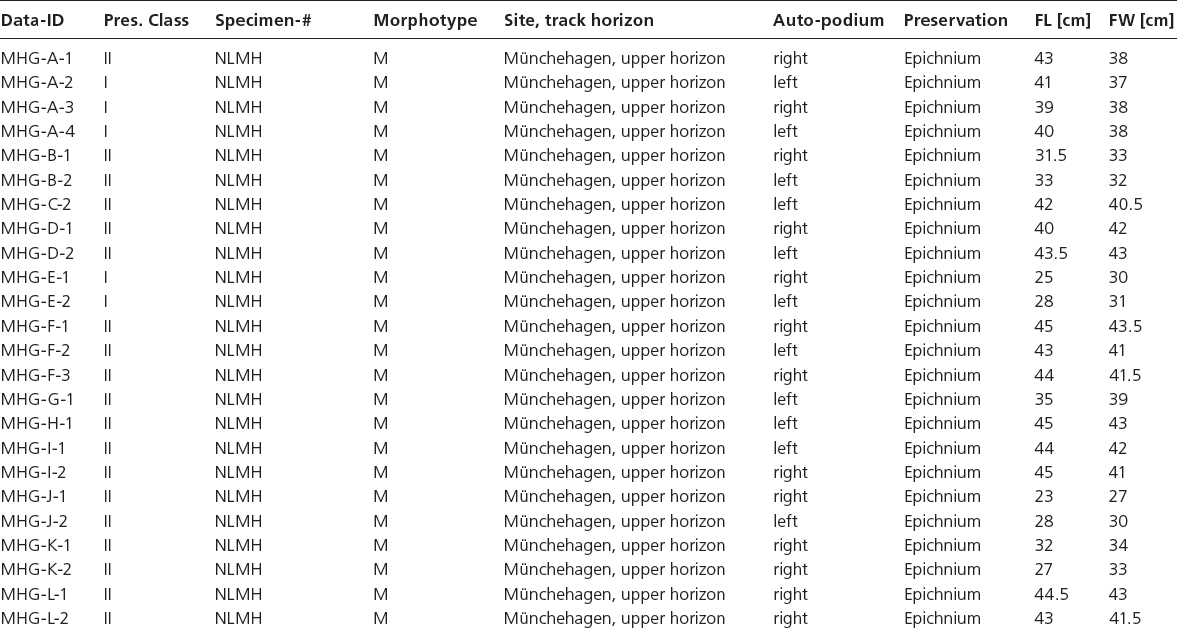
Notes: Landmark coordinates and Procrustes fitting variance-covariance matrix are available online: http://dx.doi.org/10.6084/m9.figshare.1348327. FL, foot length; FW, foot width; GPMH, Geologisch-Paläontologisches Museum der Universität Hamburg; MSLB, Museum für Stadtgeschichte und Schaumburg-Lippische Landesgeschichte, Bückeburg; n/a, not available; NLMH, Niedersächsisches Landesmuseum Hannover; other abbreviations as in Table 12.1.
The track localities are located within a depositional system that encompassed the mouth of a river system draining the southern uplands and reaching the lake basin in the roughly funnel-shaped Hils Embayment, west and southwest of present-day Hannover (Pelzer, 1998; Hornung et al., 2012; Hornung, Böhme, and Reich, 2012a). The Obernkirchen track levels were located in a deltaic mouthbar complex (Hornung et al., 2012; Richter et al., 2012), with a slightly more distal location of the upper level that yielded the majority of the examples included in this work. The Münchehagen locality is interpreted as to be located in a sandy barrier complex, migrating landward over fine-grained back-barrier lagoonal deposits (Pelzer, 1998; Wings et al., 2012). The exact environmental setting of the Wölpinghausen locality is unclear, as the track-bearing strata are no longer exposed (Hornung, Böhme, and Reich, 2012b)
Track Material
According to the strict criteria outlined herein, we sampled data from 55 tracks from the Obernkirchen quarry (two stratigraphic levels, n = 11), Münchehagen Wesling quarry (n = 38), and from at least one or more unknown localities (insufficient locality data, n = 6), one of which is most probably Wölpinghausen, the classical site of Struckmann (1880). Details on the localities and material are provided in Tables 12.1–12.2; examples of the material are shown in Figure 12.2. The material was chosen in the order of importance according to (1) preservational quality, (2) range of size, (3) range of morphological variation, and (4) diversity of provenance. The iguanodontian ornithopod pedal track morphologies that are evaluated here have been qualitatively identified in the ichnocoenoses by the presence of three broad, bluntly terminating digits, no trace of digit I, presence of a posteromesial, distally rounded metatarsal-phalangeal pad, confluent with the base of digits, subequal lengths of digits II and IV, sub-symmetric arrangement of digits II and IV with respect to digit III, moderate to wide digital divarication (angle between digits II and IV: >45°), inward rotation of pes impressions in trackways and the association of small, ovate to triangular manual impressions in some specimens (see also Castanera et al., 2013). Examples exhibiting morphological differences, which can clearly be related to anatomical features of the trackmaker (e.g., ?Caririchnium isp. ornithopod tracks of Böhme et al., 2009; Richter et al., 2012; theropod tracks), were omitted from the data set.
Data Acquisition
Criteria of track data selection As MHL depends on the proper identification of anatomically homologous landmarks, the foremost objective of track selection was to ensure that the material reflects the pedal morphology of the trackmaker in the most unmodified way possible. Contraindicative to inclusion in the data set were tracks with strong intrinsic, extrinsic, or extramorphologic modifications (e.g., Diedrich, 2004; Manning, 2004; Jackson, Whyte, and Romano, 2009, 2010; Falkingham et al., 2009, 2011; Falkingham, 2014; Belvedere and Farlow, 2016) and undertracks. A catalog and classification of such modifications and modes of preservation are provided in Table 12.3 and Figure 12.3, leading to three preservational classes:
• Class I track data are considered to represent the trackmaker’s autopodial morphology in an optimal quality and are regarded first-choice as for MHL.
• Class II track data represent suboptimally preserved specimens that are rated sufficient for MHL analysis, though special caution must be given to the interpretation of results. Contradictory results must be rated inferior in accuracy to results from class I tracks, and the use of class II data should be avoided if a sufficient database is available for the entire range of observed morphologies.
• Class III track data are unsuitable for MHL analysis as it inadequately represents the trackmaker’s autopodial morphology.
According to the “Goldilocks” principle (for application in track formation and preservation see Falkingham et al., 2011), most tracks of an ichnocoenosis can be anticipated to rate as class III, with sequentially decreasing numbers of individual tracks usable (class II) and optimal (class I) for MHL analysis, respectively, resulting in a fastidious data selection (Figs. 12.2–12.3).
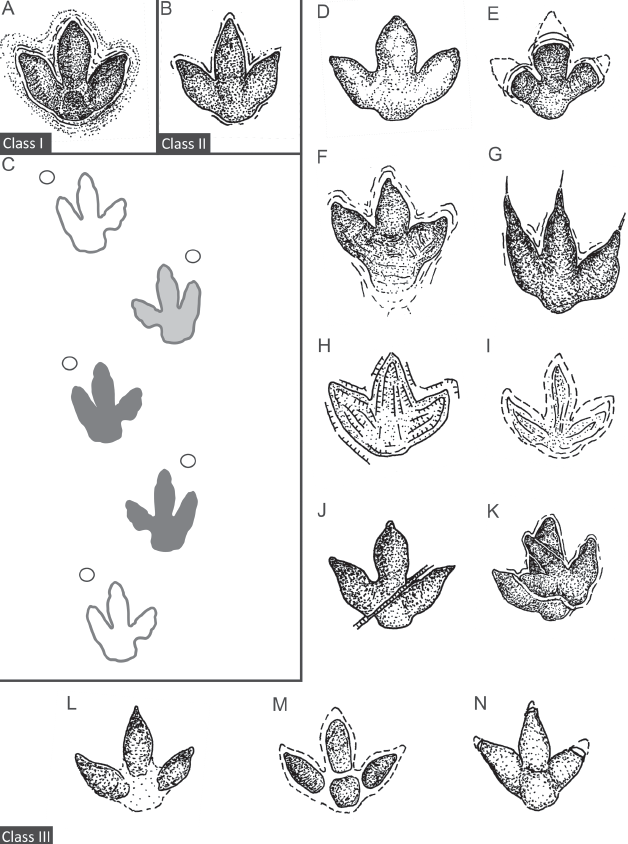
12.3. Track preservation quality and class rating. (A) Idealized example of class I track. (B) Idealized example of class II track. (C) Schematic example of trackway segment including tracks of class I (dark gray), class II (light gray), and class III (white), only the gray tracks will be used for multivariate, two-dimensional homologous landmark (MHL) analysis. White circles indicate manus impressions. (D–N) Idealized examples of class III tracks. For further explanations, see Table 12.3.
Table 12.3. Definition of track preservation classes
Preservational Class |
Description |
I |
Pristine preservation of tracks with no to minimal extramorphological or epigenetic modifications (Figs. 12.2A, 12.2B, 12.3A). The tracks are deeply impressed (at least to a depth equaling half the width of the digits), with nearly vertical margins and well-defined outline. Preferrably used for MHL analysis. |
II |
Good preservation of tracks with well-preserved, undistorted outline but minor extramorphological or epigenetical modifications (Figs. 12.2C, 12.2D, 12.3B), including shallower pes impressions, minor modifications of the track floor, such as by adhesion spikes or microfaulting, local marginal collapse, or compression of interdigital sediment. Usable for MHL analysis. |
III |
Preservation severly affected by intrinsic or extrinsic, extramorphological or epigenetic modifications (Figs. 12.2E, 12.2F, 12.3D, 12.3N). These modifications may include but not be restricted to: too shallow impression (Fig. 12.3D), partial roofing of deeply impressed tracks (Fig. 12.3E), slipping and slip-faces (Fig. 12.3F), dragging and drag marks (Fig. 12.3G), outline distorted by intensive microfaulting (Fig. 3H), or high water content in sediment (Fig. 12.3I), tectonic deformation (Figs. 12.2E, 12.3J), overstepping (Figs. 12.2F, 12.3K), incomplete impression or preservation (Fig. 12.3L), partial preservation by firm substrate, undertracks (Fig. 12.3M), or overtracks or postexcavational damage to hypichnial casts (Fig. 12.3N). Unsuitable for MHL analysis. |
Note: MHL, multivariate, two-dimensional homologous landmark.
The entire outer perimeter of the track must be visible from above. Tracks in which the digits were inserted in the sediment surface subhorizontally (penetrated into the substrate) and the anterior part of the track is roofed (technically forming an endichnium rather than an epichnium, or a penetrative deep track, see Fig. 12.3E) are not suitable. Class I tracks are characterized by vertical or near-vertical track margins (preserving the unaltered, uncollapsed outline), and the foot was impressed and removed as vertically as possible, to at least half of its dorsoventral height into the substrate. It is assumed that a resulting track represents the most objective outline of the pes, including the most anatomical information possible, reduced to a 2-D plane. Though it may be argued that relinquishment of the third dimension in the data set is a reduction in information, the 2-D outline is considered to carry most of the anatomical information, because lateral sediment displacement during track formation is mostly controlled by the pes’s volume and morphology. In contrast, the third dimension (vertical to the bedding plane) is often affected and modified by locomotion dynamics (e.g., Thulborn and Wade, 1989). Additionally, data acquisition for 2-D landmarks is much simpler, and equipment- and time-efficient, and the loss of purpose-relevant information is considered negligible.
Critical areas are often the hypices between the digits, being affected by compression of the interdigital sediment (Falkingham et al., 2009), and the posterior margin of the foot (the metatarsal-phalangeal pad), being modified by the maximum angle of inclination of the metatarsus during the step cycle. Depending on the degree of such inaccuracies, tracks may still be rated as class II, as long as the defined homologous landmarks are unequivocally identifiable.
Optional missing data algorithms in data normalization or PCAs should not be used because the impact of such methods on result accuracy have not been established by meticulous analyses, which are beyond the scope of this work. For the time being, tracks in which the locations of all homologous landmarks cannot be unanimously identified are summarily rated class III, and excluded from MHL analysis.
The use of different preservational modes of tracks (epichnial relief, hypichnial casts, both natural as well as artificial) is not only possible but explicitly encouraged in order to avoid statistical effects potentially caused by different modes of preservation between two or more track populations. The validity of MHL analysis results is strengthened if they are found to be stable regardless of the preservational mode of the included tracks. Any results showing a correlation between morphospace definition and track preservation have to be treated with suspicion. Assessment of the superiority of a certain preservational mode in terms of data quality is not ever straightforward. For example, in this study, hypichnial casts were considered slightly advantageous in some cases, as preserved epichnial reliefs in sandstone layers were in fact undertracks created below a millimeter-thin veil of mud (Wings et al., 2012). In these cases, which are not always obvious, the casts better represent the original morphology of the pes.
These prerequisites reduce the amount of usable data. However, such a restriction is inevitable for a realistic judgment of the anatomical morphospace of the trackmaker’s autopodium and all further expansion of the data set should be done with utmost care in adopting these principles. Naturally, the method applied requires the inclusion of data from more than one trackway; theoretically, any compared track can originate from a different trackway. However, to obtain a measure of objectivity, several (left and right) tracks from at least one trackway segment (Fig. 12.3C) should be included to compare the range of variation created by a single, evidently unique trackmaker to the entire data set.
The 2-D landmarks (x, y coordinates) were acquired with the free software ImageJ (Rasband, 1997–2012) supplemented with the open-source plugin Point Picker (Thévenaz, 2012) from vertical digital photographs of the tracks. In the case of extensive in situ track occurrences (e.g., the Obernkirchen quarry track surface), rectified orthophotos of the site may be a useful data source. Alternatively or additionally, data acquired by further imaging techniques, such as laser scanning or photogrammetry, can be employed.
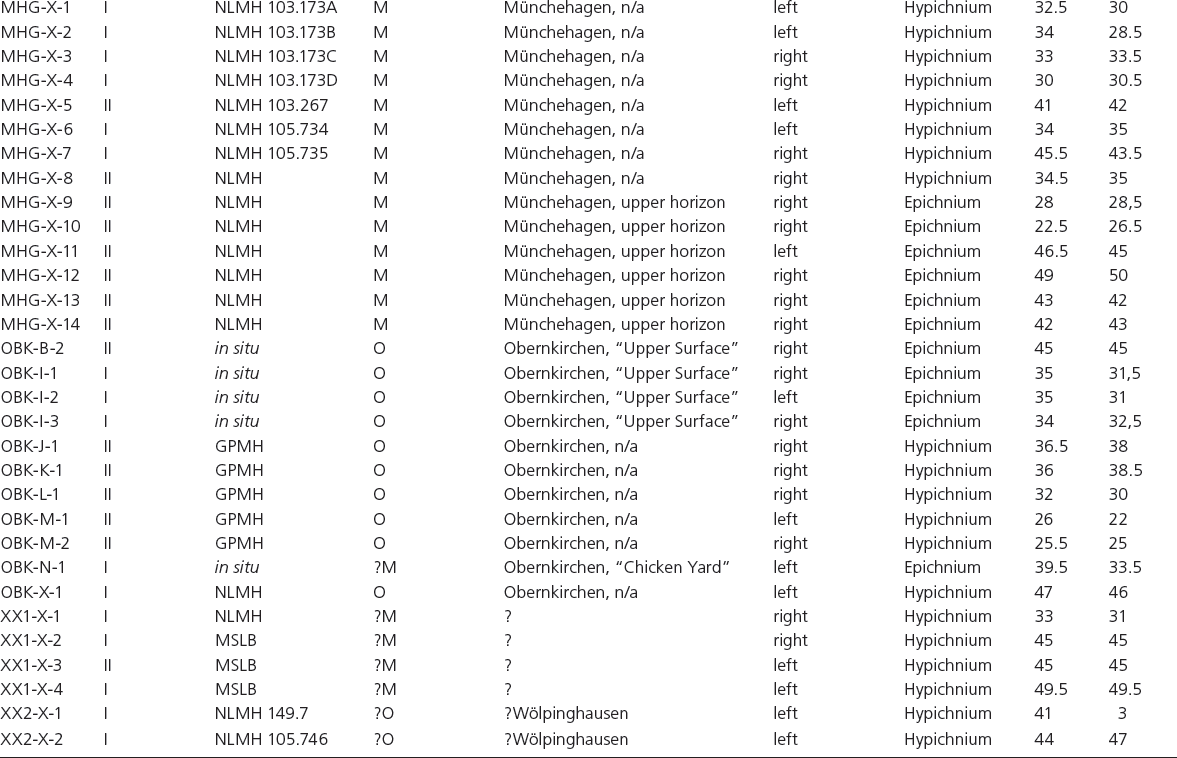
Landmark definition The 2-D homologous landmarks are defined herein as representing locations of anatomically homologous points along the outline of tracks. An example are the apices of the digit impressions, provided that these are not modified by extramorphological processes (e.g., dragging of the foot) as previously defined. The specific choice of landmarks should be carefully considered with respect to their correlation to anatomical features of the trackmaker. For the purpose of this study, a set of 14 landmarks has been defined according to the scheme in Figure 12.4. In order to ensure strict adherence to homology in the data set, geometric effects of mirroring between the left and right foot and preservation as epichnium and hypichnium have to be considered. As a convention, the sequence of landmarks (1, 2, 3 …) has been defined based on the epirelief of the right pes, beginning at the apex of digit III and continuing clockwise, and adopted subsequently for other orientations (Fig. 12.4).
Landmarks 1, 5, 11: apices of digits III, IV, and II, respectively.
Landmarks 3, 13: hypices between digits III/IV, and II/III, respectively.
Landmarks 7, 9: locations of maximum lateral/medial indentation at the posterolateral/mediolateral base of digits IV and II, respectively.
Landmark 8: posterior margin of track, opposite to the apex of digit III.
Landmarks 2, 4, 6, 10, 12, 14: location of maximum convexity of the medial and lateral margins of the free digits.
Other parameters Foot length (FL) and foot width (FW) have been measured according to Figure 12.4.
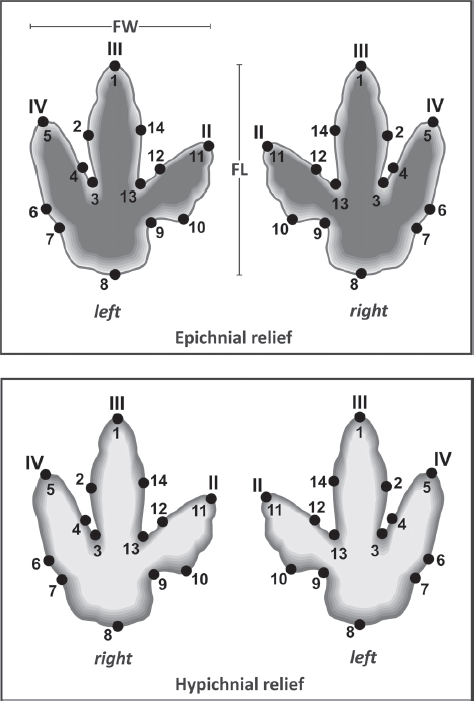
Data grouping In order to carry out varying subtests (see study layout), data have been a priori grouped either by their locality provenance or by size. For practical use, the size has been classified in size classes based on FL (Fig. 12.5). These size classes are arbitrary (5-cm intervals), defined for the purpose of comparability, and not intended to represent individual age classes, which can (potentially) only be determined after testing.
Numerical Data Analysis
Following data acquisition, the landmark coordinates were imported to the Palaeontological Statistics (PAST) free software package (version 2.17, Hammer, Harper, and Ryan, 2001; Hammer and Harper, 2006; Hammer, 2012). In order to work with a size, position, and rotation normalized data set, the original data were fully standardized to 2-D Procrustes coordinates (algorithm by Rohlf and Slice, 1990) and aligned to their major axis.
12.4. Two-dimensional landmark definition for epichnial reliefs and hypichnial casts.
The resulting multivariate data set was used as a variance-covariance matrix in subsequent PCAs (Davis, 1986; Harper, 1999). According to the purpose (see study layout), PCAs were either conducted for the entire unordered data set, or with the between-groups option of PAST for a priori defined data groups (subsets), calculating principal components (PCs) for group means (Hammer, 2012). In the latter case, a control PCA of ungrouped data was executed to compare the results. The significance of resulting PCs were evaluated by comparison to a “scree plot” of eigenvalues against a “broken stick” curve expected by a random model (Jackson, 1993). By default, the PCs with the highest significance obtained by this method were used for bivariate analysis and interpretation. The “meaning” of the PCs (the direction and degree of morphological variation expressed by the eigenvector) are evaluated by (1) comparison of the PCA score correlation to the respective eigenvector, and (2) by simulating the principal deformation from the mean shape for each relevant PC, using the graphical shape deform (2-D) module (applying the thin plate spline deformation method) of PAST.
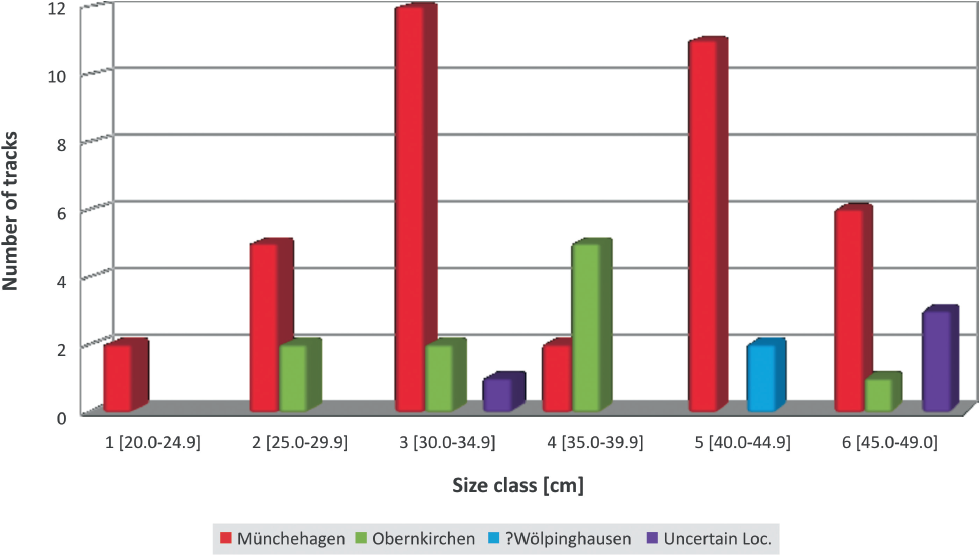
12.5. Size class distribution histogram.
The clusters of PCA scores found and interpreted as morphotypes were tested with a discriminant analysis, including Hotelling’s t-squared test, evaluating the probability of the same mean for both populations, with the number of variables set to 4 (Hammer, 2012).
In order to evaluate the morphological variation between tracks within distinct trackways compared to the whole data set, a PCA with an a priori grouped trackway data set versus a group comprising the remainder of the data is performed. This is reiterated for all individual trackway segments (n = 10) (Table 12.4). The range of PCA scores for the individual trackways (ΔsT) and the entire data set (ΔsN, equaling eigenvalue of the chosen PC) are calculated by subtracting the individual minimum scores from the individual maximum scores of both groups (sTmin − sTmax and sNmin − sNmax, respectively). The quotient ΔsT/ΔsN produces the relative range of variance within the distinct trackway compared to the entire data set, which can be expressed as percentage value for convenience. It is proposed that the variance within an individual trackway should be distinctly less than 50% of the whole range of variance in the data set for the method to be considered useful and we apply herein a threshold of 40% (ΔsT/ΔsN < 0.4).
To evaluate the potential correlation between individual size and the direction of the morphological variation, it is tested whether there is a linear relationship between size and morphological similarity. If there exists an allometric relationship between size (individual age) and autopodial morphology and proportions, it may be expected that the maximum and minimum scores of the most significant PCs each correlate with the largest and smallest size classes (or vice versa) and the intermediate size classes correlate to the numerical sequence of the intermediate PCA scores. It may be expected that the correlation is increasingly blurred by variation due to preservational and other effects with decreasing variance relative to the PC. Allometry cannot be detected by this method if the resulting plots show a chaotic arrangement of size classes across the scatter of scores.
Study Layout
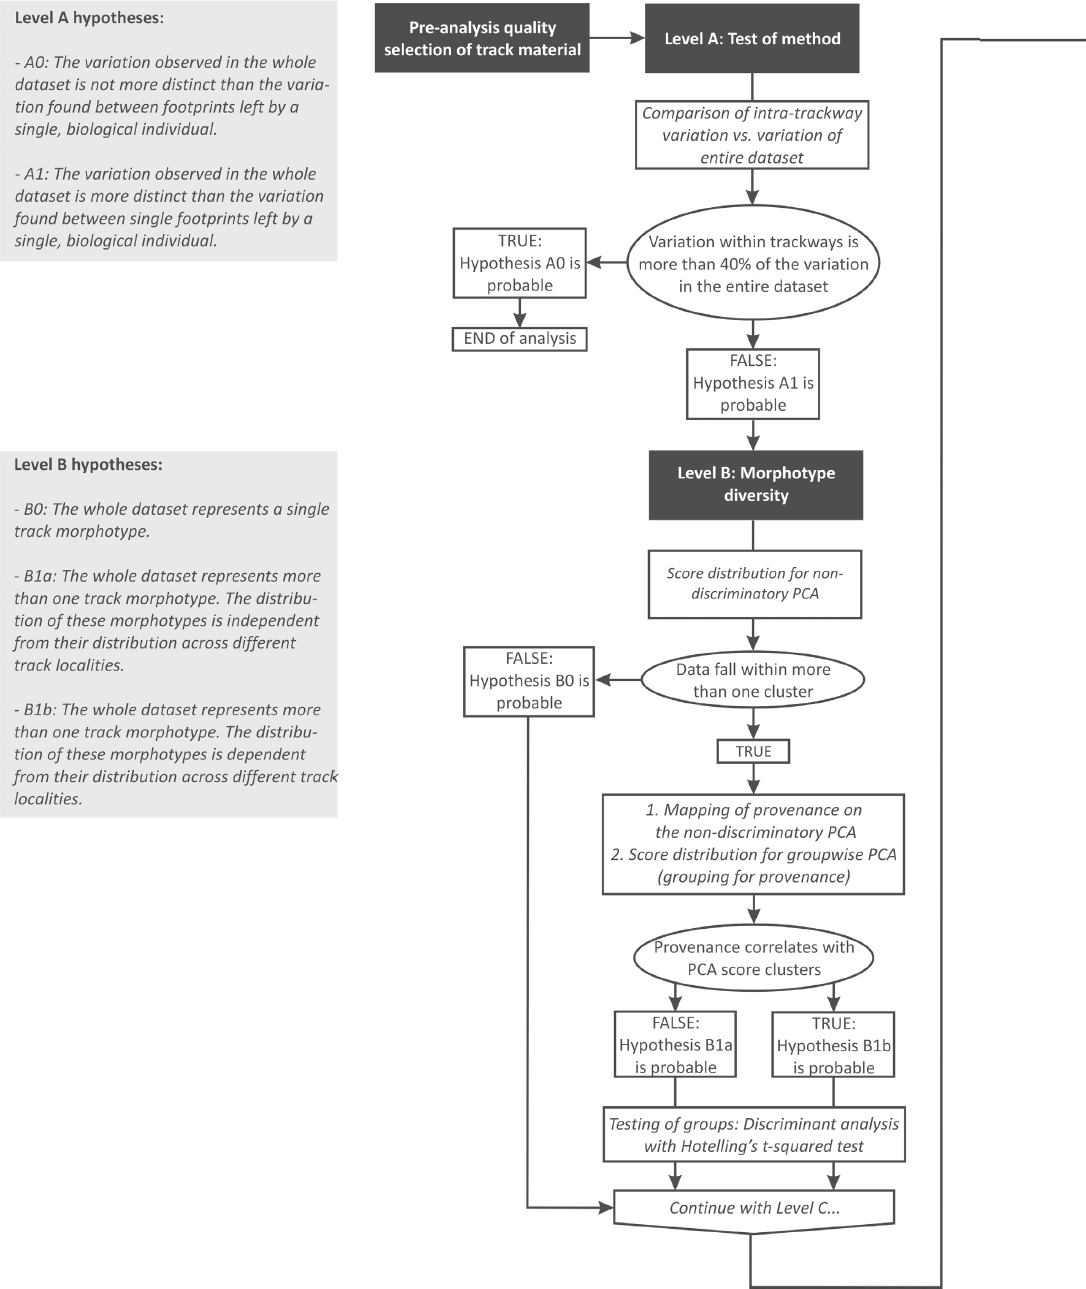
In order to evaluate and interpret the various aspects of potential variation in the data, the data set and various subsets (groups) have been subjugated to a road map of analyses that are either independent from each other or may be dependent in a logical cascade (Fig. 12.6). Key questions addressed include:
Table 12.4. Level A MHL analysis
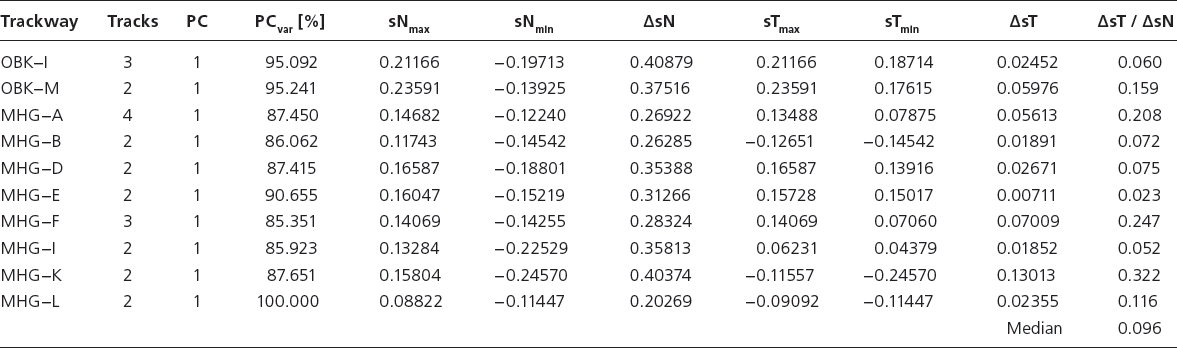
Notes: Variation data for track segments versus the entire data set. PC, principal component used; PCvar, amount of variation represented by the principal component used; sNmax, maximum PCA score for entire data set; sNmin, minimum PCA score of entire data set; ΔsN: range of PCA scores for entire data set; sTmax: maximum PCA score for trackway; sTmin: minimum PCA score for trackway; ΔsT: range of PCA scores for trackway; other abbreviations as in Table 12.1.
• Is there sufficient difference between the variation exhibited by tracks left by a single individual versus the variation among different individuals?
• How many morphometrically/morphologically definable types of tracks are present in the data set?
• How important is the morphometric variation within and between each of these types?
• How should this morphological variation be interpreted in terms of orthotaxonomy, ichnotaxonomy, sexual dimorphism, and ontogeny?
In order to solve these questions, we formulate a set of antagonistic hypotheses, inferences that result from these hypotheses, and anticipations of the results to be expected to either confirm or falsify these hypotheses. This set is arranged in a four-level sequence (A to D) of testing:
Level A: Significance of morphological variation between tracks of individuals (general test of method applicability) – Hypothesis A0: The variation observed in the entire data set is not more distinct than the variation found between tracks left by a single, biological individual. Logical prerequisites: None. All trackway segments must be tested individually against the entire data set.
Inferences: Theoretically, individual tracks from a single trackway, created by a single individual, should show no variation when compared to the overall data set. However, due to a broad range of reasons, including substrate conditions, walking speed, movement, preservation and other factors, no two tracks are identical, even if they were produced during subsequent steps. The applicability of the MHL analysis to the study of variation between individual trackmakers depends upon the ability to differentiate between these obvious inaccuracies and a true anatomical signal. If hypothesis A0 is found probable, the method is unsuitable to evaluate the variation between groups of individual trackmakers, because the statistical signal obtained is not stronger than that from individual measurement errors and nonanatomy-related morphology of the tracks.
Expected PCA results (after a priori grouping for individual trackway segments and the remaining data): The spread of PCA scores across footprints from one or more trackway segments equals 60%–100% of the maximum spread (eigenvalue) along the most significant PC, encompassing the entire variation of the data set.
Hypothesis A1: The variation observed in the entire data set is more distinct than the variation found between single tracks left by a single, biological individual. Logical prerequisites: None. All trackways must be tested individually against the entire data set.
Inferences: The data set shows a wider range of variation than that associated to nonanatomy-related spread of PCA scores. The feasibility of MHL to evaluate the variation between groups of individual trackmakers is confirmed.
Expected PCA results (after a priori grouping for individual trackway segments and the remaining data): The spread of PCA scores across tracks from each trackway segments is distinctly smaller than the maximum spread of the entire data set along the most significant PC. Hypothesis A1 is considered confirmed if the spread within each of the individual trackway segments equals or is less than 40% of the eigenvalue of the entire data set.
Level B: Identification of number of track morphotypes in the data set – Hypothesis B0: The entire data set represents a single track morphotype. Logical prerequisites: Depends on confirmation of hypothesis A1.
Inferences: A single track morphotype is present in the data set. Observed variation resulted from preservational, individual, or ontogenetic variation. Potential morphological differences of trackmakers (if present) are not expressed by the track record.
Expected PCA results: Hypothesis B0 is considered probable if scores from the entire, nondiscriminatory data set do not group into more than one distinct morphospace along the significant PCs.
Hypothesis B1a: The entire data set represents more than one track morphotype. The distribution of these morphotypes is independent from their distribution across different track localities. Logical prerequisites: Depends on confirmation of hypothesis A1.
Inferences: Two or more different morphotypes of track-makers were present sympatrically in at least some of the track localities. These could be interpreted to represent two or more morphotypes of trackmakers, which in turn can be interpreted as either proxies for the presence of several taxa of trackmakers, or (in the case of exactly two morphotypes) as indicators of sexual dimorphism.
Expected PCA results: Hypothesis B1a is considered to be confirmed if scores of the entire, nondiscriminatory data set group into two or more distinct clusters along the significant PCs, and no relationships are found by mapping of provenance on a whole data set PCA.
Hypothesis B1b: The entire data set represents more than one track morphotype. The distribution of these morphotypes is dependent on their distribution across different track localities. Logical prerequisites: Depends upon confirmation of hypothesis A1.
Inferences: Two or more track morphotypes occur not or only partially sympatrically in different localities. This can be interpreted as the occurrence of two or more different morphs/taxa of trackmakers, which occurred spatially or spatially and temporally separated from each other. In the case of exactly two different morphotypes, a spatial separation of dimorphic genders is theoretically possible.
Expected PCA results: Hypothesis B1b is considered to be confirmed if scores of the entire, nondiscriminatory data set group into two or more distinct clusters along the significant PCs and relationships between these clusters are found by mapping of provenance on entire data set PCAs, and the distribution of these clusters is repeated by a PCA with a priori grouping of data according to their locality provenance.
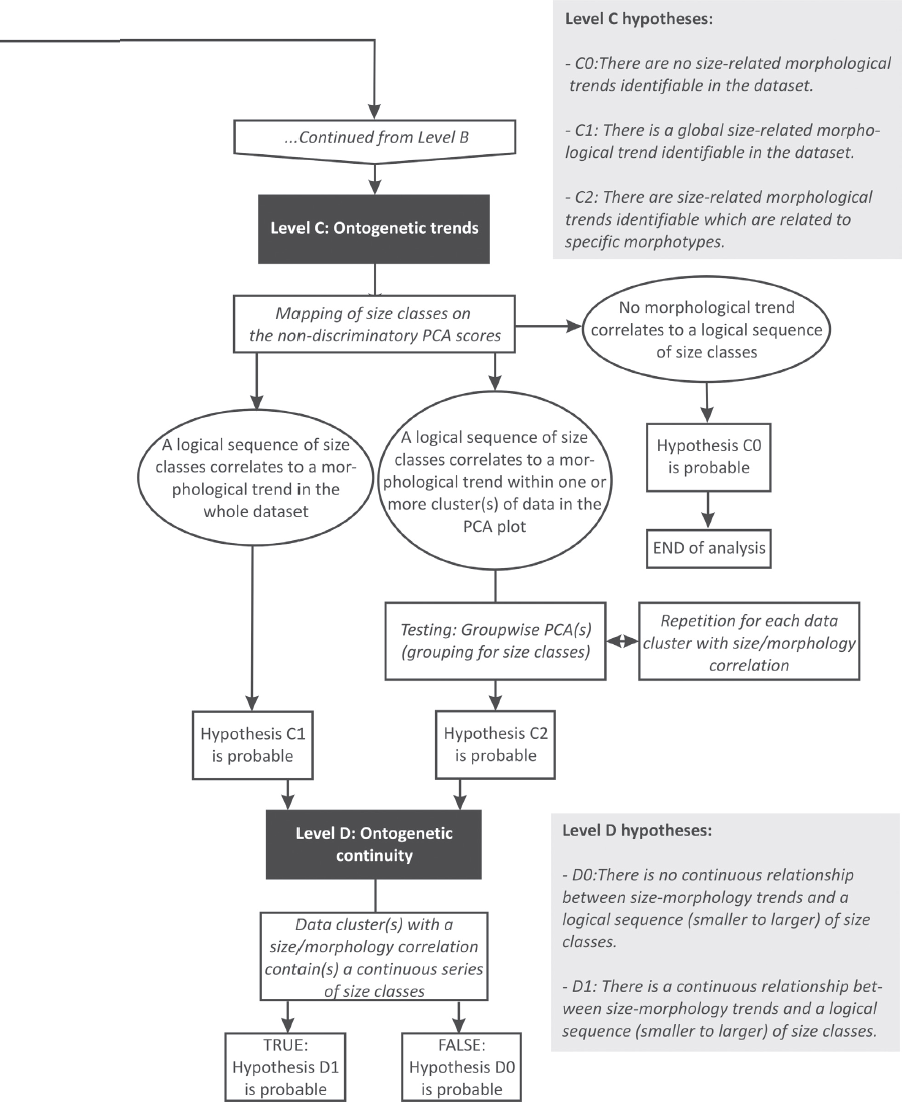
Level C: Identification of size-related morphological trends (allometry) within the data set – Hypothesis C0: There are no size-related morphological trends identifiable in the data set. Logical prerequisites: Depends upon confirmation of hypothesis A1.
Inferences: Allometric effects do not affect anatomical features of the trackmakers that were involved in trackmaking. The degree of variation observed does not correlate with body size and must be explained by alternative means.
Expected PCA results: Mapping of size classes on an entire data set PCA, as well as PCAs with data grouped a priori for size classes, fail to find any relationship of a logical sequence of size classes to score distributions along the significant PCs.
Hypothesis C1: There is a global size-related morphological trend identifiable in the data set. Logical prerequisites: Depends upon confirmation of hypothesis A1.
Inferences: Allometric effects equally affect anatomical features of all trackmaker morphotypes involved. The degree of variation observed does at least partially correlate to body size and can be interpreted as a proxy of ontogenetic variation. The proxy is independent from morphotype discrimination.
Expected PCA results: Mapping of size classes on an entire data set PCA, as well as PCAs with data grouped a priori for size, shows a relationship of a logical sequence of size classes to score distributions along the significant PCs.
Hypothesis C2: There are size-related morphological trends identifiable that are related to specific morphotypes. Logical prerequisites: Depends upon confirmation of hypotheses A1 and B1a or A1 and B1b. The test must be carried out for all morphotypes.
Inferences: Allometric effects affect anatomical features of some trackmaker morphotypes involved, possibly in various degrees and variants. The degree of variation observed does at least partially correlate to body size of the trackmakers and can be interpreted as a proxy of ontogenetic variation. Applicability of the proxy depends on track morphotype.
Expected PCA results: Mapping of size classes on morphotype subset PCA, as well as subset PCAs with data grouped a priori for size, find a relationship of a logical sequence of size classes to score distributions along the significant PCs.
Level D: Identification of continuous or discontinuous size-morphology trends – Hypothesis D0: There is no continuous relationship between size-morphology trends and a logical sequence (smaller to larger) of size classes. Logical prerequisites: Depends upon confirmation of hypotheses A1 and C1 or C2. The test must be carried out for any recognized morphotype and ontogenetic trend.
Inferences: The continuous presence of various ontogenetic stages of a trackmaker in the data set is not evident. The data may be interpreted as showing an episodic presence or recruitments of distinct ontogenetic stages (age classes) of the same trackmaker taxon, or as a hint toward a presence of one or several “cryptic” additional morph(s) of trackmakers, which were not identified at Level B.
Expected PCA results: A mapping of size class distribution on significant PCs does not reveal a continuous, logical sequence.
Hypothesis D1: There is a continuous relationship between size-morphology trends and a logical sequence (smaller to larger) of size classes. Logical prerequisites: Depends upon confirmation of hypotheses A0 and C1. The test must be carried out for all recognized morphotypes.
Inferences: The continuous presence of various ontogenetic stages of a trackmaker in the data set is evident. The data may be interpreted as showing a continuous representation of a trackmaker over its ontogeny in the data set. This may have happened either in the form of ontogenetically mixed social groups, or by time-averaging of the recorded passage of single individuals.
Expected PCA results: A mapping of size class distribution on significant PCs does reveal a continuous, logical sequence.
RESULTS
Level A: Applicability of Method
The proportion of variance of individual trackway segments compared to the entire data set (Table 12.4) ranges from 1.9% to 32.2%, with a median at 9.6% and an arithmetic mean of 13.2%. The high value of 32.2% (Münchehagen trackway MHG-K) may be an exception due to data quality as the two footprint specimens (MHG-K-1 and MHG-K-2) are widely separated in all PCA results. The second highest value scores at 24.7% (MHG-F).
As a result, the variance within the entire data set is distinctly higher than that from tracks of a single individual and the method is considered informative with respect to variation between individuals (hypothesis A1 confirmed).
Level B: Number of Morphotypes in the Data Set
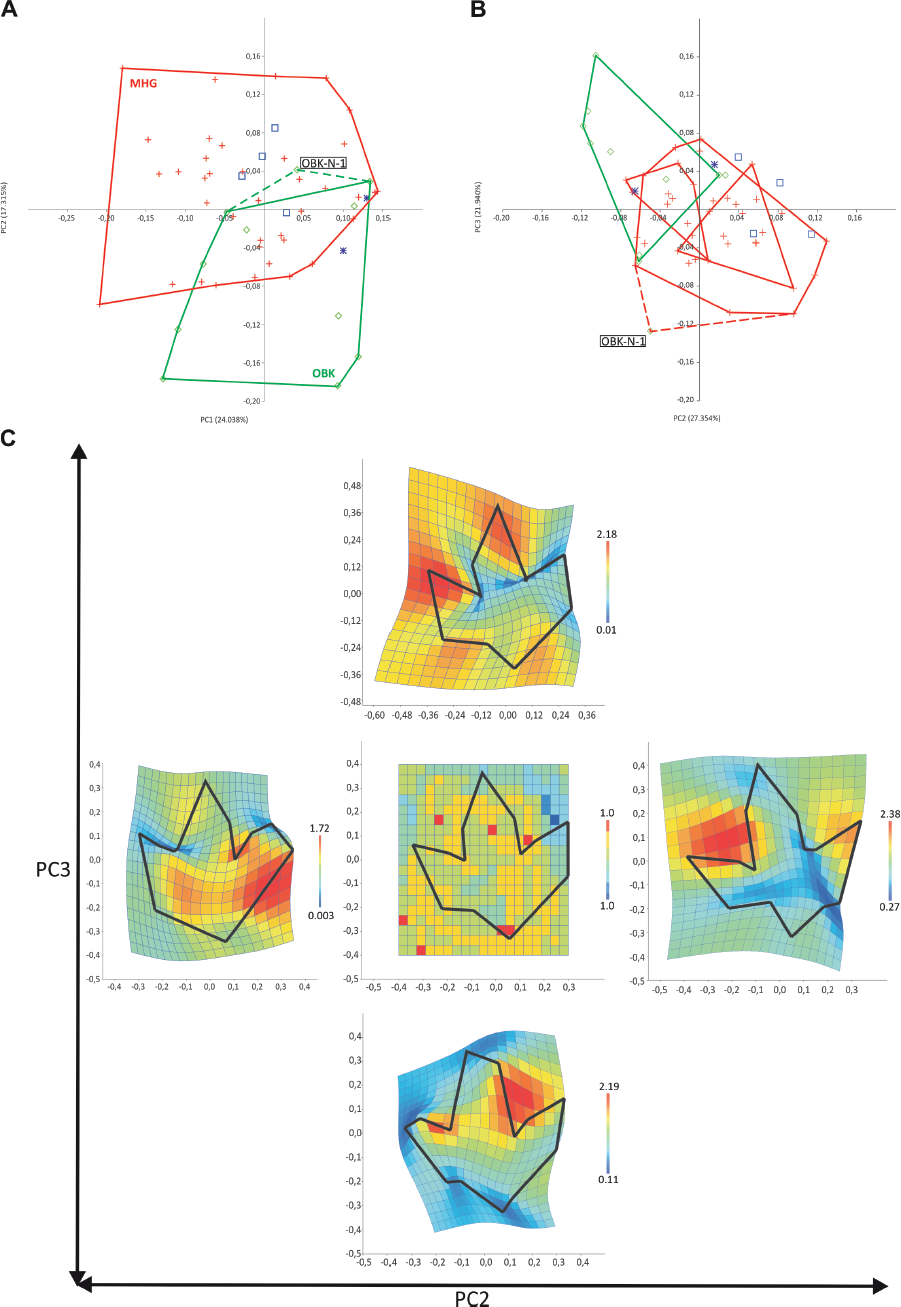
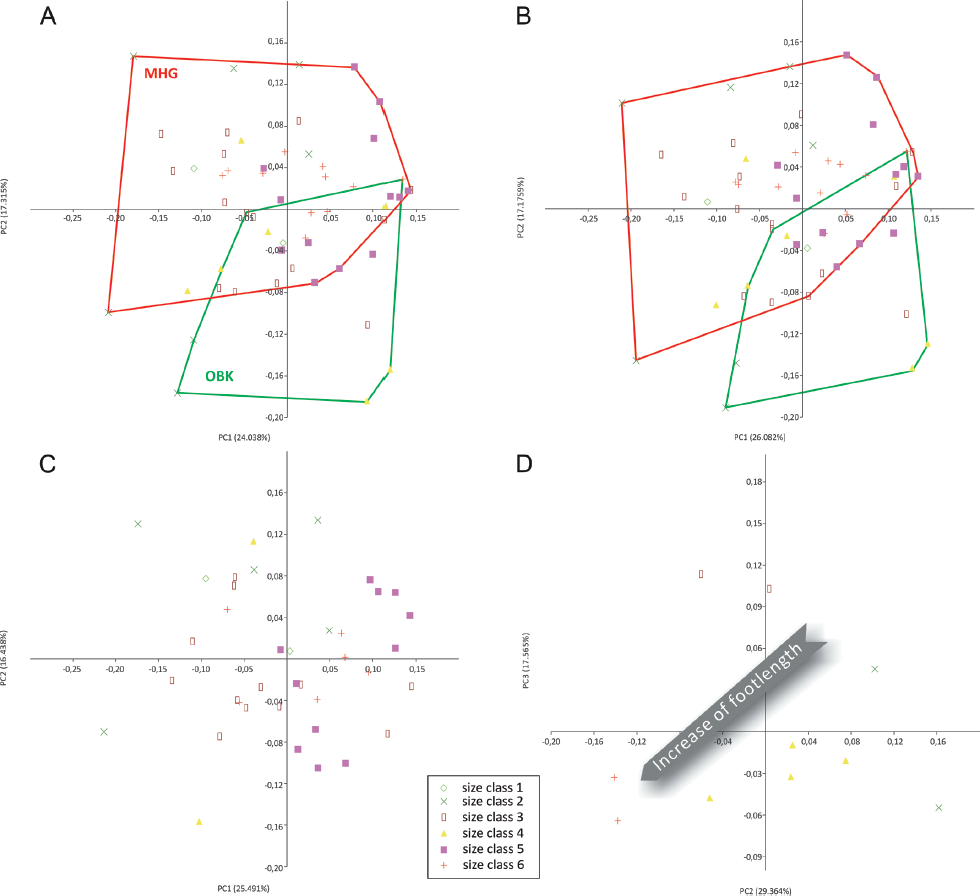
The bivariate plot of the most significant PC1 and PC2 for the entire, nondiscriminatory data set shows no obvious clustering of scores. However, mapping the provenance of the tracks on the same plot reveals a bimodal eigenvalue distribution with a concentration of scores for Münchehagen specimens in the upper left quadrant and for Obernkirchen specimens in the lower right quadrant (Fig. 12.7A). There is a considerable zone of overlap between both populations.
This picture is sharpened when the PCA is carried out with the between-groups option for an a priori grouping by provenance. Fitting to the broken stick curve finds PC2 and PC3 most significant, and a bivariate scatter plot of these shows a similar result to the nondiscriminatory PCA (Fig. 12.7B). However, the groups are slightly more separated, though an area of overlap remains. In the group-wise PCA, most tracks from unknown localities group with the Münchehagen tracks, whereas those from Wölpinghausen fall closer to the Obernkirchen population, though still in the zone of overlap.
Interestingly, OBK-N-1, from the theropod-dominated Chicken Yard track level (Richter, Böhme, and van der Lubbe, 2009; Richter et al., 2012; Richter and Böhme, 2016) at Obernkirchen, falls outside the cloud of other Obernkirchen specimens, which were obtained either from the stratigraphically younger “Upper Surface” track level (Richter et al., 2012) or from unknown horizons at this location. Furthermore, it groups more closely with the specimens from Münchehagen (Figs. 12.7A, 12.7B).
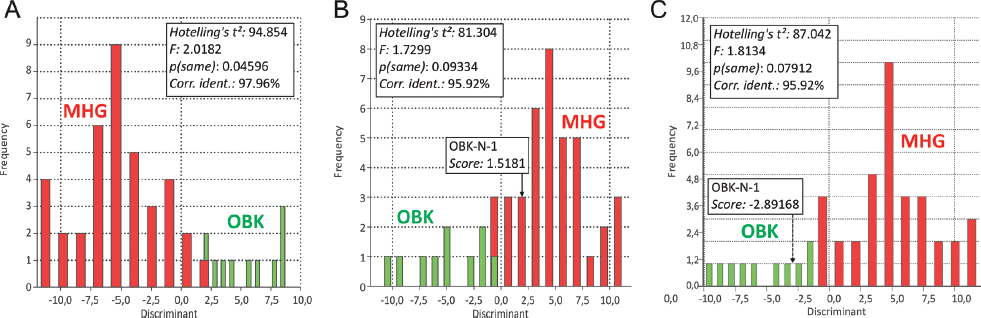
A discriminant analysis with Hotelling’s t-squared test (p-value threshold p = 0.05 for null-hypothesis: both populations have the same mean, Fig. 12.8) finds the populations from Obernkirchen and Münchehagen separated when OBK-N-1 is grouped before the analysis with the Münchehagen tracks (p = 0.09334) or omitted from the test (p = 0.07912), whereas distinction of both populations is blurred by inclusion with the Obernkirchen tracks (p = 0.04596). When OBK-N-1 is grouped a priori with the Münchehagen tracks, this position is confirmed by the discriminant analysis (score: 1.5181), when it is not included in the predefined groups, the discriminant function results with classification in the Obernkirchen group (score: −2.89168). Together with good correspondence of OBK-N-1 with the Münchehagen morphotype in the PCAs, these results may be interpreted tentatively as the occurrence of the Münchehagen morphotype trackmaker in the lower stratigraphic level at Obernkirchen. The shift in classification when classified retrospectively may be the effect of overall relatively small sample, overlap of morphospaces, and noise. Probably due to the same reason, one of the four tracks in trackway MHG-A (MHG-A-1) and an isolated track (MHG-X-9) group with the Obernkirchen morphotype. These aberrations are independent from the grouping of OBK-N-1. The otherwise good distinction of both morphotypes in the discriminant analysis contrasting with their broad overlap in PCAs result from unimodal abundance distributions with well-separated maxima but overlapping spreads. These spreads may be the result of individual variation, allometry, the presence of unrecognized, “cryptic” morphotypes (blending with the morphological spread of the recognized morphotypes), preservation, and other data noise.
12.7. Level B, multivariate, two-dimensional homologous landmark (MHL) analysis. (A) Principal components analysis (PCA), bivariate scatter plot of PC1/PC2 of entire data set with the resulting groups of provenance indicated (the groups were not predefined for data analysis). Dashed green outline: expansion of Obernkirchen (OBK) group to include OBK-N-1. (B) PCA, bivariate scatter plot of PC2/PC3. PCA with between-groups option for entire data set after a priori grouping for provenance. Dashed red line: expansion of Münchehagen (MHG) group to include OBK-N-1. (C) Principal deformation simulation on the mean shape of entire data set for PC2 and PC3 from the analysis in B. Green diamonds: Obernkirchen specimens; red crosses: Münchehagen specimens; navy blue asterisks: Wölpinghausen specimens; blue squares: other specimens from uncertain locality.
12.8. Level B, discriminant analysis with Hotelling’s t-squared test for tracks from Obernkirchen ([OBK], green, morphotype O) and Münchehagen ([MHG], red, morphotype M). (A) OBK-N-1 grouped with morphotype O. (B) OBK-N-1 grouped with morphotype M. (C) OBK-N-1 omitted. The discriminant score calculated for OBK-N-1 is indicated in B and C.
Simulating principal deformation from the mean shape for PC2 from the group-wise PCA (Fig. 12.7C) reveals that this component embraces proportional lengthening and narrowing of the digits compared to FL and a relative transformation from a uniformly isosceles-triangular toward a more cylindrical (digit III) or spindle-shaped (digits II and IV) outline of digits along its eigenvector. PC3 mostly describes a proportional shortening of free digit III in relation to digits II, IV, and the FL along its eigenvector (Fig. 12.7C). Both PCs include increasing digital divarication as a component of shape transformation.
As a result, the group formed by tracks from Obernkirchen (morphotype O) is characterized by a proportionally elongate and slender digit III in extreme examples; toward the data set average, this distinction vanishes. The group formed by tracks from Münchehagen (morphotype M) is characterized by a proportionally short digit III in extreme examples, toward the data set average, this distinction vanishes. The opposing morphological trends and the broad zone of overlap between both morphotypes would itself suggest that the data represent a morphological continuum. However, the extremes of both groups are confined to their respective localities. They are independent from size distribution, and show different ontogenetic signals and are therefore considered different morphotypes (hypothesis B1b confirmed). At present, though, there is a relatively broad overlap between both morphotypes, and specimens falling in this overlap zone may not be properly determinable.
Level C: Ontogenetic Trends
A mapping of size classes on an entire data set, nondiscriminatory PCA (PC1/PC2) bivariate plot, as well as a PCA carried out on a priori–defined size class groups do not yield a global logical distribution of size classes (hypothesis C1 falsified) (Fig. 12.9A).
A mapping of size classes on a morphotype M data subset PCA (PC1/PC2) bivariate plot, as well as a morphotype M data subset PCA after a priori size class grouping do not reveal any logical distribution of size classes (hypothesis C2 falsified for morphotype M) (Fig. 12.9B, 12.9C).
A mapping of size classes on a morphotype O data subset PCA finds a logical, sequential size class distribution across the PCA scores, which is confirmed after a priori size class grouping (Fig. 12.9D). The group-wise PCA results in seven PCs, of which PC2 and PC3 are significant and account for 29.364% and 17.565% of variance, respectively. However, a logical sequence of size classes correlates best with PC2, though there is a broad overlap in the intermediate sizes (Fig. 12.10). This is interpreted as documenting an allometric trend toward proportionally longer, narrower, and more spindle-shaped digits during ontogeny (hypothesis C2 confirmed for morphotype O), though caution must be given to the small sample of morphotype O. When compared to morphotype M, the largest specimens approach the zone of overlap of both morphotypes, indicating that the most distinctive morphology of this morphotype is exhibited by specimens from earlier ontogenetic stages (Fig. 12.11).
12.9. Level C and D, MHL analyses. (A) PCA, bivariate scatter plot for PC1/PC2 of entire data set with the distribution of size classes mapped by symbols (the groups were not predefined for data analysis). (B) PCA, bivariate scatter plot for PC1/PC2. PCA with between-groups option for entire data set after a priori grouping for class sizes. (C) PCA, bivariate scatter plot for PC1/PC2, calculated with between-groups option for morphotype M tracks, after a priori grouping for class sizes. (D) PCA, bivariate scatter plot for PC2/PC3, calculated with between-groups option for morphotype O tracks, after a priori grouping for class sizes (OBK-N-1 omitted). Abbreviations as in Figure 12.7.
Level D: Ontogenetic Continuity
Size classes 1 and 5 are missing from the sample of morphotype O. However, it has to be kept in mind, that the subsample, upon which this test applies, is relatively small (n = 10) and the absence of these size classes do not permit a reasonable conclusion on ontogenetic continuity in the data set.
DISCUSSION
The multivariate homologous 2-D-landmark eigenanalyses of the data set reveal quantitatively defined morphological groups that surprisingly do not reflect intuitive qualitatively assessed groupings. From a qualitative point of view, some track specimens seem to be quite different from others, raising the question whether they were made by different taxa of trackmakers or by different ontogenetic stages of the same trackmaker taxon (e.g., Hornung and Reich, 2012). This also holds true for specimens of preservational classes I and II, in which the autopodial morphology is well represented and substrate differences or other nonanatomy-related modifications do not play an important role. However, the numerical analysis shows that a broad range of morphologies form two wide morphometric clusters, which further overlap in a considerable area. According to the facts that specimens forming the two clusters are found separated at two different localities and that one of the clusters shows an ontogenetic, allometric signal while the other does not, they are considered to represent two distinct morphotypes (M and O, Fig. 12.11) and probably two different orthotaxa of trackmakers. Both morphotypes encompass short-toed and broadly triangulartoed morphologies as used to define the ichnogenus Iguanodontipus (Sarjeant, Delair, and Lockley, 1998), as well as the far more abundant long- and slender-toed type, which was most commonly described from Germany (e.g., Struckmann, 1880; Ballerstedt, 1905, 1914; Dietrich, 1927; Lehmann, 1978; Diedrich, 2004; Lockley, Wright, and Thies, 2004), England (e.g., Beckles, 1852; Woodhams and Hines, 1989; Parkes, 1993; Radley, Barker, and Harding, 1998; Pollard and Radley, 2011), Spain (e.g., Pascual-Arribas et al., 2009; Cobos and Gascó, 2012; Castanera et al., 2013), and Portugal (Santos, Callapaz, and Rodrigues, 2012). The most important morphological differences are found here to be related to ontogeny and allometry, at least for part of the tracks (morphotype O) (Fig. 12.11). Tracks exhibiting a morphology similar to the ichnoholotype of Iguanodontipus burreyi Sarjeant, Delair, and Lockley, 1998, are located near one end of an ontogenetic continuum between both morphologies, representing young individuals (Figs. 12.10 and 12.11). Interestingly, the morphometrical analysis of 43 iguanodontian tracks from the Cameros Basin (Spain) by Moratalla and Marugán-Lobón (2009) also resulted in a potential allometric trend in the sample, but, contrary to morphotype O, the tracks became relatively broader with increasing size. Even in the morphotype M, with no recognizable ontogenetic pattern in the data set, this morphology is scattered unordered (when considering size) among the morphological cluster and does not form a separate group. This may be a hint that further “cryptic” morphotypes may be hidden in the morphotype M cluster. This, however, cannot be resolved with the applied method. The continuity of the presence of morphotype O trackmakers of all ontogenetic stages (above a minimum size not yet recorded by tracks less than 23 cm FL) cannot be evaluated, considering the small data sample. The close association of tracks from several ontogenetic stages (GPMH specimen from Geologisch-Paläontologisches Museum der Universität Hamburg) on the same track horizon with the same general direction of locomotion (Lehmann, 1978) may suggest that a continuum of several ontogenetic stages formed social groups, though this aspect must be studied further.
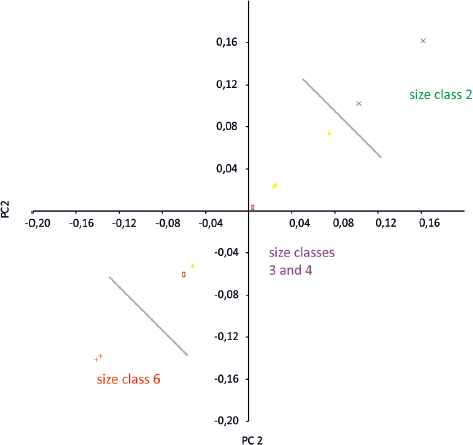
12.10. Level C and D, MHL analysis. Scatter plot for PC2/PC2 score distribution, calculated with between-groups option for morphotype O tracks, after a priori grouping for size classes (OBK-N-1 omitted). Note the linear arrangement of size class distribution with the extremes (classes 2 and 6) on opposite poles of variance. Size class symbols as in Figure 12.9. Abbreviations as in Figure 12.7.
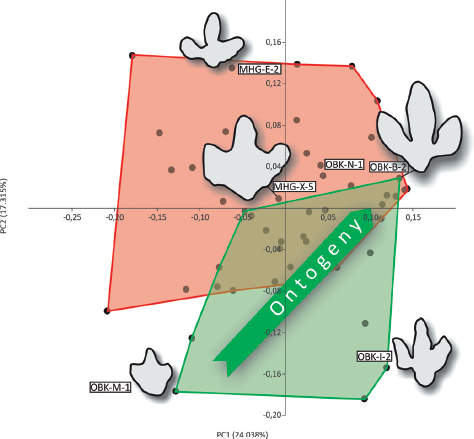
12.11. Interpretation of morphotype grouping, ontogenetic trend, and outlines of example specimens representing morphological extremes for each quadrant and near-average morphologies of tracks for the entire data set PCA (compare with Fig. 12.7A). All tracks mirrored to represent right-side impressions. Abbreviations as in Figure 12.7.
From analyzing FL, FW, and the ratio between both of a much larger track data set (n = 598), Matsukawa, Lockley, and Hunt (1999) identified three age classes (juvenile, subadult, and adult) of iguanodontian ornithopods in the “mid”-Cretaceous Dakota Group of the western United States. Mapping these age classes across their occurrences showed that all three co-occurred in most localities with large data samples. However, the presence of distinctive age classes in the sample suggest that the tracksites were not frequented continuously by individuals of all ontogenetic stages but probably represent a periodic (yearly?) passing of the population(s). It should be noted that Matsukawa, Lockley, and Hunt (1999) treated the entire track population as having been created by a single orthotaxon (or at least as representing the same ontogenetic pattern of several closely related taxa), an assumption that has to be considered with caution regarding the osteological evidence for relatively high taxonomic diversity of sympatric iguanodontian communities (e.g., Horner, Weishampel, and Foster, 2004; Norman, 2011).
From an ichnotaxonomic point of view, the results bring up a number of critical aspects. On the one hand, it seems that the data show that (potential) distinctions of vertebrate ichnotaxa based upon qualitative morphological criteria may easily underestimate the continuous morphological bandwidth of such a morphological group that is revealed when it is evaluated by quantitative analysis. This is especially true for aspects of ontogenetic variation, which is nearly impossible to determine based upon qualitative analysis of specimens, with exception in the case in which it may be postulated based upon independent evidence, for example, for gregarious behavior. On the other hand, the numerical analysis may expose a higher diversity of trackmakers than is obvious from qualitative analysis of the track record. Given that the data quality and quantity is in many cases not sufficient for a numerical analysis – a fate shared with orthotaxonomy – a qualitative approach to ichnotaxonomy is inevitable. However, utmost caution is due if ichnotaxonomic decisions are based solely or mostly upon morphometric criteria, such as length ratios, toe divarication angles, and so on. Ichnotaxa should be based primarily on qualitative characters that can be described as present or absent, or being of a qualitatively definable shape, rather than by size relations. An example are the ornithopod tracks from Obernkirchen mentioned by Böhme et al. (2009) and Richter et al. (2012) as ?Caririchnium isp., which clearly differ from the material used in this study by characters such as the presence of additional pad-like structures in the metatarsal region, which are regarded as primary anatomical features of its producer. Optimally such characters are identifiable on a single autopodial impression, with trackway characters adding a secondary level of characters if available (and not related to trackmaker behavior rather than anatomy). It can be argued that, as a result of the analysis presented herein, the ichnogenus Iguanodontipus is suitable to contain all of the studied material (and therefore the bulk of large ornithopod tracks from the early Cretaceous of Lower Saxony). This view is qualitatively supported by the latest review of iguanodontian ornithopod ichnotaxonomy by Díaz-Martínez et al. (2015). These authors strongly reduced the vast amount of proposed ichnotaxa and modified the diagnosis of Iguanodontipus as previously given by Sarjeant, Delair, and Lockley (1998) and Meyer and Thüring (2003) to include a wider range of morphologies accordingly (see also Castanera et al., 2013). However, a thorough evaluation of this matter is beyond the scope of this work.
The proposed method to evaluate questions of trackmaker diversity, paleobiology, and ichnotaxonomic concepts and their meaning seems to be promising. It can, however, only be a first attempt and further work should concentrate on expanding the database and including a wider range of morphotypes to elucidate their relationships. It should also be a line of further investigation to improve the chosen system of landmarks for better results and the handling of missing and suboptimal data.
CONCLUSIONS
Multivariate homologous 2-D-landmark analyses are carried out to evaluate their usefulness and results for a set of iguanodontian ornithopod pes tracks from the Berriasian of northwestern Germany. Comparison of multitrack trackway segments with the entire data set shows that the range of variance found in the former only accounts for a maximum of 32.2% of the entire variation. The latter is therefore interpreted to represent variation between individuals. A nondiscriminatory PCA of the entire data set found two populations of scores, which form two overlapping clusters, interpreted to represent two morphotypes (O and M). The distribution of morphotypes correlates with the provenance of the tracks, further supporting the existence of two different populations of trackmakers. The two morphotypes were also found in a discriminatory PCA after an a priori grouping for provenances, as well as in a discriminant analysis with Hotelling’s t-squared test. Morphotype O is less abundant than morphotype M and occurs with certainty only at the Upper Surface track level in Obernkirchen. Morphotype M mainly occurs at Münchehagen, a single occurrence may be at the lower Chicken Yard track level at Obernkirchen. Other material from uncertain provenance falls more or less in the zone of morphological overlap between both morphotypes and is ambiguous in its determination.
Mapping size classes on the nondiscriminatory PCA, as well as a discriminatory PCA after a priori grouping for size classes show that morphological extremes are related to smaller size, whereas larger specimens occupy the zone of overlap between the morphotypes. In the case of morphotype O, a clear morphological trend correlates to an increase of size, suggesting an ontogenetic signal and allometry in the trackmaker. Ontogenetic continuity cannot be assessed for morphotype O because of the small sample size. For morphotype M, size does not follow a recognizable trend in morphology, and there was no indication for an ontogenetic signal.
The data suggest that qualitatively quite different ornithopod tracks form a morphological continuum, in which variation is partly explainable by ontogeny. On the other hand, the data set may contain more than one morphotype that cannot be defined by qualitative characters. This raises the warning to base strict ichnotaxonomic separation of morphotypes on qualitative characters rather than on morphometric differences of otherwise very similar morphologies. The method presented here is promising to evaluate variation in track data sets and to interpret it in terms of ichnotaxonomy, orthotaxonomy, and ontogenesis of the trackmaker. This is an interesting perspective regarding the relative abundance of tracks when compared to skeletal material. However, the method requires further refinement and confirmation by adding larger data sets and studying alternative landmark sets and analysis methods.
ACKNOWLEDGMENTS
We thank D. Castanera, J. Moratalla, and the editor P. Falkingham for thoughtful reviews of the manuscript. U. Kotthoff, Geologisch-Paläontologisches Museum der Universität Hamburg (GPMH), and A. Twachtmann-Schlichter, Museum Bückeburg (Museum für Stadtgeschichte und Schaumburg-Lippische Landesgeschichte, Bückeburg), kindly granted access to specimens under their care, and S. Sachs and K. Sachs provided additional information on the GPMH specimens. We additionally thank A. Richter, “E.” Widmann, Niedersächsisches Landesmuseum Hannover (NLMH), and S. Guichard (student apprentice at NLMH) for support with the track material at the NLMH, as well as V. J. Roden for a linguistic review of the manuscript.
APPENDIX
Supplemental files can be found at http://dx.doi.org/10.6084/m9.figshare.1348327.
REFERENCES
Abel, O. 1935. Vorzeitliche Lebensspuren. G. Fischer, Jena, Germany, 644 pp.
Avanzini, M., L. Piñuela, and J. C. García-Ramos. 2008. Theropod palaeopathology inferred from a Late Jurassic trackway, Asturias (N. Spain). Oryctos 8: 71–75.
Ballerstedt, M. 1905. Über Saurierfährten der Wealdenformation Bückeburgs. Naturwissenschaftliche Wochenschrift (Neue Folge) 4(31): 481–485.
Ballerstedt, M. 1914. Bemerkungen zu den älteren Berichten über Saurierfährten im Wealdensandstein und Behandlung einer neuen, aus 5 Fußabdrücken bestehenden Spur. Centralblatt für Mineralogie, Geologie und Paläontologie [1914](2): 48–64.
Barco, J. L., J. I. Canudo, and J. I. Ruiz-Omeñaca. 2006. New data on Therangospodus oncalensis from the Berriasian Fuentesalvo tracksite (Villar del Río, Soria, Spain): an example of gregarious behavior in theropod dinosaurs. Ichnos 13: 237–248.
Barnes, F. A., and M. G. Lockley. 1994. Trackway evidence for social sauropods from the Morrison Formation, eastern Utah (USA). Gaia 10: 37–42.
Beckles, S. H. 1852. On the Ornithoidichnites of the Wealden. Quarterly Journal of the Geological Society 8: 396–397.
Belvedere, M. 2008. Ichnological researches on the Upper Jurassic dinosaur tracks in the Iouaridène area (Demnat, central High-Atlas, Morocco). Ph. D. dissertation, Università degli Studi di Padova, Padua, Italy, 121 pp.
Belvedere, M. and J. O. Farlow. 2016. A numerical scale for quantifying the quality of preservation of vertebrate tracks; chap. 6 in P. L. Falkingham, D. Marty, and A. Richter (eds.), Dinosaur Tracks: The Next Steps. Indiana University Press, Bloomington, Indiana.
Berner, U. 2011. The German Wealden, an unconventional hydrocarbon play? Erdöl, Erdgas, Kohle 127: 303–306.
Bertling, M., S. J. Braddy, R. G. Bromley, G. R. Demathieu, J. Genise, R. Mikulás, J. K. Nielsen, K. S. S. Nielsen, A. K. Rindsberg, M. Schlirf, and A. Uchman. 2006. Names for trace fossils: a uniform approach. Lethaia 39: 265–286.
Böhme, A., U. Stratmann, M. Wiggenhagen, T. van der Lubbe, and A. Richter. 2009. New tracks on the rock: parallel trackways of a new type of Iguanodontipus-Caririchnium-like morphology from the Lower Cretaceous sandstones of Obernkirchen, northern Germany. Journal of Vertebrate Paleontology 29(3): 66A.
Bose, S., and H. S. Chafetz. 2009. Topographic control on distribution of modern microbially induced sedimentary structures (MISS): a case study from Texas coast. Sedimentary Geology 213: 136–149.
Breithaupt, B. H., and N. A. Matthews. 2012. Neoichnology and photogrammetric ichnology to interpret theropod community dynamics; p. 17 in A. Richter and M. Reich (eds.), Dinosaur Tracks 2011. An International Symposium, Obernkirchen, April 14–17, 2011. Abstract Volume and Field Guide to Excursions. Universitäts-Verlag, Göttingen, Germany.
Brett-Surman, M. K., and J. R. Wagner. 2007. Discussion of character analysis of the appendicular anatomy in Campanian and Maastrichtian North American hadrosaurids – variation and ontogeny; pp. 135–170 in K. Carpenter (ed.), Horns and Beaks. Ceratopsian and Ornithopod Dinosaurs. Indiana University Press, Bloomington, Indiana.
Bromley, R. G. 1990. Trace Fossils: Biology and Taphonomy. Unwin Hyman, London, U.K., 280 pp.
Buckley, L. G., R. T. McCrea, and M. G. Lockley. 2016. Analysing and resolving Cretaceous avian ichnotaxonomy using multivariate statistical analyses: approaches and results; chap. 15 in P. L. Falkingham, D. Marty, and A. Richter (eds.), Dinosaur Tracks: The Next Steps. Indiana University Press, Bloomington, Indiana.
Carpenter, K. 1992. Behavior of hadrosaurs as interpreted from footprints in the ‘Mesaverde’ Group (Campanian) of Colorado, Utah, and Wyoming. Rocky Mountain Geology 29: 81–96.
Carrano, M. T., and J. A. Wilson. 2001. Taxon distributions and the tetrapod track record. Paleobiology 27: 563–581.
Castanera, D., J. Colmenar, V. Sauqué, and J. I. Canudo. 2015. Geometric morphometric analysis applied to theropod tracks from the Lower Cretaceous (Berriasian) of Spain. Palaeontology 58(1): 183–200.
Castanera, D., C. Pascual, N. L. Razzolini, B. Vila, J. L. Barco, and J. I. Sanz. 2013. Discriminating between medium-sized tridactyl trackmakers: tracking Ornithopod tracks in the base of the Cretaceous (Berriasian, Spain). PLoS One 8(11): e81830. doi: 10.1371/journal.pone.0081830.
Castanera, D., J. L. Barco, I. Díaz-Martínez, J. Herrero Gascón, F. Pérez-Lorente, and J. I. Canudo. 2011. New evidence of a herd of titanosauriform sauropods from the lower Berriasian of the Iberian range (Spain). Palaeogeography, Palaeoclimatology, Palaeoecology 310: 227–237.
Cobos, A., and F. Gascó. 2012. Presencia del icnogénero Iguanodontipus en el Cretácico Inferior de la provincia de Teruel (España). Geogaceta 52: 185–188.
Dantas, P., V. F. dos Santos, M. G. Lockley, and C. A. Meyer. 1994. Footprint evidence for limping dinosaurs from the Upper Jurassic of Portugal. Gaia 10: 43–48.
Davis, J. C. 1986. Statistics and Data Analysis in Geology. John Wiley & Sons, New York, New York, 550 pp.
Day, J. J., D. B. Norman, A. S. Gale, P. Upchurch, and H. P. Powell. 2004. A Middle Jurassic dinosaur trackway site from Oxfordshire, UK. Palaeontology 47: 319–348.
Díaz-Martinez, I., X. Pereda-Suberbiola, F. Pérez-Lorente, and J. I. Canudo. 2015. Ichnotaxonomic review of large ornithopod dinosaur tracks: temporal and geographic implications. PLoS One 10(2): e0115477.
Diedrich, C. 2004. New important iguanodontid and theropod trackways of the tracksite Obernkirchen in the Berriasian of NW Germany and megatracksite concept of Central Europe. Ichnos 11: 215–228.
Dietrich, O. W. 1927. Über Fährten ornithopodider Saurier im Oberkirchner Sandstein. Zeitschrift der Deutschen Geologischen Gesellschaft 78: 614–621.
Dollo, L. 1883. Troisième note sur les dinosauriens de Bernissart. Bulletin du Musée Royal d’Histoire Naturelle de Belgique 2: 85–126.
Elstner, F., and J. Mutterlose. 1996. The Lower Cretaceous (Berriasian and Valanginian) in NW Germany. Cretaceous Research 17: 119–133.
Falkingham, P. L. 2014. Interpreting ecology and behaviour from the vertebrate fossil track record. Journal of Zoology 292: 222–228. doi: 10.1111/jzo.12110.
Falkingham, P. L. 2016. Applying objective methods to subjective track outlines; chap. 4 in P. L. Falkingham, D. Marty, and A. Richter (eds.), Dinosaur Tracks: The Next Steps. Indiana University Press, Bloomington, Indiana.
Falkingham, P. L., K. T. Bates, L. Margetts, and P. L. Manning. 2011. The ‘Goldilocks’ effect: preservation bias in vertebrate track assemblages. Journal of the Royal Society, Interface 8(61): 1142–1154.
Falkingham, P. L., L. Margetts, I. M. Smith, and P. L. Manning. 2009. Reinterpretation of palmate and semi-palmate (webbed) fossil tracks: insights from finite element modelling. Palaeogeography, Palaeoclimatology, Palaeoecology 271: 69–76.
Farlow, J. O. 1987. Lower Cretaceous dinosaur tracks, Paluxy River Valley, Texas; pp. 1–50 in Field Trip Guidebook, South-Central Section, Geological Society of America, Baylor University, Waco. Geological Society of America, Boulder, Colorado.
Foster, J. R., and D. J. Chure. 2006. Hindlimb allometry in the Late Jurassic theropod dinosaur Allosaurus with comments on its abundance and distribution; pp. 119–122 in J. R. Foster and S. G. Lucas (eds.), Paleontology and Geology of the Upper Jurassic Morrison Formation. Bulletin 36. New Mexico Museum of Natural History and Science, Albuquerque, New Mexico.
Grabbe, H. 1881. Neue Funde von Saurier-Fährten im Wealdensandsteine des Bückeberges. Verhandlungen des naturhistorischen Vereines der preussischen Rheinlande und Westfalens, Correspondenzblatt 38 (=Vierte Folge, 8): 161–164.
Grupe, O. 1931. Über Wurzelböden im Wealdensandstein der Bückeberge um ihre Bedeutung für den Rhythmus dynamischer Vorgänge. Zeitschrift der Deutschen Geologischen Gesellschaft 83: 224–234.
Hammer, Ø. 2012. PAST, PALeontological STatistics, Version 2.17. Reference Manual. Natural History Museum, University of Oslo, Oslo, Norway, 229 pp.
Hammer, Ø., and D. A. T. Harper. 2006. Paleontological Data Analysis. Blackwell Publishing, New York, New York, 351 pp.
Hammer, Ø., D. A. T. Harper, and P. D. Ryan. 2001. PAST: Paleontological Statistics software package for education and data analysis. Palaeontologia Electronica 4(1): 1–9.
Harper, D. A. T. (ed.) 1999. Numerical Palaeobiology. New York: John Wiley & Sons, New York, New York, 478 pp.
Hawthorne, J. M. 1990. Dinosaur track-bearing strata of the Lampasas Cut Plain and Edwards Plateau, Texas. Baylor Geological Studies Bulletin 49: 1–45.
Horner, J. R., D. B. Weishampel, and C. A. Foster. 2004. Hadrosauridae; pp. 438–463 in D. B. Weishampel, P. Dodson, and H. Osmolska (eds.), The Dinosauria. 2nd edition. University of California Press, Berkeley, California.
Hornung, J. J., and M. Reich. 2007. Krokodile, Schildkröten & Dinosaurier. Die ‘Wealden’-Sammlung der Universität Göttingen. Fossilien 24(1): 32–36.
Hornung J. J., and M. Reich. 2012. Excursion Guide C2: Dinosaur tracks from the Berriasian Obernkirchen Sandstone on exhibit at the Göttingen University Geopark; pp. 169–187 in A. Richter and M. Reich (eds.), Dinosaur Tracks 2011. An International Symposium, Obernkirchen, April 14–17, 2011. Abstract Volume and Field Guide to Excursions. Universitäts-Verlag, Göttingen, Germany.
Hornung, J. J., A. Böhme, and M. Reich. 2012a. Excursion Guides A–C: the ‘German Wealden’ and the Obernkirchen Sandstone: an introduction; pp. 62–72 in Richter, A. and M. Reich (eds.), Dinosaur Tracks 2011. An International Symposium, Obernkirchen, April 14–17, 2011. Abstract Volume and Field Guide to Excursions. Universitäts-Verlag, Göttingen, Germany.
Hornung, J. J., A. Böhme, and M. Reich. 2012b. Excursion Guide B2: Wölpinghausen; pp. 143–149 in A. Richter and M. Reich (eds.), Dinosaur Tracks 2011. An International Symposium, Obernkirchen, April 14–17, 2011. Abstract Volume and Field Guide to Excursions. Universitäts-Verlag, Göttingen, Germany.
Hornung, J. J., A. Böhme, T. van der Lubbe, M. Reich, and A. Richter. 2012. Vertebrate tracksites in the Obernkirchen Sandstone (late Berriasian, Early Cretaceous) of northwest Germany – their stratigraphical, palaeogeographical, palaeoecological, and historical context. Paläontologische Zeitschrift 86: 231–267.
Hübner, T. 2016. Elusive ornithischian tracks in the famous Berriasian (Lower Cretaceous) Chicken Yard-tracksite of northern Germany: quantitative differentiation between small tridactyl track makers; chap. 16 in P. L. Falkingham, D. Marty, and A. Richter (eds.), Dinosaur Tracks: The Next Steps. Indiana University Press, Bloomington, Indiana.
Hunt, A. P., and S. G. Lucas. 2007. Tetrapod ichnofacies: a new paradigm. Ichnos 14: 59–68.
Ishigaki, S., and M. G. Lockley. 2010. Didactyl, tridactyl and tetradactyl theropod trackways from the Lower Jurassic of Morocco: evidence of limping, labouring and other irregular gaits. Historical Biology 22(1–3): 100–108.
Jackson, D. A. 1993. Stopping rules in principal components analysis: a comparison of heuristical and statistical approaches. Ecology 74: 2204–2214. Jackson, S. J., M. A. Whyte, and M. Romano. 2009. Laboratory-controlled simulations of dinosaur footprints in sand: a key to understanding vertebrate track formation and preservation. Palaios 24: 222–238.
Jackson, S. J., M. A. Whyte, and M. Romano. 2010. Range of experimental dinosaur (Hypsilophodon foxii) footprints due to variation in sand consistency: how wet was the track? Ichnos 17: 197–214.
Kilbourne, B. M., and P. J. Makovicky. 2010. Limb bone allometry during postnatal ontogeny in non-avian dinosaurs. Journal of Anatomy 217: 135–152.
Kuhn, O. 1958. Die Fährten der vorzeitlichen Amphibien und Reptilien. Meisenbach, Bamberg, Germany, 64 pp.
Lehmann, U. 1978. Eine Platte mit Fährten von Iguanodon aus dem Obernkirchener Sandstein (Wealden). Mitteilungen aus dem Geologisch-Paläontologischen Institut der Universität Hamburg 48: 101–114.
Leonardi, G. 1984. Le impronte fossili di dinosauri; pp. 165–186 in J. F. Bonaparte, E. H. Colbert, P. J. Currie, A. de Ricqles, Z. Kielan-Jaworowska, G. Leonardi, N. Morello, and P. Taquet (eds.), Sulle orme dei dinosauri. Editio Editrice, Venice, Italy.
Leonardi, G. 1989. Inventory and statistics of the South American dinosaurian ichnofauna and its paleobiological interpretation; pp. 333–336 in D. D. Gillette and M. G. Lockley (eds.), Dinosaur Tracks and Traces. Cambridge University Press, Cambridge, UK.
Lockley, M. G. 2007. A tale of two ichnologies: the different goals and potentials of invertebrate and vertebrate (tetrapod) ichnotaxonomy and how they relate to ichnofacies analysis. Ichnos 14: 39–57.
Lockley, M. G., and M. Matsukawa. 1999. Some observations on trackway evidence for gregarious behavior among small bipedal dinosaurs. Palaeogeography, Palaeoclimatology, Palaeoecology 150: 25–31.
Lockley, M., C. Meyer, and V. F. dos Santos. 1994. Trackway evidence for a herd of juvenile sauropods from the Late Jurassic of Portugal. Gaia 10: 27–35.
Lockley, M. G., J. L. Wright, and D. Thies. 2004. Some observations on the dinosaur tracks at Münchehagen (Lower Cretaceous), Germany. Ichnos 11: 261–274.
Lockley, M. G., K. J. Houck, and N. K. Prince. 1986. North America’s largest dinosaur trackway site: implications for Morrison Formation paleoecology. Geological Society of America Bulletin 97: 1163–1176.
Lockley, M. G., A. P. Hunt, J. Moratalla, and M. Matsukawa. 1994. Limping dinosaurs? Trackway evidence for abnormal gaits. Ichnos 3: 193–202.
Lockley, M., A. S. Schulp, C. A. Meyer, G. Leonardi, and M. Maimani. 2002. Titanosaurid trackways from the Upper Cretaceous of Bolivia: evidence for large manus, wide-gauge locomotion and gregarious behaviour. Cretaceous Research 23: 383–400.
Lockley, M., J. Wright, D. White, M. Matsukawa, L. Jianjun, F. Lu, and L. Hong. 2002. The first sauropod trackways from China. Cretaceous Research 23: 363–381.
Manning, P. L. 2004. A new approach to the analysis and interpretation of tracks: examples from the Dinosauria; pp. 93–123 in D. McIllroy (ed.), The Application of Ichnology to Palaeoenvironmental and Stratigraphic Analysis. Special Publications 228. Geological Society London, London, UK.
Mantell, G. A. 1825. Notice on the Iguanodon, a newly discovered fossil reptile, from the sandstone of Tilgate Forest, in Sussex. Philosophical Transactions of the Royal Society of London 115: 179–186.
Matsukawa, M., M. G. Lockley, and A. P. Hunt. 1999. Three age groups of ornithopods inferred from footprints in the mid-Cretaceous Dakota Group, eastern Colorado, North America. Palaeogeography, Palaeoclimatology, Palaeoecology 147: 39–51.
Matsukawa, M., T. Hamuro, T. Mizukami, and S. Fujii. 1997. First trackway evidence of gregarious dinosaurs from the Lower Cretaceous Tetori Group of eastern Toyama prefecture, central Japan. Cretaceous Research 18: 603–619.
Marty, D., A. Strasser, and C. A. Meyer. 2009. Formation and taphonomy of human footprints in microbial mats of present-day tidal-flat environments: implications for the study of fossil footprints. Ichnos 16: 127–142.
Meyer, C. A., and B. Thüring. 2003. The first iguanodontid dinosaur tracks from the Swiss Alps (Schrattenkalk Formation, Aptian). Ichnos 10: 221–228.
Moratalla, J. J., and J. Marugán-Lobón. 2009. Assessing dinosaur ichno-variability with geometric morphometrics: the ornithopod tracks from the Cameros Basin (Lower Cretaceous, Spain) as a case study. Journal of Vertebrate Paleontology 29 (3, Supplement): 151A.
Myers, T. S., and A. R. Fiorillo. 2009. Evidence for gregarious behavior and age segregation in sauropod dinosaurs. Palaeogeography, Palaeoclimatology, Palaeoecology 274: 96–104.
Norman, D. B. 2011. Ornithopod dinosaurs; pp. 407–475 in D. J. Batten (ed.), English Wealden Fossils. Palaeontological Association Field Guide to Fossils 14. The Palaeontological Association, London, UK.
Ostrom, J. H. 1972. Were some dinosaurs gregarious? Palaeogeography, Palaeoclimatology, Palaeoecology 11: 287–301.
Parkes, A. S. 1993. Dinosaur footprints in the Wealden at Fairlight, East Sussex. Proceedings of the Geologists’ Association 104: 15–21.
Pascual-Arribas, C., N. Hernández-Medrano, P. Latorre-Macarrón, and E. Sanz-Pérez. 2009. El icnogénero Iguanodontipus en el yacimento de ‘Las Cuestas I’ (Santa Cruz de Yanguas, Soria, España). Studia Geologica Salamanticensia 45(2): 105–128.
Pelzer, G. 1998. Sedimentologie und Palynologie der Wealden-Fazies im Hannoverschen Bergland. Courier Forschungsinstitut Senckenberg 207: 1–211.
Pittman, J. G., and D. D. Gillette. 1989. The Briar Site: a new sauropod dinosaur tracksite in Lower Cretaceous beds of Arkansas, USA; pp. 313–332 in D. D. Gillette and M. G. Lockley (eds.), Dinosaur Tracks and Traces. Cambridge University Press, Cambridge, UK.
Pollard, J. E., and J. D. Radley. 2011. Trace fossils; pp. 652–676 in D. J. Batten (ed.), English Wealden Fossils. Palaeontological Association Field Guide to Fossils 14. The Palaeontological Association, London, UK.
Radley, J. D., M. J. Barker, and I. C. Harding. 1998. Palaeoenvironment and taphonomy of dinosaur tracks in the Vectis Formation (Lower Cretaceous) of the Wessex Sub-basin, southern England. Cretaceous Research 19: 471–487.
Rasband, W. S. 1997–2012. ImageJ. National Institutes of Health, Bethesda, Maryland. Available at http://imagej.nih.gov/ij/. Accessed November 6, 2015.
Rasskin-Gutmann, D., G. Hunt, R. E. Chapman, J. L. Sanz, and J. J. Moratalla. 1997. The shapes of tridactyl dinosaur footprints: procedures, problems, and potentials. Dinofest International Proceedings 1997: 377–383.
Richter, A., and A. Böhme. 2016. Too many tracks – preliminary description and interpretation of the diverse and heavily dinoturbated Early Cretaceous ‘Chicken Yard’ ichnoassemblage (Obernkirchen tracksite, northern Germany; chap. 17 in P. L. Falkingham, D. Marty, and A. Richter (eds.), Dinosaur Tracks: The Next Steps. Indiana University Press, Bloomington, Indiana.
Richter, A., A. Böhme, and T. van der Lubbe. 2009. ‘Chicken Run’: a new unusual, heavily dinoturbated tracksite from the Lower Cretaceous sandstones of Obernkirchen, northern Germany. Journal of Vertebrate Paleontology 29(3): 171A.
Richter, A., J. J. Hornung, A. Böhme, and U. Stratmann. 2012. Excursion Guide A1: Obernkirchen sandstone quarries: a natural workstone lagerstaette and a dinosaur tracksite; pp. 73–99 in A. Richter, T. and M. Reich (eds.), Dinosaur Tracks 2011. An International Symposium, Obernkirchen, April 14–17, 2011. Abstract Volume and Field Guide to Excursions. Universitäts-Verlag, Göttingen, Germany.
Rodrigues, L. A., and V. F. dos Santos. 2004. Sauropod tracks: a geometric morphometric study; pp. 129–142 in A. M. T. Elewa (ed.), Morphometrics. Applications in Biology and Paleontology. Springer Verlag, Berlin, Germany.
Rohlf, F. J., and D. Slice. 1990. Extensions of the Procrustes method for the optimal superimposition of landmarks. Systematic Zoology 39: 40–59.
Santos, V. F. dos, P. M. Callapaz, and N. P. C. Rodrigues. 2012. Dinosaur footprints from the Lower Cretaceous of the Algarve Basin (Portugal): new data on the ornithopod palaeoecology and palaeobiogeography of the Iberian Peninsula. Cretaceous Research 40: 158–169.
Sarjeant, W. A. S., J. B. Delair, and M. G. Lockley. 1998. The footprints of Iguanodon: a history and taxonomic study. Ichnos 6: 183–202.
Stechow, E. 1909. Neue Funde von Iguanodon-Fährten. Centralblatt für Mineralogie, Geologie und Paläontologie [1909]: 700–705.
Struckmann, C. 1880. Vorläufige Nachricht über das Vorkommen großer, vogelähnlicher Thierfährten (Ornithoidichnites) im Hastingssandsteine von Bad Rehburg bei Hannover. Neues Jahrbuch für Mineralogie, Geologie und Paläontologie [1880](1): 125–128.
Thévenaz, P. 2012. Point Picker. École Polytechnique Fédérale de Lausanne, Lausanne, Switzerland. Available at http://bigwww.epfl.ch/thevenaz/pointpicker/. Accessed November 6, 2015.
Thulborn, R. A., and M. Wade. 1979. Dinosaur stampede in the Cretaceous of Queensland. Lethaia 12: 275–279.
Thulborn R. A., and M. Wade. 1989. A footprint as a history of movement; pp. 51–56 in D. D. Gillette and M. G. Lockley (eds.), Dinosaur Tracks and Traces. Cambridge University Press, Cambridge, U.K.
Wings, O., J. N. Lallensack, and H. Mallison. 2016. The Early Cretaceous dinosaur trackways in Münchehagen (Lower Saxony, Germany): 3D photogrammetry as basis for geometric morphometric analysis of shape variation and evaluation of material loss during excavation; chap. 3 in P. L. Falkingham, D. Marty, and A. Richter (eds.), Dinosaur Tracks: The Next Steps. Indiana University Press, Bloomington, Indiana.
Wings, O., D. Falk, N. Knötschke, and A. Richter. 2012. Excursion Guide B1: the Early Cretaceous dinosaur trackways in Münchehagen (Lower Saxony, Germany): the Natural Monument ‘Saurierfährten Münchehagen’ and the adjacent Wesling Quarry; pp. 113–142 in A. Richter and M. Reich (eds.), Dinosaur Tracks 2011. An International Symposium, Obernkirchen, April 14–17, 2011. Abstract Volume and Field Guide to Excursions. Universitäts-Verlag, Göttingen, Germany.
Woodhams, K. E., and J. S. Hines. 1989. Dinosaur footprints from the Lower Cretaceous of East Sussex, England; pp. 301–307 in D. D. Gillette and M. G. Lockley (eds.), Dinosaur Tracks and Traces. Cambridge University Press, Cambridge, UK.
Zelditch, M. L., D. L. Swiderski, and H. D. Sheets. 2012. Geometric Morphometrics for Biologists: A primer. 2nd edition. Elsevier, Amsterdam, the Netherlands, 437 pp.