The inventory value report setup gives the option to have versions of the report based on the purpose of the report focus. The report can concentrate on the reconciliation between the inventory and inventory account, the work in progress (WIP) account, the deferred cost of goods sold (deferred COGS) account, and the cost of goods sold (COGS) account, in addition to the report design for columns and rows.
As shown in the following screenshot, to access the inventory value report setup, go to Cost management | Inventory accounting policies setup | Inventory value reports. To create an inventory report, click on New or press Ctrl + N and enter the report ID and report description. On the General tab, you can predefine the date interval for the report, as this is considered as a proposed value when generating the report in the second stage, and the user can select other date intervals, as per their needs:

To set up date intervals, go to General ledger | Setup | Periods | Date intervals.
Now, identify the report date under the Range combobox, whether it is based on Posting date or Transaction time. Now identify the Dimension set that will be used in the report.
To set up a dimension set, navigate to General ledger | Setup | Financial dimensions | Financial dimensions sets.
When designing report columns in the Columns tab, the first part is the Financial position that represents the inventory submodel values for Inventory, WIP, Deferred COGS, COGS, and/or Profit and loss, which will be shown in the report.
The second part is COMPARE ON-HAND INVENTORY VALUE TO CUMULATIVE ACCOUNTING VALUES, which represents the ledger account for Inventory, WIP, Deferred COGS, and/or COGS.
The third part is Inventory dimension, which is the inventory breakdown by inventory dimensions and storage dimensions.
The other parts represent the summarization of the report, including transactions not posted to ledger, calculate average cost price, and/or total quantity and value. The following screenshot shows the Columns tab:

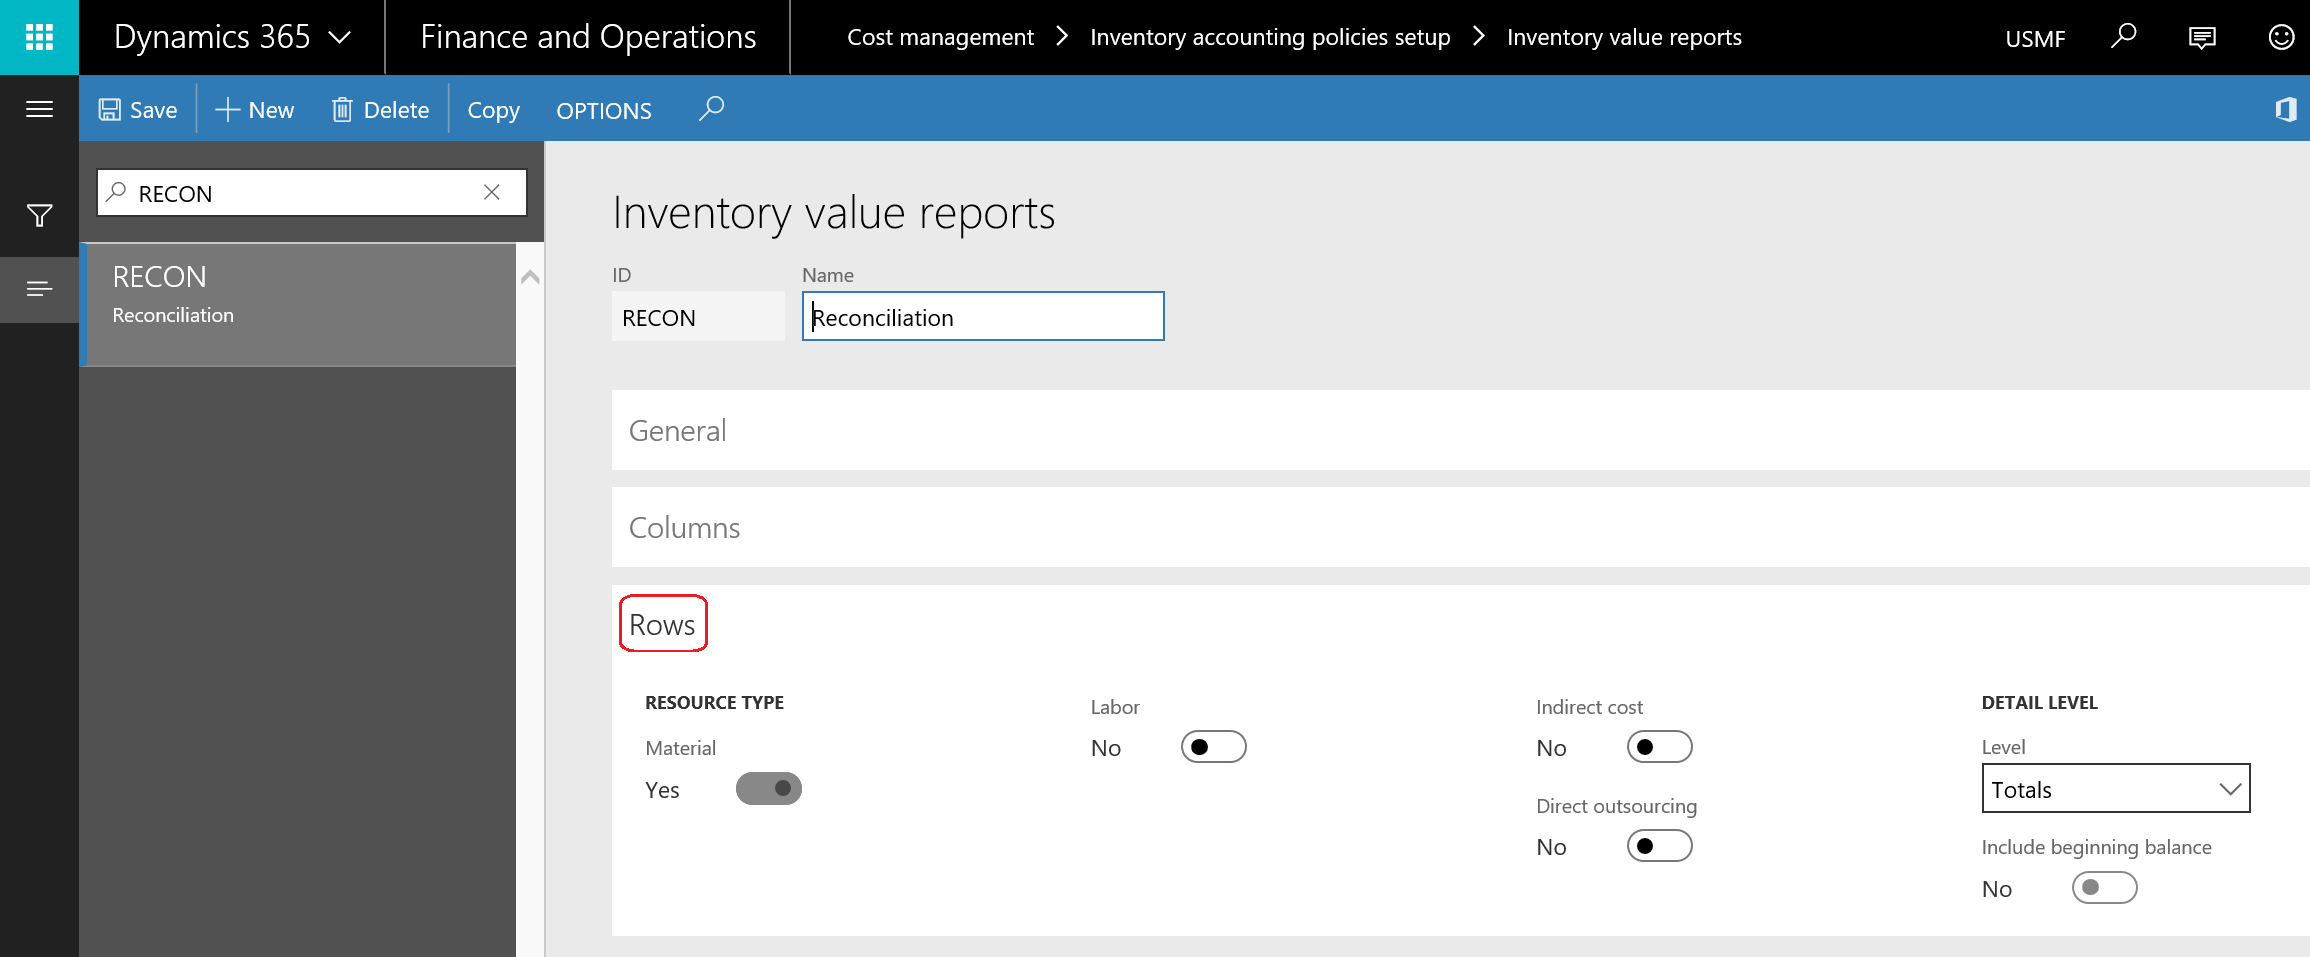
The Rows tab, where report rows can be designed, represents the cost elements that are required to be shown in the report row, and also shows whether the level is Totals or Transaction, as shown in the following screenshot:
