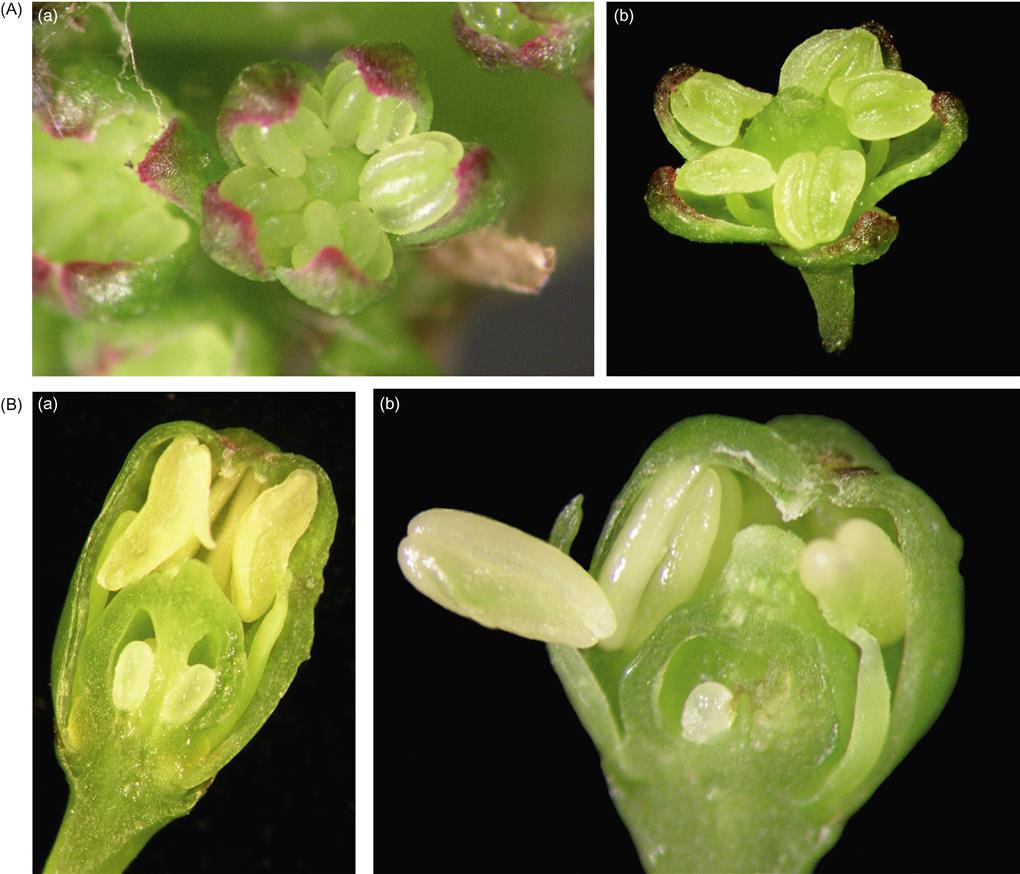
Plate 2.1A) Typical Chardonnay star flowers: early in development when the ovary is small (a) and later in development when the ovary has enlarged (b). Note the red/pink pigmentation at the tips of the petals. The bar represents 1 mm. B) Chardonnay flowers: (a) normal; (b) star flower, dissected longitudinally just prior to opening. Note the differences in shape of the flower buds, the relatively small size of the ovules and the pale-colored anthers of the star flower. The anther in the foreground of (b) has been positioned deliberately to more clearly expose the inner organs of the flower.The bar represents 1 mm. (From Longbottom et al. 2008 (Figs 3 and 4, pg 206), reproduced by permission).
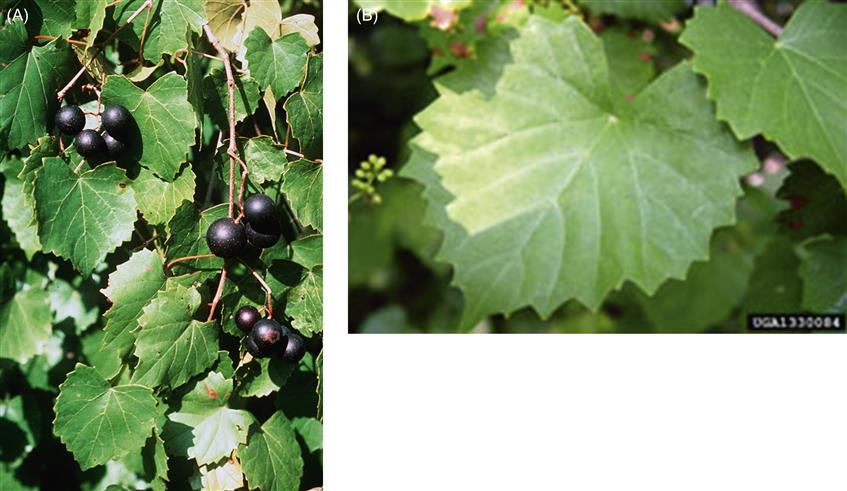
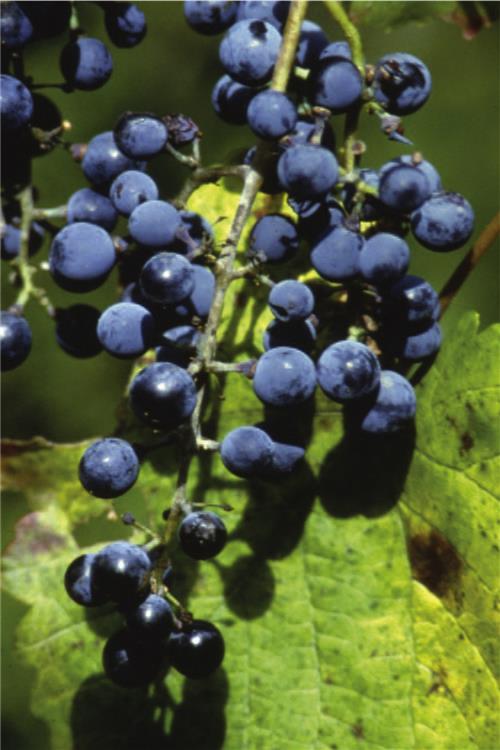
Plate 2.3Cluster of grapes of Vitis vinifera f. silvestris in southern Spain. (Photo courtesy of D. Nuñez, Universidat de Murica).
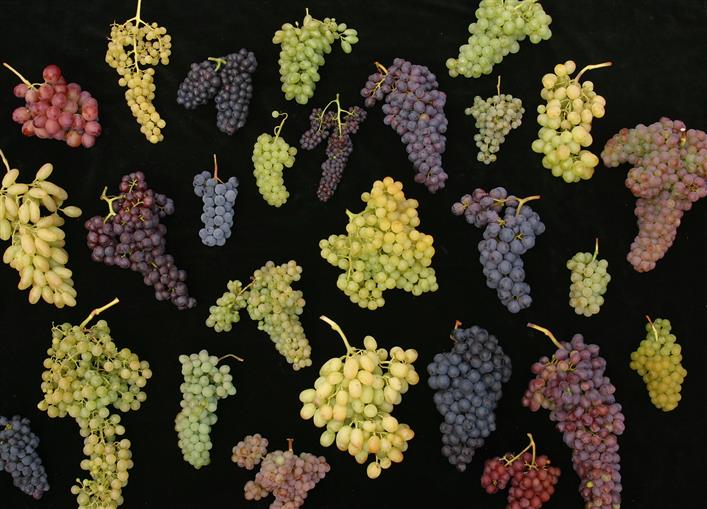
Plate 2.4Grapevine heterogeneity as illustrated by the diversity in morphology, structure and coloration in grapes and grape clusters. (Photo courtesy of Kühn-Institute, Institute for Grapevine Breeding Geilweilerhof, Siebeldingen, Germany).
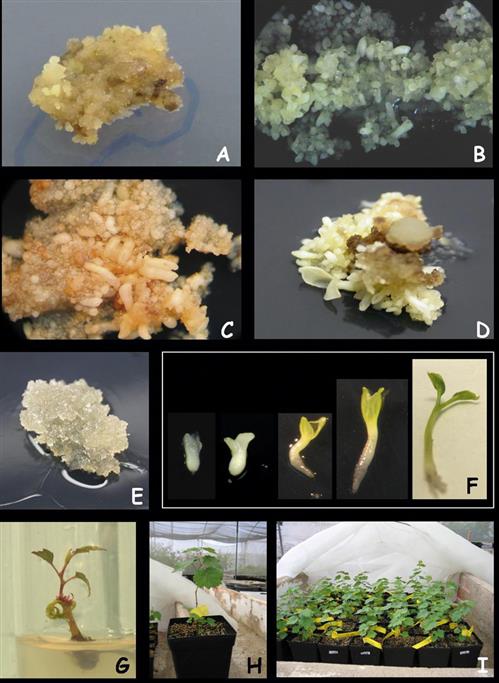
Plate 2.5Embryogenesis and plant regeneration. (A, B) Effect of activated charcoal on embryogenesis: callus cultured on ½MS (A) and on ½MSAC (B). (C, D) Calli cultured on ½MSAC, at different stages of development of somatic embryos. (E) Very soft non-embryogenic calli (Type II). (F) Different stages of germination of the somatic embryos on a medium containing IAA, GA, and AC. (G) Plant developed on half strength MA in test tubes. (H, I) Acclimatization and culture under greenhouse conditions. (From López-Pérez et al., 2005, reproduced by permission).
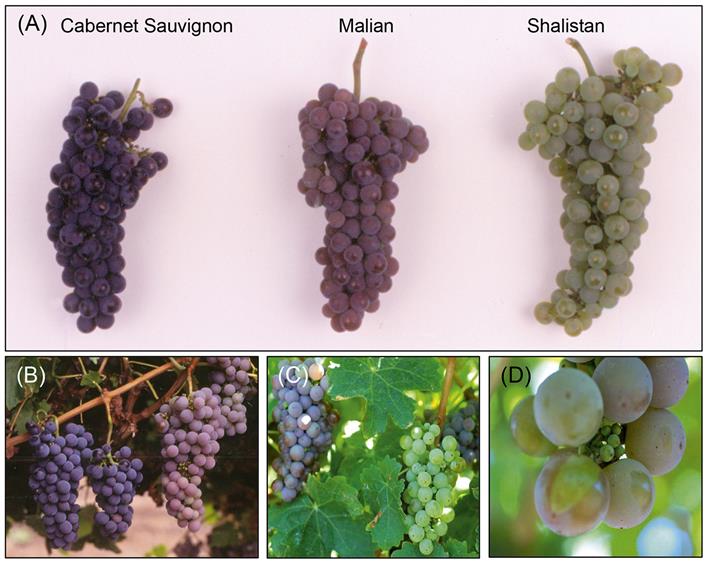
Plate 2.6Photographs of the colored sports of ‘Cabernet Sauvignon.’ (A) Grape clusters of the clones Malian and Shalistin; (B) The original mutated cane, bearing bronze berries on the parental vine; (C) Malian vine with white bunch; (D) White sector on a Malian berry. (From Walker et al., 2006, reproduced by permission).
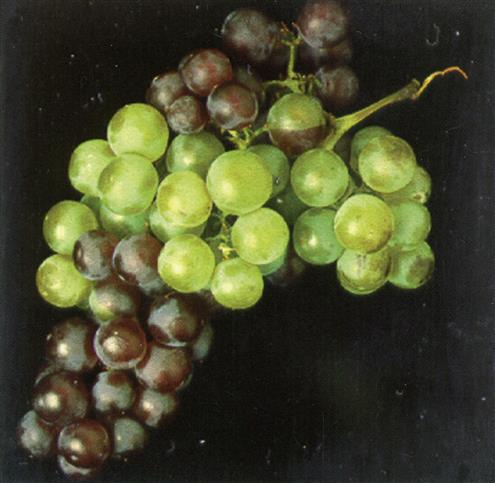
Plate 2.7Grapes showing partial to complete chimeras in their outer pigmented tissues. (Photo courtesy of A. Reynonds, Brock University).
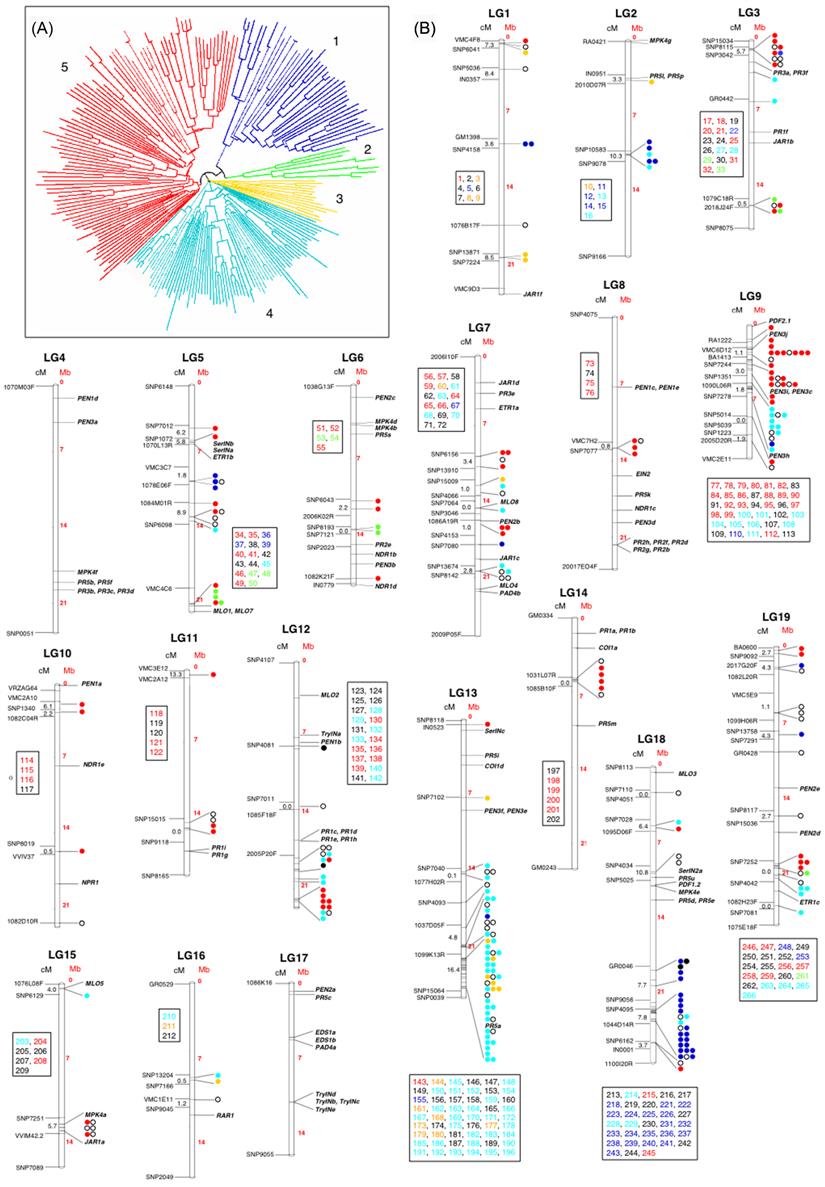
Plate 2.8Chromosomal organization of disease resistance genes of V. vinifera. (A) Phylogenetic analysis of NBS-LRR protein sequences of V. vinifera present in Pinot Noir. The phylogeny of these genes is based on a distance-matrix neighbor-joining analysis (Clustal X; bootstrap of 1000) after alignment of sequences by TCoffee (version 5.05). The phylogenetic clades, in general, correspond to the classification based on protein domains. (B) Genes assigned to LGs are represented by dots. Their gene number is specified in LG-specific insets. NBS clades (see A above) contain mainly genes of the following classes: (1) TIR-NBS-LRR in blue; (2) CC-NBS-LRRa in green; (3) CC-NBSLRRb in yellow; (4) NBS-LRR in cyan; (5) CC-NBS-LRR in red. Other resistance genes, belonging to NBS and TIR-NBS groups, are represented by the open and filled dots, respectively. Resistance-related genes different from NBS genes are shown in black. The size of each LG is given in Mb (on the right) (http://genomics.research.iasm). (From Velasco et al., 2007.)
Plate 3.1Longitudinal section of a grape bud showing the three growing points or buds. (Photo courtesy of the late R. Pool, New York State Agricultural Experimental Station, Cornell University, Geneva, NY).
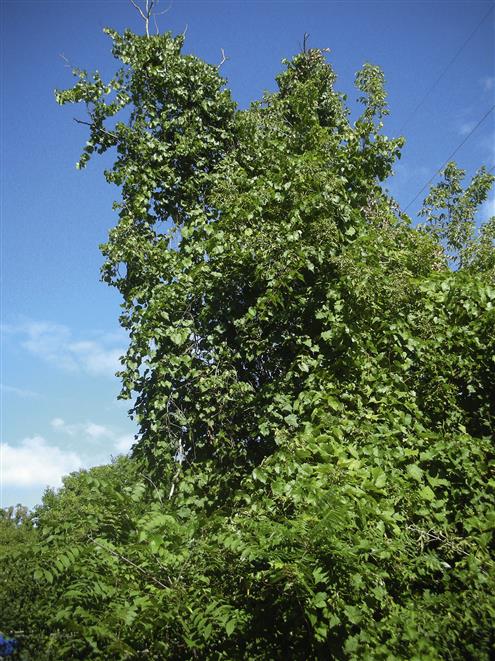
Plate 3.2Rampant growth of Vitis riparia on a tree, resulting in its death. (Photo courtesy R. S. Jackson).
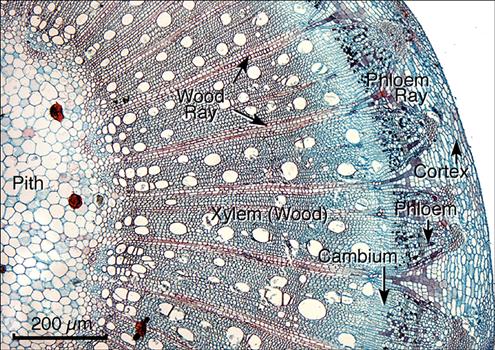
Plate 3.3Cross-section of a young shoot: basal internode that is no longer elongating but is growing thicker. (Photo courtesy M. Goffinet, Department of Horticultural Sciences, New York State Agricultural Experimental Station, Cornell University, Geneva, NY).
Plate 3.4Internal anatomy of a cane: taken from a brown internode. (Photo courtesy M. Goffinet, Department of Horticultural Sciences, New York State Agricultural Experimental Station, Cornell University, Geneva, NY).
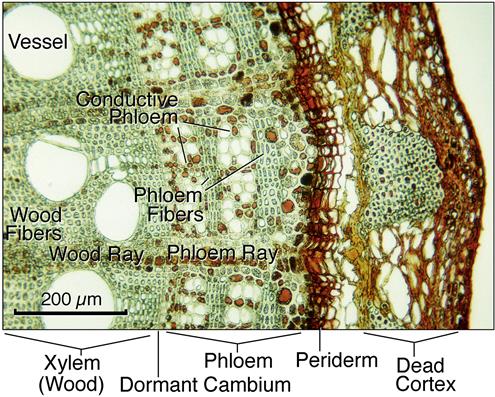
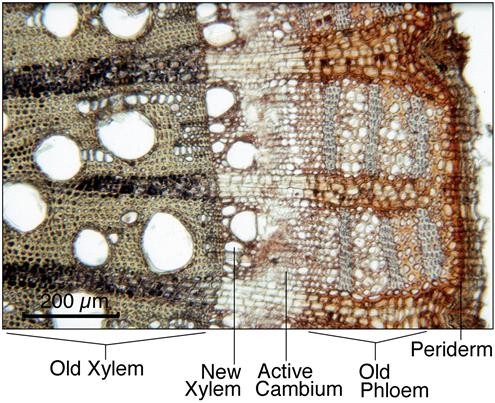
Plate 3.5Anatomy of perennial woody stem in spring. (Photo courtesy M. Goffinet, Department of Horticultural Sciences, New York State Agricultural Experimental Station, Cornell University, Geneva, NY).
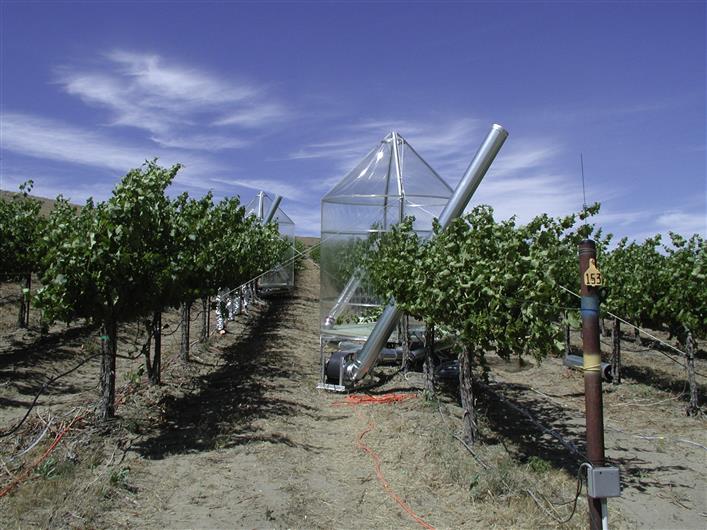
Plate 3.6Portable whole canopy gas exchange system for several mature field-grown grapevines. (From Peña and Tarara, 2004, reproduced by permission).
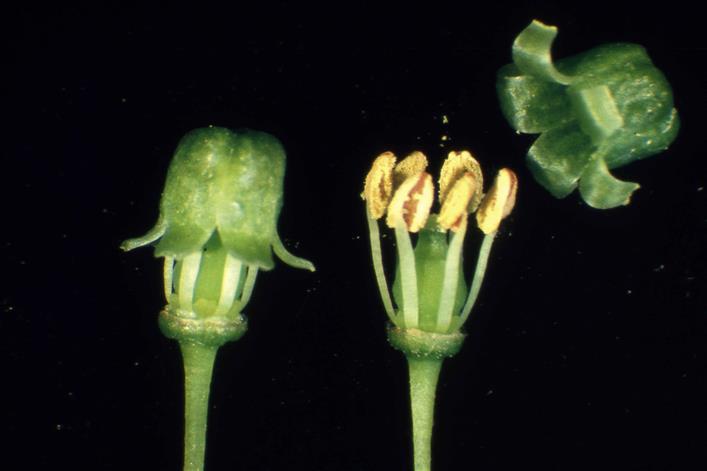
Plate 3.7Grape flower showing calyptra separated and being shed from the blossom. (Photo courtesy of D.D. Lorenz, Staatliche Lehr-und Forschungsanstalt für Landwirtshaft, Weinbau und Gartenbau, Neustadt).
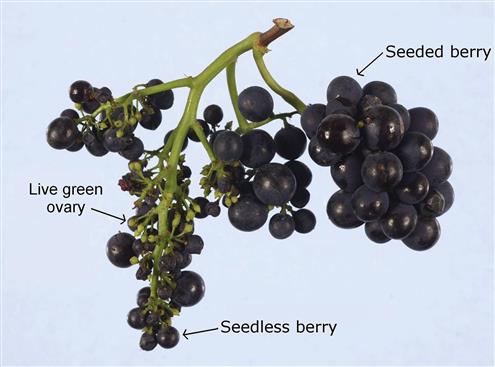
Plate 3.8Examples of the different berry types used when assessing bunch yield components: ‘seeded’ berries of ‘normal’ size, which contain seeds and ripen; smaller ‘seedless’ berries, which do not contain normal seeds but will ripen; live green ovaries, which show limited development. (From Friend and Trought, 2007, reproduced by permission).
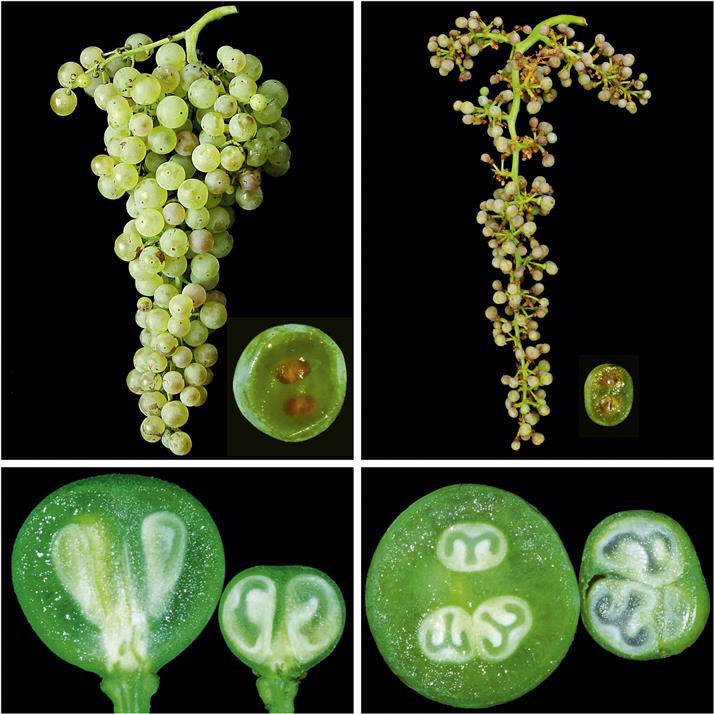
Plate 3.9Clusters of ‘Ungi blanc’ showing the effect of the flb mutant on fruit size (top) and internal structure before ripening (bottom). (Photo courtesy L. Torregrosa, UMR BEPC Campus Agro-M/INRA, Montpellier).
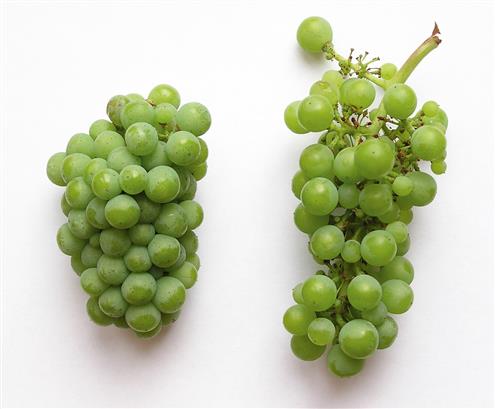
Plate 3.10Effect of gibberellin (GA3) application to grapevine flowers on the spacing of ‘Riesling’: untreated (left); treated (right). (Photo courtesy of M. Pour Nikfardjam, Staatl. Lehr- und Versuchsanstalt fuer Wein- und Obstbau, Weinsberg).
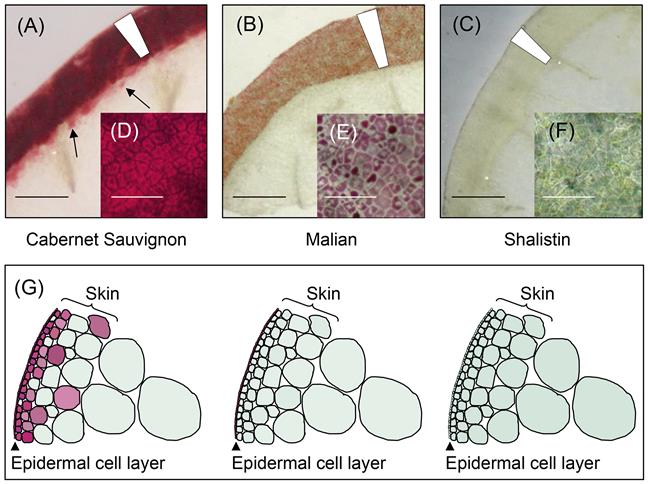
Plate 3.11Examination of berry cell layers. (A, B, C) Oblique angle hand sections cut on an arc through berry to show epidermis (marked with a trapezoid) and internal cells, constituting the skin and flesh. (A) ‘Cabernet Sauvignon’ (arrows indicate large subepidermal colored cells); (B) Malian; (C) Shalistin; (D, E, F) Thin surface section looking through skin (photo taken with Axioplan microscope); (D) ‘Cabernet Sauvignon;’ (E) Malian; (F) Shalistin. (G) Diagrammatic representation of cross-sections of ‘Cabernet Sauvignon,’ Malian and Shalistin berries. Bar in A–C is 1 mm; D–F is 100 μm. (Reproduced from Walker et al., 2006, with kind permission from Springer Science and Business Media).
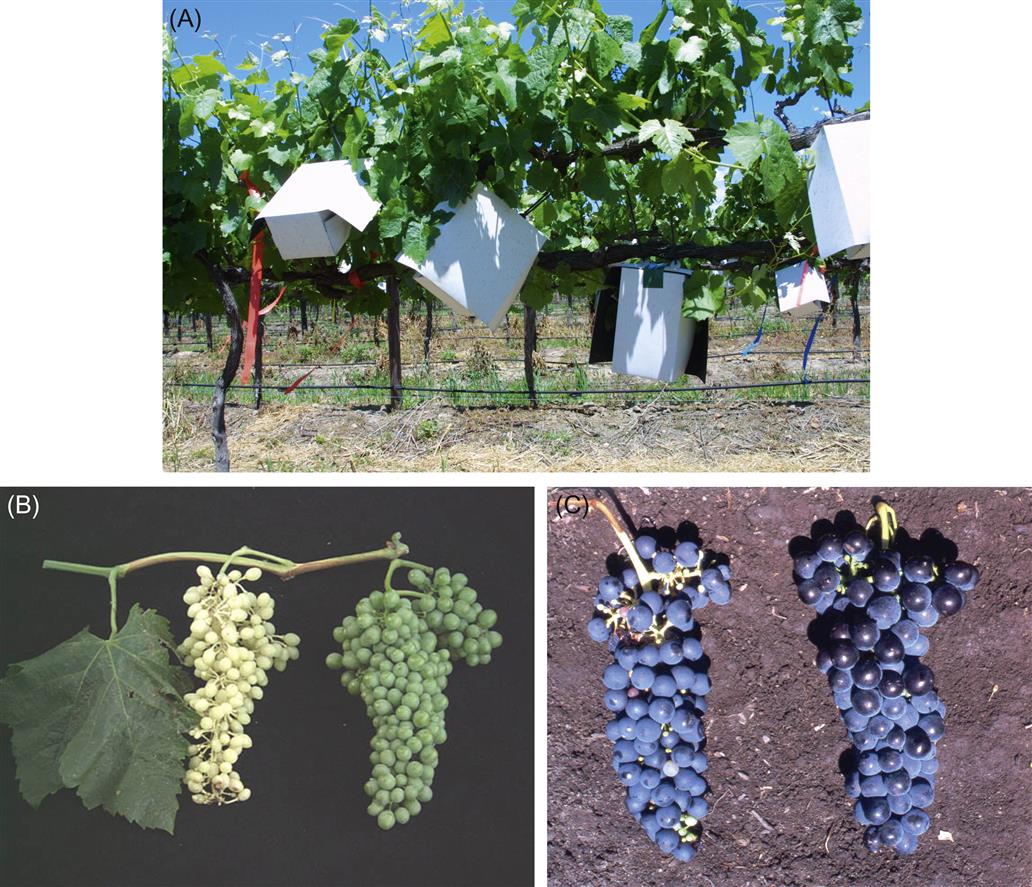
Plate 3.12(A) Light-proof boxes in the field at the time of application at flowering; (B) ‘Shiraz’ berries 2 weeks pre-véraison showing differences in chlorophyll accumulation between treatments; (C) ‘Shiraz’ berries 6 weeks post-véraison, showing no obvious difference in coloration between treatments. The shaded bunch is on the left in both images. (From Downey et al., 2004, reproduced with permission).
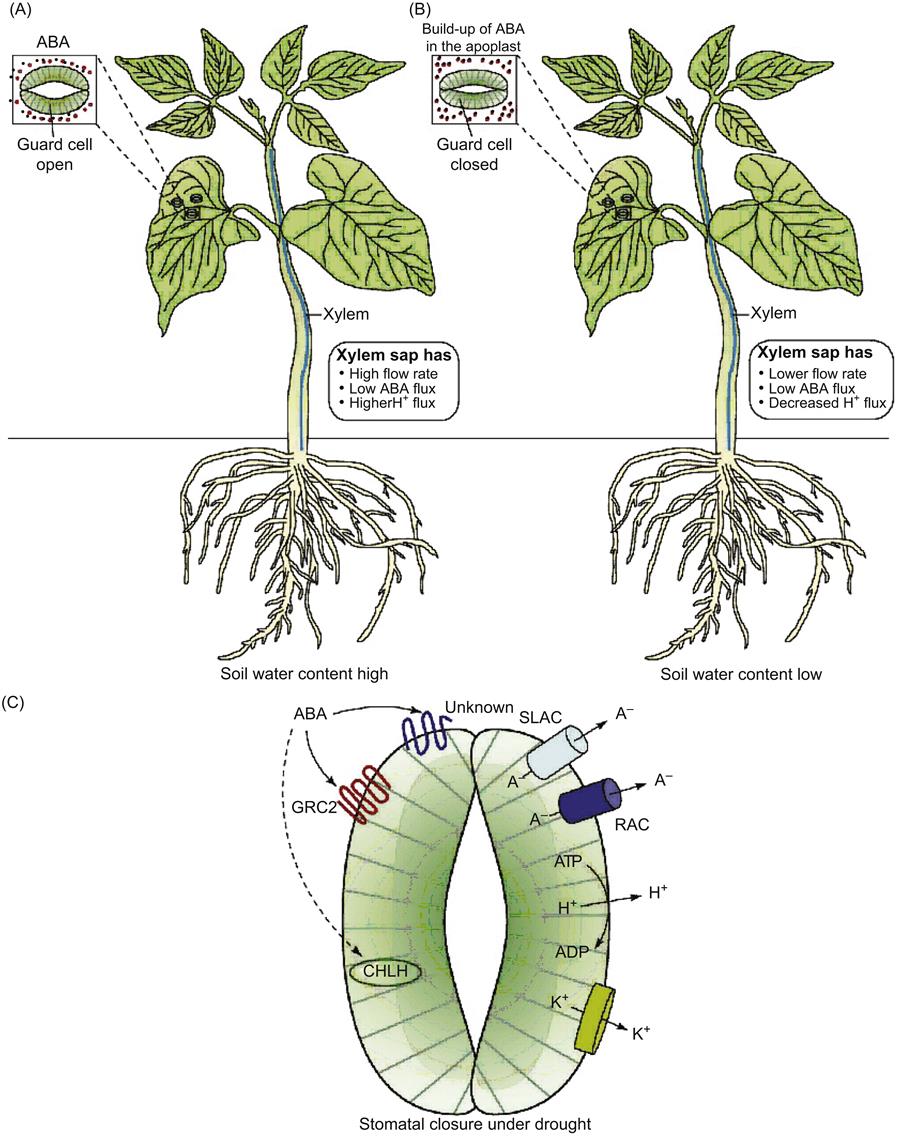
Plate 3.13Changes in xylem sap composition under drought. Drought causes the alkalinization of xylem sap pH in certain plant species. (A) Well-watered plant with apoplastic pH 6.0. (B) Plant under drought conditions with apoplastic pH 7.0. In plants in which xylem sap pH increases when the soil becomes dry, abscissic acid (ABA)-induced stomatal closure is enhanced. This is thought to be due to increased apoplastic concentrations of ABA. Further changes in xylem sap composition under drought are also responsible for reduced transpiration and inhibition of leaf growth. These changes include increases in malate and ACC (1-aminocyclopropane-1-carboxylate) concentrations, decreases in flow rates, and reductions in the concentrations of cytokinins, zeatin and zeatin riboside. After guard cells perceive ABA, changes in potassium (K+) and anion (A−) fluxes result in stomatal closure. (C) Stomatal closure under drought. The effects of ABA on guard cells under drought suggest the importance of a plasma-membrane-bound receptor, such as the recently identified GCR2 (G-protein coupled receptor 2), but the importance of intracellular receptors, such as CHLH (the H subunit of the magnesium protoporphyrin-IX chelatase that is localized in the chloroplast), cannot be ruled out. Other unknown and yet-to-be-identified plasma membrane receptors could also be important in transducing the increased ABA concentrations in the apoplast that cause stomatal closure. After guard cells perceive ABA, the efflux of potassium (K+) and anions (A−) leads to stomatal closure. SLAC, slow anion channel; RAC, rapid anion channel. (Reprinted from Schachtman and Goodger, 2008, with permission from Elsevier.)
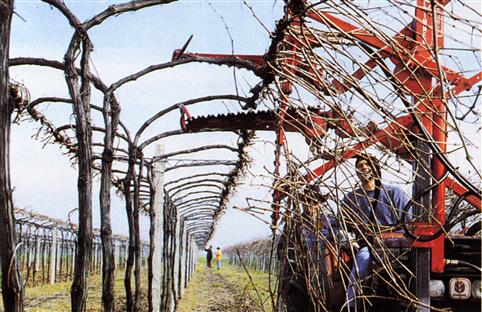
Plate 4.1Mechanical pruning of vines trained to the Geneva Double Curtain training system using the ‘Trimmer’. Photo courtesy of. C. Intrieri, Università di Bologna.
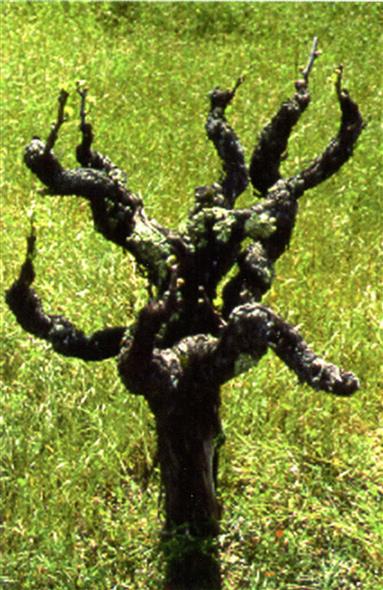
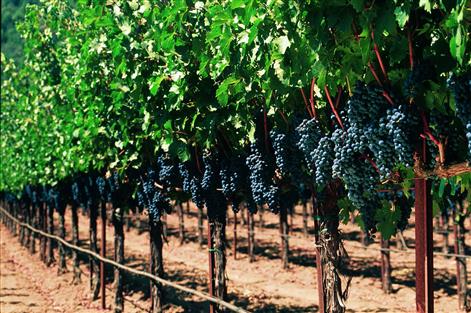
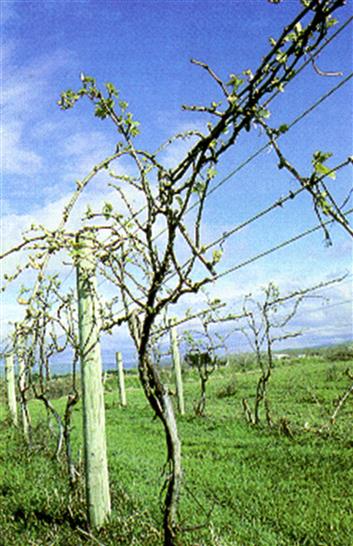
Plate 4.2Head-trained 100-year-old ‘Zinfandel’ vine shortly after bud break. Photo courtesy of A. Reynolds, Brock University.
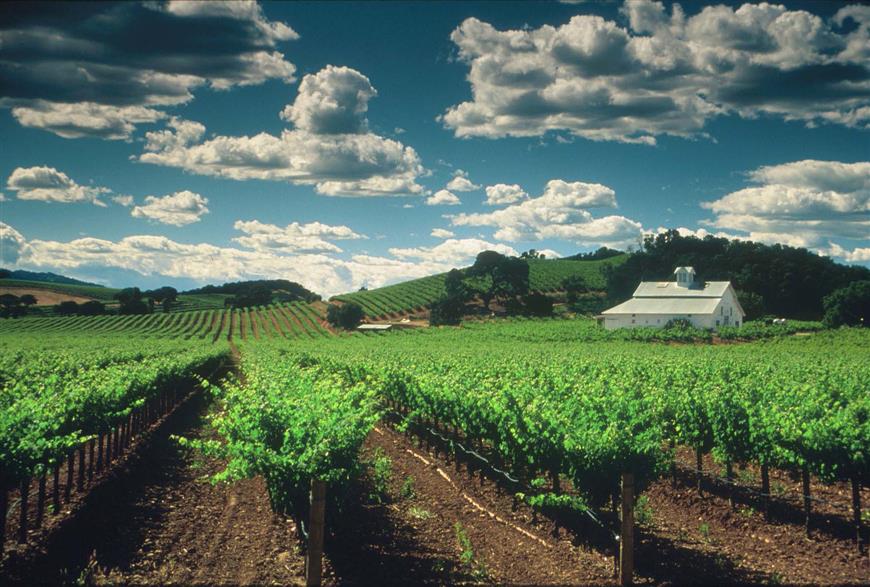
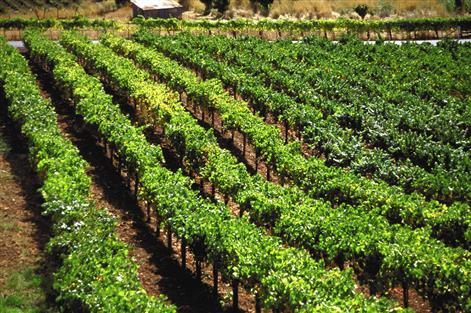
Plate 4.3Wide-row planting, Napa Valley. Photo courtesy of Napa Valley Vintners.
Plate 4.4Narrow-row planting. Photo courtesy California Wine Institute.
Plate 4.5VSP (Vertical Shoot Positioning) training system application in Napa Valley. Photo courtesy of Napa Valley Vintners.
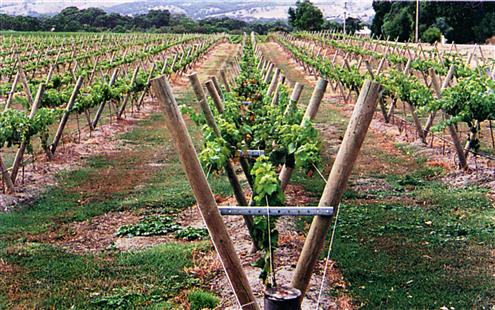
Plate 4.6Lyre training system. Photo courtesy of Australian Grapegrower and Winemaker.
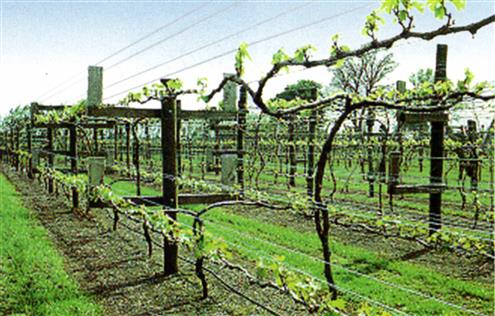
Plate 4.7Vines trained to a RT2T trellis shortly after bud break. Photo courtesy of R. Smart, Smart Viticultural Services.
Plate 4.8Minimally pruned vines shortly after bud break. Photo courtesy of R. Smart, Smart Viticultural Services.
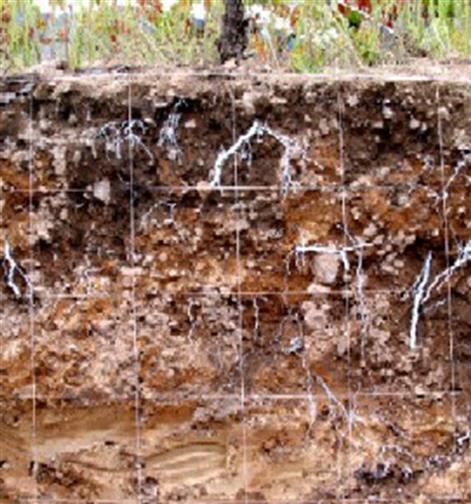
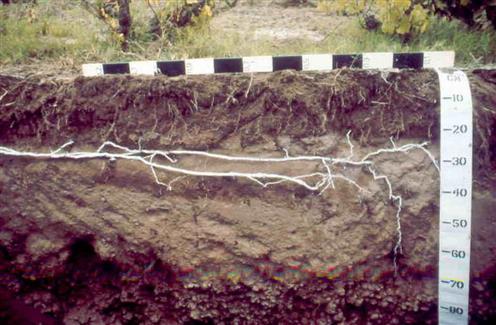
Plate 4.9Root distribution as a result of poor physical soil preparation. Photo courtesy of Dr E. Archer, University of Stellenbosch, South Africa.
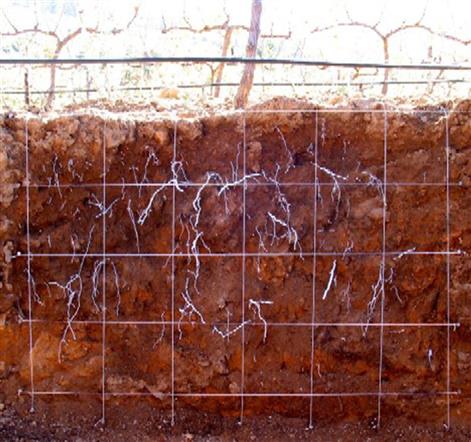
Plate 4.10Root distribution in high soil potential with poor chemical amelioration during soil preparation (acidic subsoil with low phosphates). Photo courtesy of Dr E. Archer, University of Stellenbosch, South Africa.
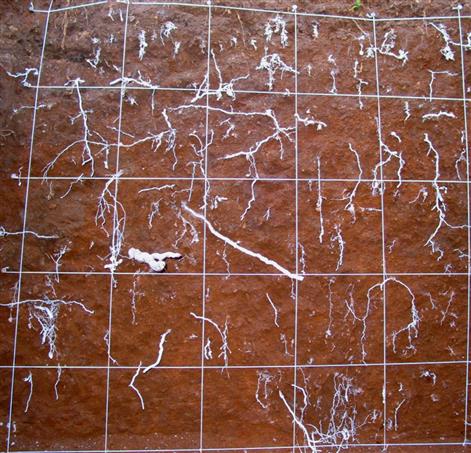
Plate 4.11Well-buffered root system as a result of good physical and chemical soil preparation. Photo courtesy of Dr E. Archer, University of Stellenbosch, South Africa.
Plate 4.12Root depth restriction due to hard pan development through annual mechanical cultivation. Photo courtesy of Dr E. Archer, University of Stellenbosch, South Africa.
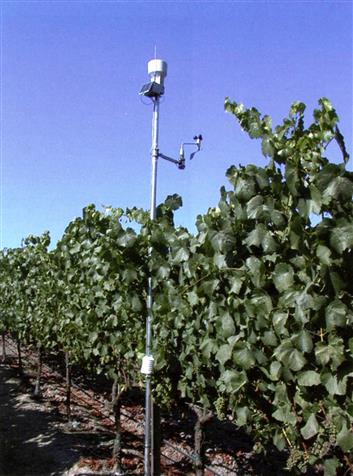
Plate 4.13Remote weather station used in providing meteorological data for disease forecasting. Photo courtesy of Adcom Telemetry, Inc.
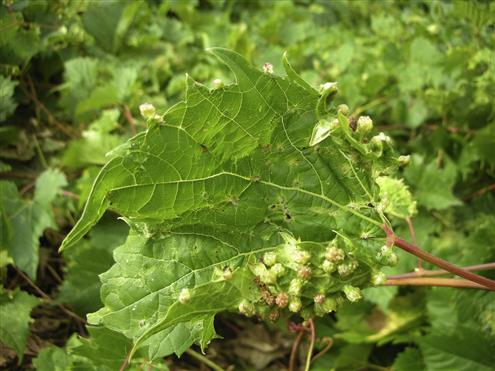
Plate 4.14Phylloxera leaf galls on Vitis riparia. Photo courtesy R. S. Jackson.
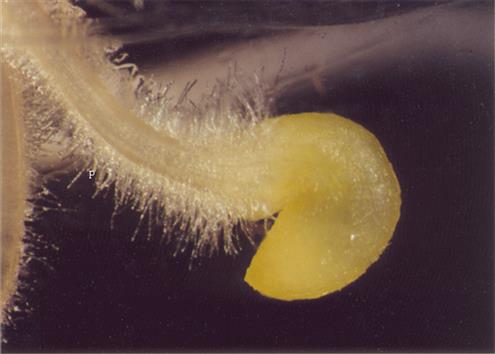
Plate 4.15In vitro-generated phylloxera nodosity on ‘Cabernet Sauvignon’ (3 days old). From Forneck et al., 2002, reproduced by permission.
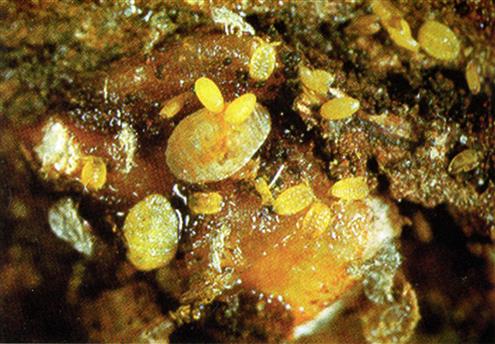
Plate 4.16Close-up of colony of phylloxera adult female, eggs, and nymphs. Photo by Jack Kelly Clark, from Flaherty et al., 1982, reproduced by permission.
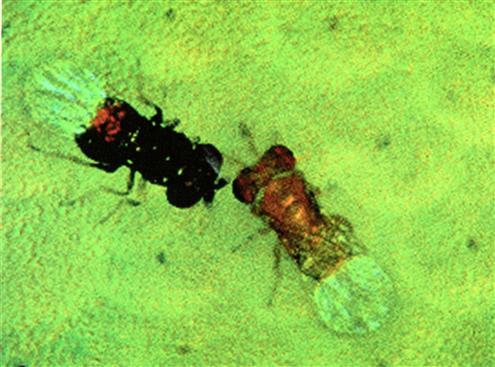
Plate 4.17Trichogramma on Lightbrown apple moth eggs. Photo courtesy of Institute for Horticultural Development, Knoxfield, Australia.
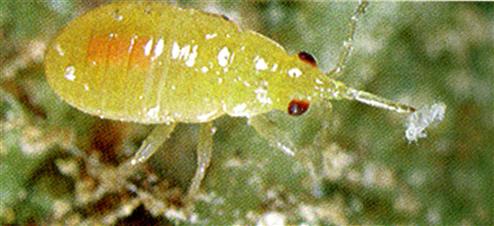
Plate 4.18Orius (minute pirate bug) nymph feeds on mite. Photo by Jack Kelly Clark, from Flaherty et al., 1982, reproduced by permission.
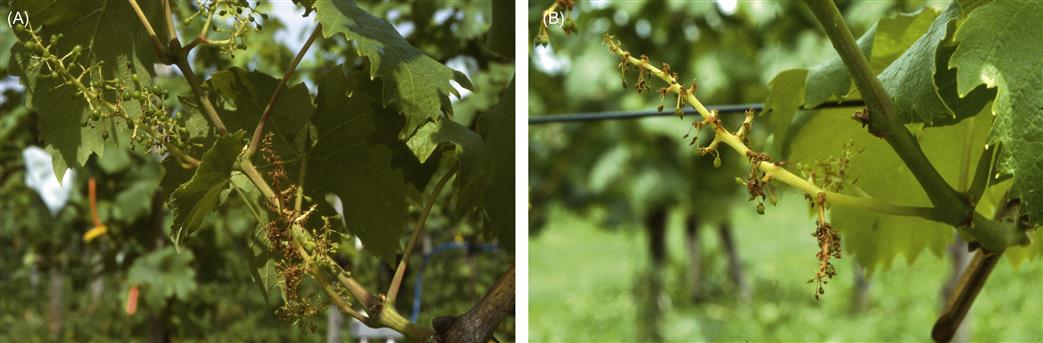
Plate 4.19Inflorescence necrosis in N-deficient ‘Müller-Thurgau’ grapevines: (A), although fruit-set is low in all bunches, the proximal (basal) bunch is most severely affected; (B), close-up of a proximal inflorescence. From Keller et al., 2001, reproduced with permission.
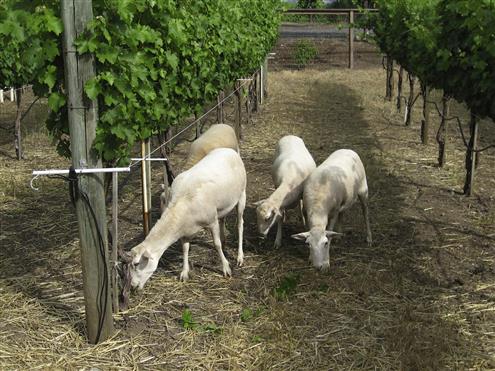
Plate 4.20Sheep used as an organic weed control agent in Alexander Valley, Sonoma County, CA. Photo courtesy of Kelly Mulville, Grazing Vineyards.
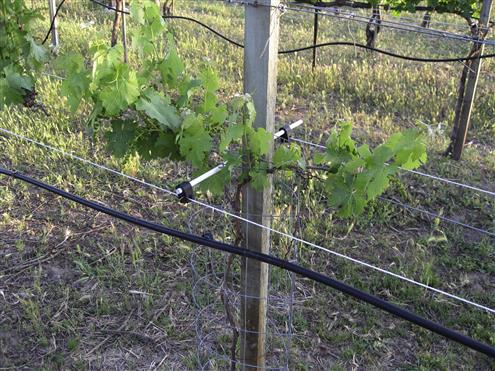
Plate 4.21Electrified wires used to discourage sheep, employed in weed control, from grazing on grapes, leaves, or shoots above a particular height. Photo courtesy of Kelly Mulville, Grazing Vineyards.
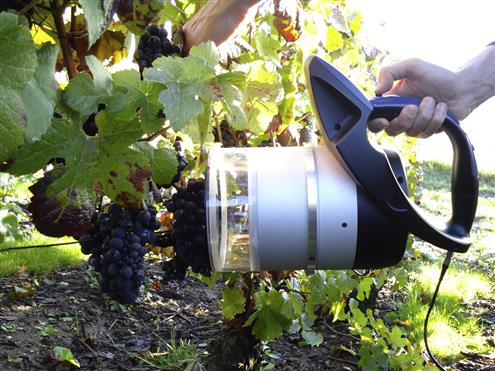
Plate 4.22A hand-held spectrophotometer designed for phenolic maturity monitoring, detection of nitrogen deficiency, and early pathogen detection. The Multiplex® 3 illustrated measures flavonol, anthocyanin and chlorophyll content from leaves and fruit epidermis. Another version can also assess stilbene content. Its internal GPS permits geolocalization of blocks. Photo courtesy of Force-A.
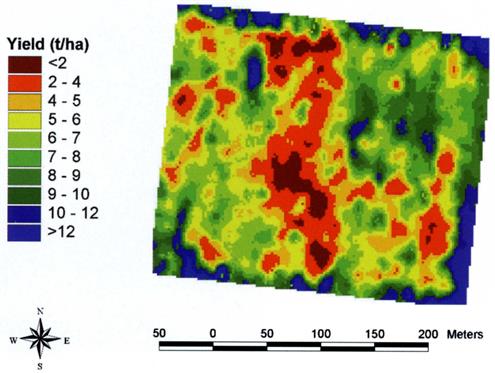
Plate 4.23Variation in grape yield (1999) in a Coonawarra vineyard planted with ‘Cabernet Sauvignon’ in 1986. It clearly indicates the marked influence that microclimatic soil and atmospheric conditions can have on vine yield. From Bramley and Proffitt, 1999, reproduced by permission.
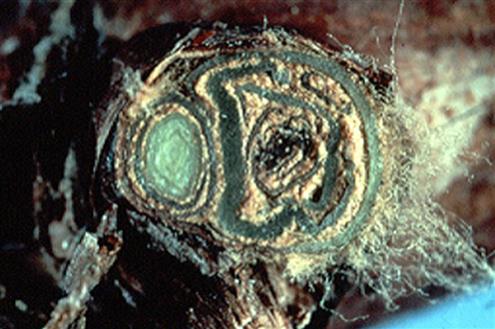
Plate 5.1Illustration of winter damage. The primary bud is dead whereas the secondary bud is still alive. The tertiary bud cannot be evaluated at this level of cut. (Photo courtesy of the late Dr Bob Pool, New York State Agricultural Experimental Station, Cornell University, Geneva, NY).
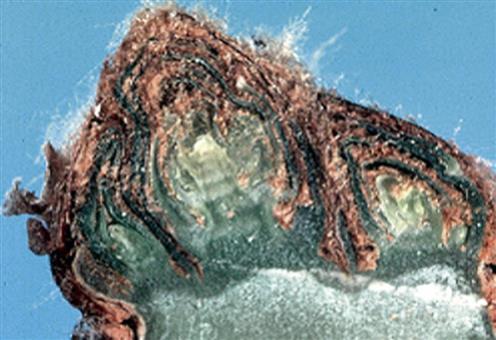
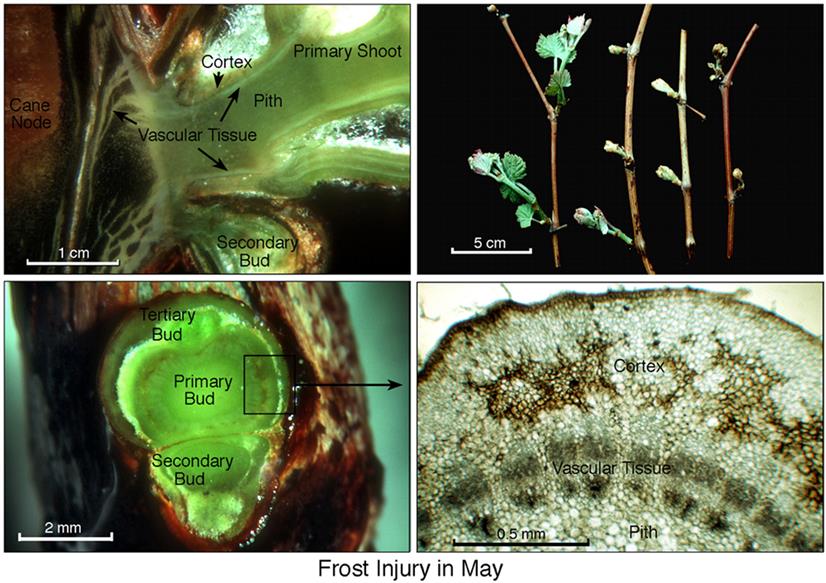
Plate 5.2Late-spring frost injury to grapevine: Top left, longitudinal slice through growing healthy shoot, showing the developing vascular system inside the primary shoot as well as downward directed vascular strands into the cane; top right, healthy shoot (left) and three shoots (right) affected by frost damage; bottom left, cross-sectional slice through frost-damaged bud showing darkened cortical cells; bottom right, detail of the boxed section showing black frozen cortex cells resulting from springtime freeze. (Photo courtesy Dr Martin Goffinet, Department of Horticultural Sciences, New York State Agricultural Experimental Station, Cornell University, Geneva, NY).
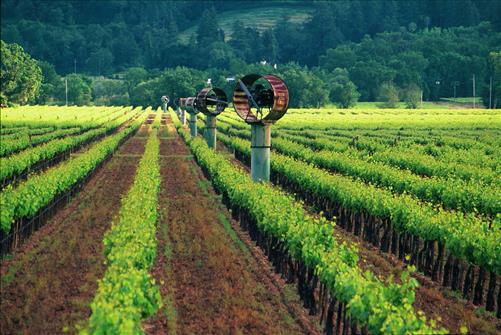
Plate 5.3Wind machines in Napa Valley. (Photo courtesy Napa Valley Vintners).
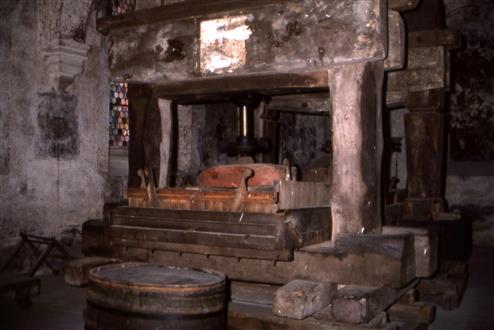
Plate 7.1Old vertical wine press in Kloster Erbach, Rheingau, Germany. (Photo courtesy R. Jackson).
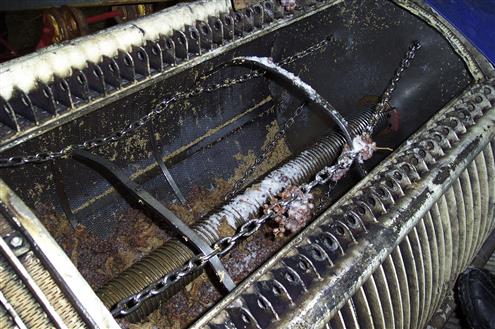
Plate 7.2Horizontal press showing chains used to crumble the press cake (rice hulls were added to aid juice extraction for frozen grapes in icewine production). (Photo courtesy of E. Brian Grant, CCOVI, Brock University, St Catharines, Canada).
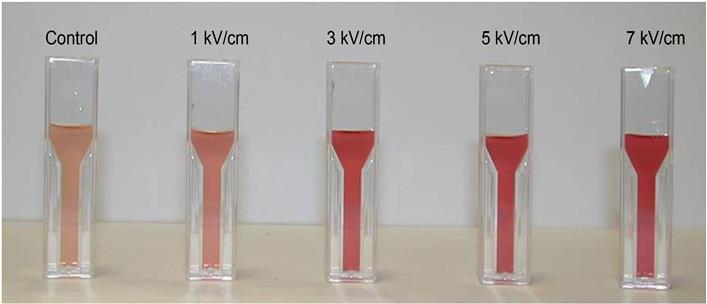
Plate 7.3Visual aspect of the Garnacha must after 1 h of maceration with grapes untreated and treated by pulsed electric field (PEF) (50 exponential decay pulses; 1e7 kV/cm; 0.4e4.1 kJ/kg). (Photo courtesy of Dr Raso; reprinted from Puértolas et al., 2010, with permission from Elsevier).
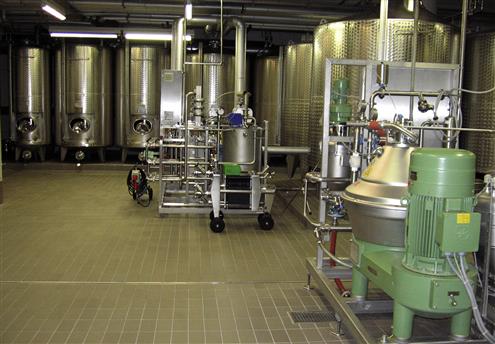
Plate 7.4Winery with mid-sized stainless steel fermentation tanks. (Photo courtesy of Gary Pickering, CCOVI, Brock University, St Catharines, Canada).
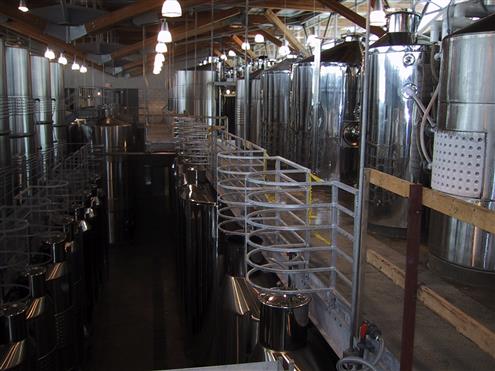
Plate 7.5Winery with large stainless steel fermentation tanks. (Photo courtesy of Gary Pickering, Brock University, St Catharines, Canada).
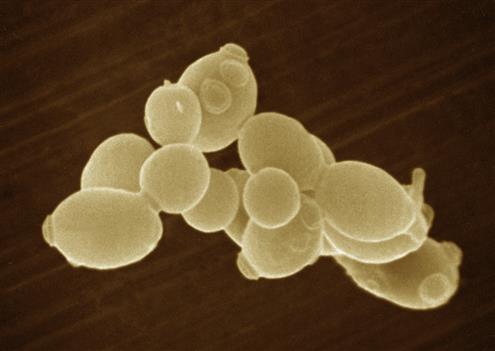
Plate 7.6Scanning electron micrograph of Saccharomyces cervisiae. (Photo courtesy Lallemand.).
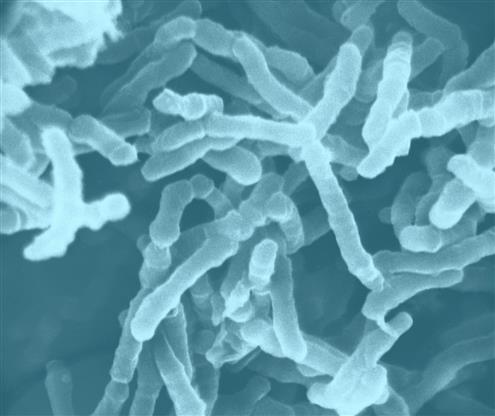
Plate 7.7Scanning electron micrograph of Oenococcus oeni. (Photo courtesy Lallemand.).
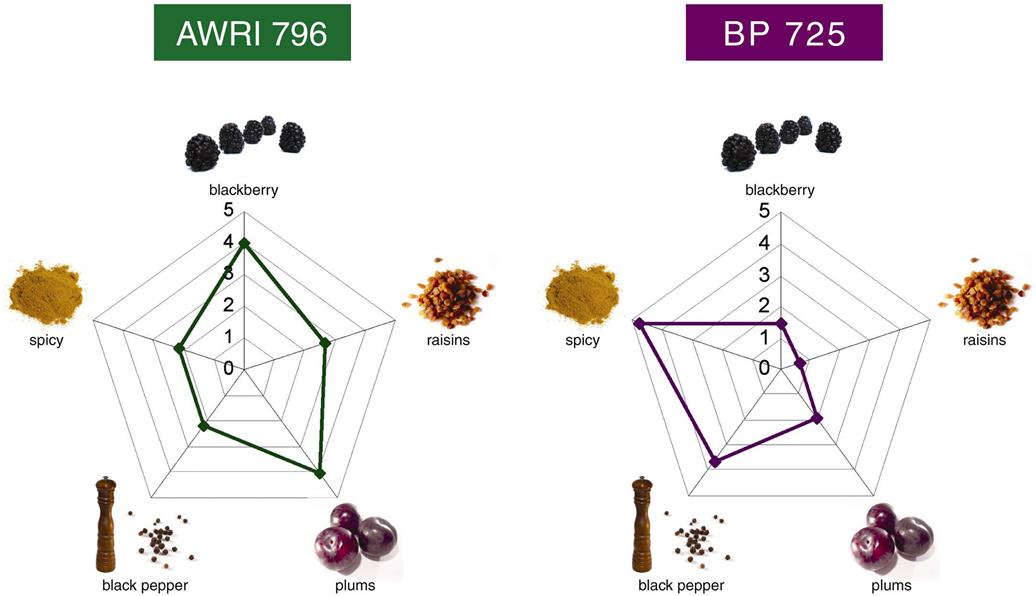
Plate 7.8Comparative aromas of Shiraz wines after fermentation with AWRI 796 and BP 725. The ranking system was designed with 1 being the lowest intensity and 6 being the highest. (From Walsh et al., 2006, reproduced with permission.)
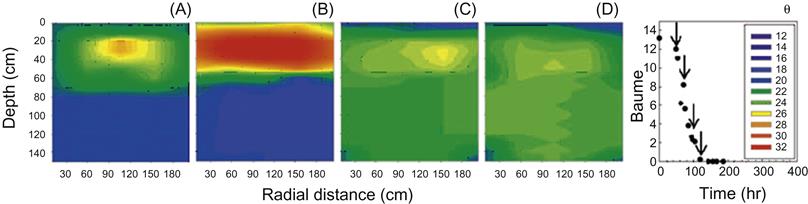
Plate 7.9Spatial distribution of temperatures during a 3450-L Pinot noir fermentation. Temperature measurements were taken at approximately 24 h intervals at the time indicated (arrows) in the appropriate fermentation curves (e). (From Schmid et al., 2009, reproduced by permission.)
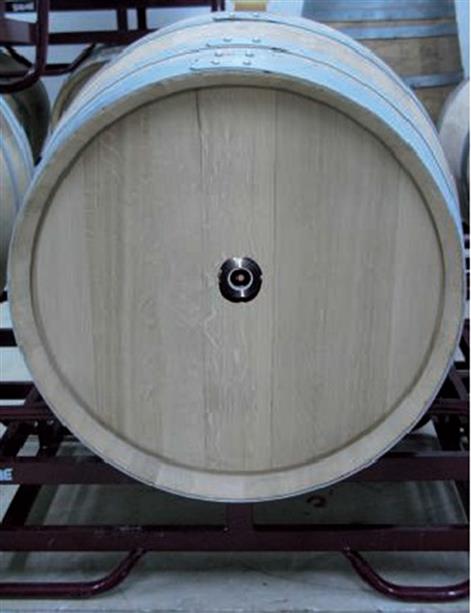
Plate 8.1Observation orifice for measuring oxygen content in wine aged in-barrel. Photo courtesy of Precision Sensing GmbH, Josef-Engert-Str., 1193053 Regensburg, Germany.
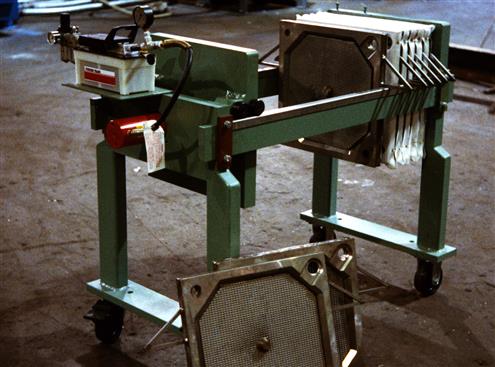
Plate 8.2Stainless steel plate-and-frame filter showing screen plate and frame. Photo courtesy of Avery Filter Co, Inc.
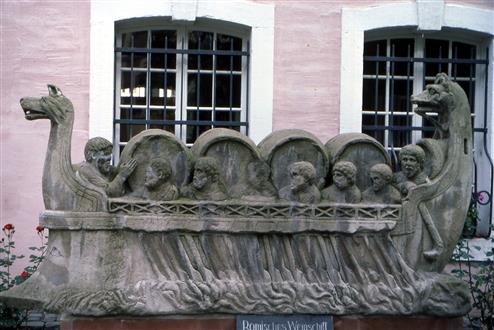
Plate 8.3Roman funerary monument found at Neumagener, Germany, showing representations of wine barrels being transported by boat. Photo courtesy R. Jackson.
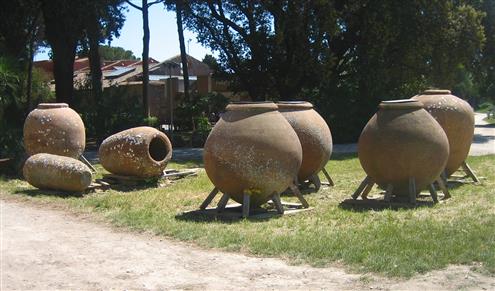
Plate 8.4Dolia in Ostia Antica, Italy. Photo taken by AlMare, Creative Commons Attribution-Share Alike 3.0.
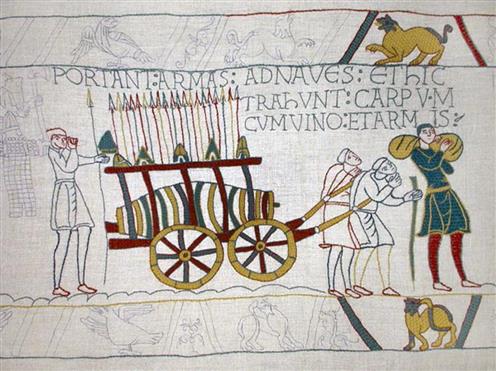
Plate 8.5Portion of the Bayeux Tapestry illustrating the style of barrel (average diameter/length ratio of 1:3) once common in Europe during the Middle Ages.
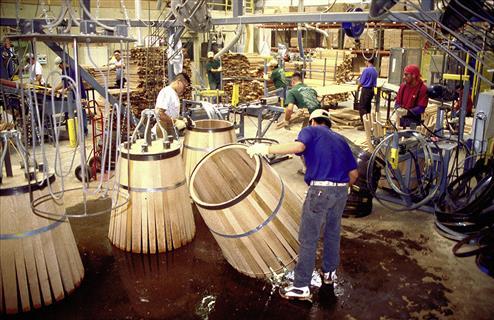
Plate 8.6Assembly of an oak wine barrel. Photo courtesy California Wine Institute.
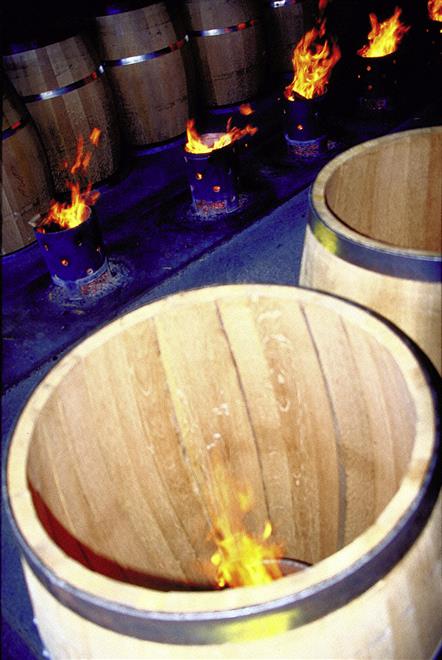
Plate 8.7The inside of an oak barrel. Photo courtesy California Wine Institute.
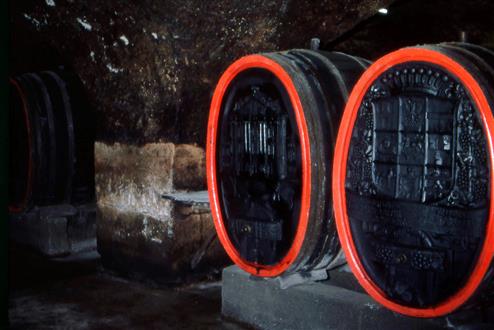
Plate 8.8Ornately decorated oak cooperage (Stück) at Schloss Schönburg, Rheingau, Germany. Photo courtesy R. Jackson.
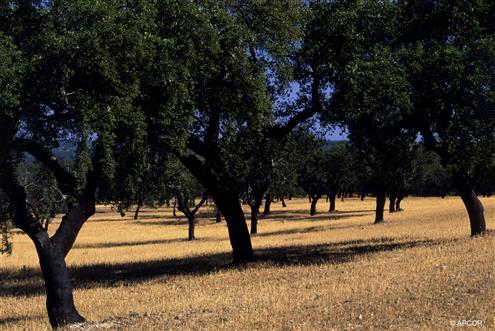
Plate 8.9Cork oak (Quercus suber) montado plantation system in southwestern Portugal showing well distanced trees. Photo courtesy Portuguese Cork Association – APCOR.
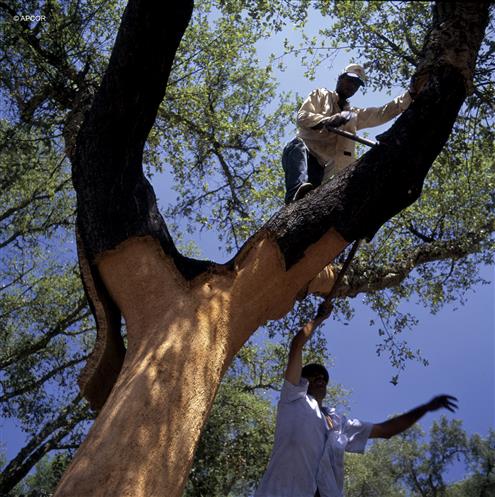
Plate 8.10Bark being harvested from a cork oak. Photo courtesy Portuguese Cork Association – APCOR.
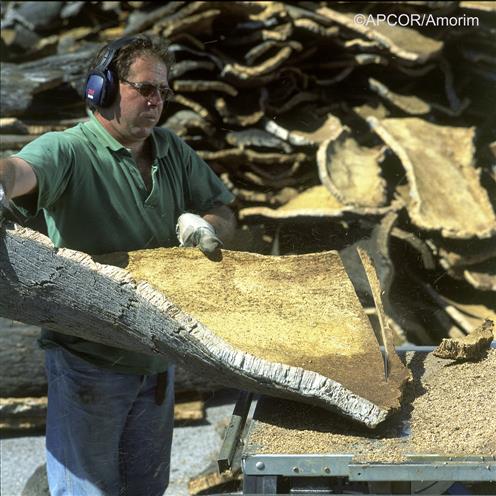
Plate 8.11Cutting strips of cork from a slab of bark in preparation for punching out stoppers. Photo courtesy Portuguese Cork Association – APCOR.
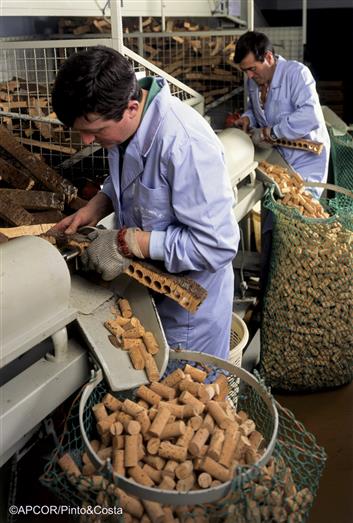
Plate 8.12Punching our cork stoppers from strips of cork bark. Photo courtesy Portuguese Cork Association – APCOR.
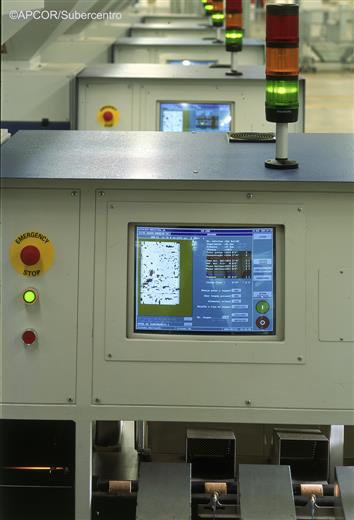
Plate 8.13Sorting of natural cork stoppers in grades using an automated optical device. Photo courtesy Portuguese Cork Association – APCOR.
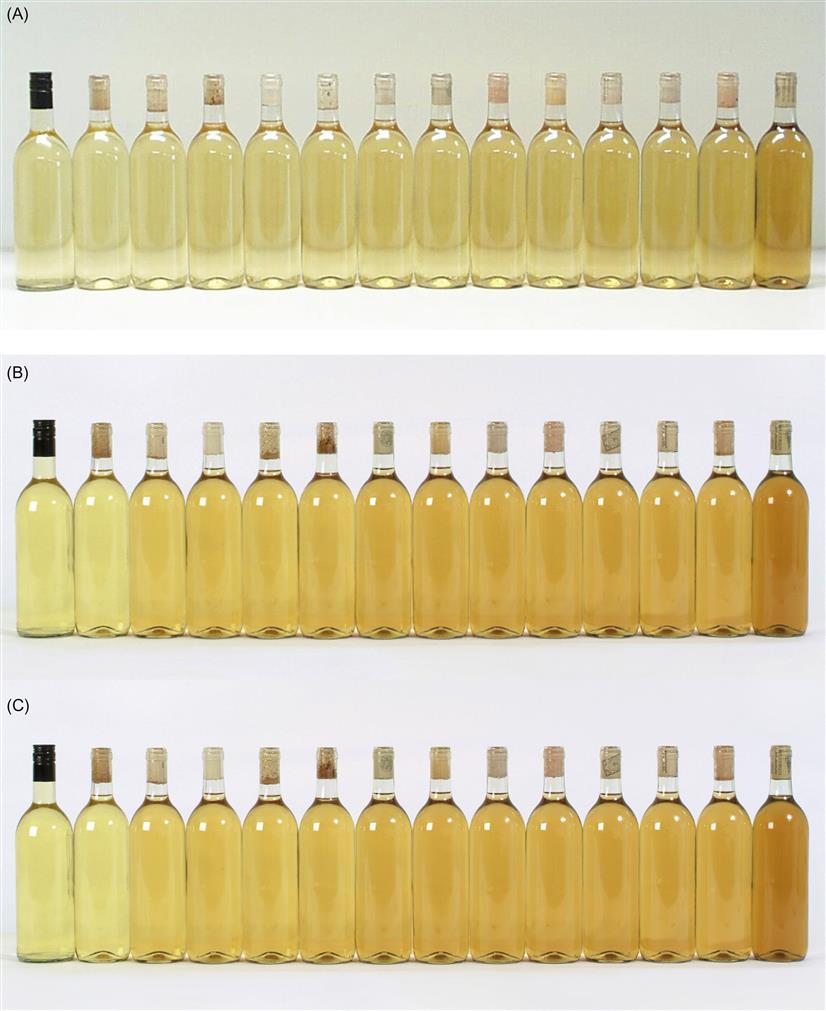
Plate 8.14Closure trial of a Sémillon wine employing 14 different closures: a screw cap (saran with tin liner), 2 natural corks, 2 technical corks and 9 synthetic closures (molded and extruded). The bottles were stored inverted (after 24 h) in a cool, dark area possessing an annual temperature range of 10°C (13–23°C), with daily fluctuations of about 1°C: (A) after 28 months (from right to left: screw cap, technical, technical, natural, synthetic, natural, 8 synthetic); (B) after 63 months (from right to left: screw cap, technical, natural, technical, synthetic, natural, 8 synthetic); and (C) after 125 months (from right to left: screw cap, technical, technical, natural, synthetic, synthetic, natural, 7 synthetic). Specific details on the closures are not provided because some are no longer commercially available. Photo courtesy Dr Peter Godden, Australian Wine Research Institute, Adelaide, Australia.
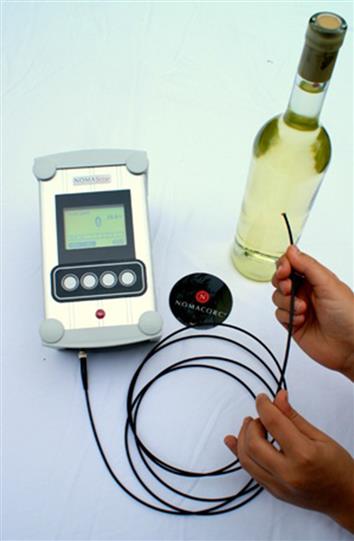
Plate 8.15Oxygen sensor system for wine aged in bottle. Photo courtesy of Precision Sensing GmbH, Josef-Engert-Str., 1193053 Regensburg, Germany.
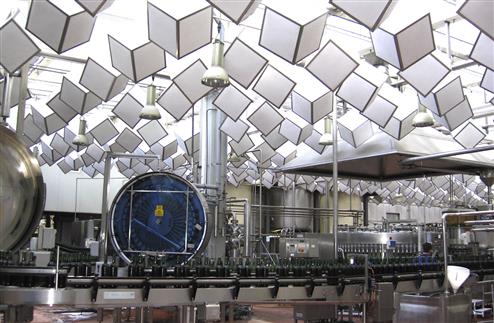
Plate 8.16Bottling plant with suspended sound dampening devices. Photo courtesy of Gary Pickering, CCOVI, Brock University, St Catharines, Canada.
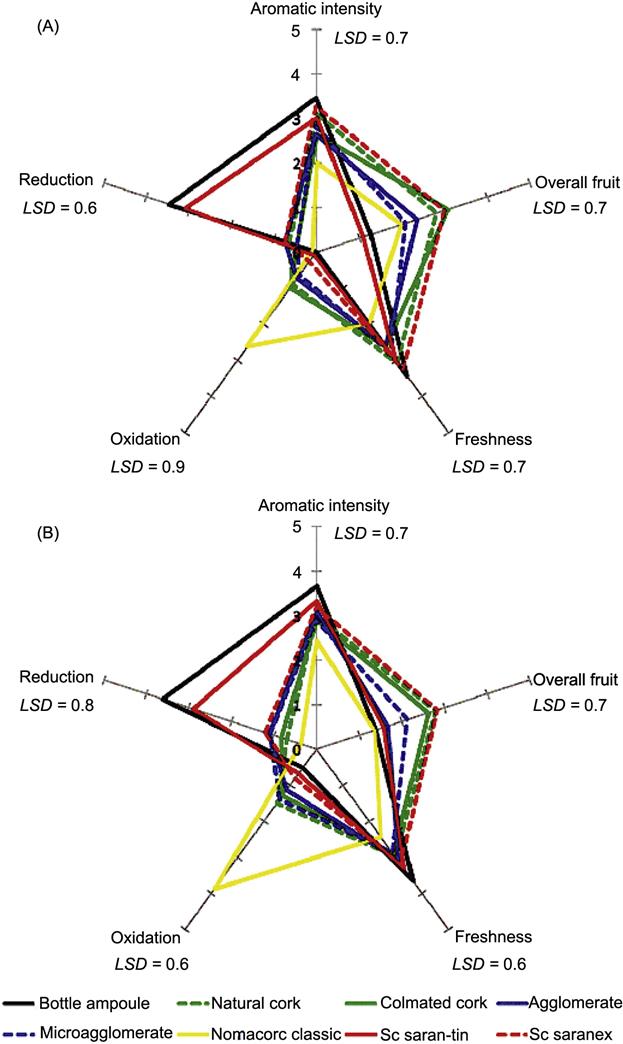
Plate 8.17The effect of closure treatment on selected sensory attributes for a Sauvignon blanc wine after (A) 12 months, (B) 24 months of storage. Values at 12 and 24 months are the means of four replicates. Least significant differences (LSD) at the 5% level are indicated. (From Lopes et al., 2009. Copyright 2009 American Chemical Society, reproduced with permission.)
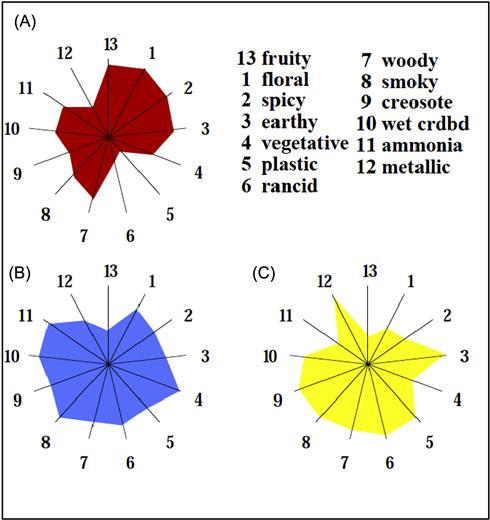
Plate 8.18Diagrammatic illustration of the perception of similar wines that were characterized as being free from any ‘Brett’ attributes (A), moderate ‘Brett’ character (B) and marked ‘Brett’ flavor (C). (From Licker et al., 1998. Copyright 1998 American Chemical Society, Washington, DC, reproduced by permission.)
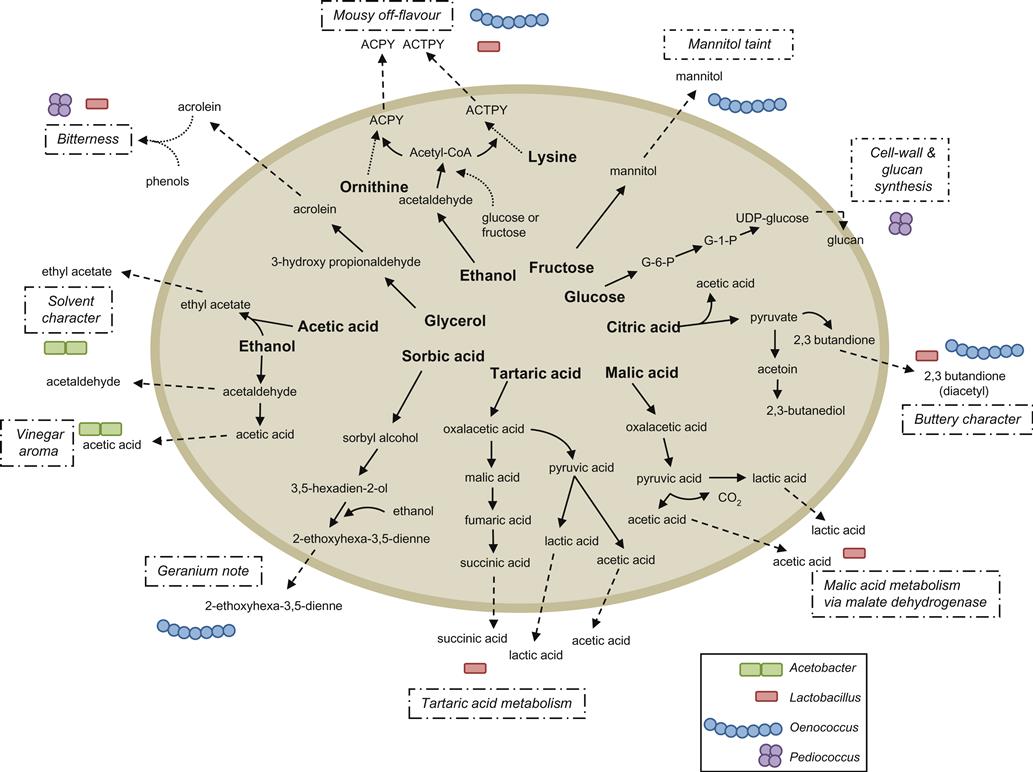
Plate 8.19Summary of bacterial pathways leading to spoilage aroma and flavour compounds of wine. (From Bartowsky 2009, reproduced by permission.)
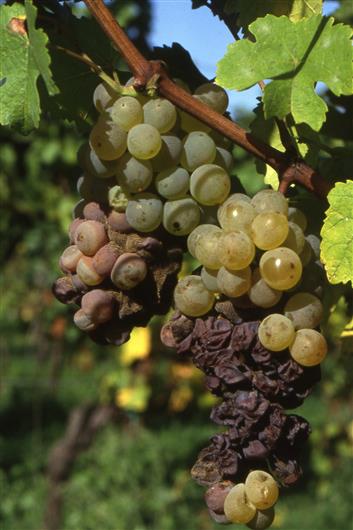
Plate 9.1Cluster of botrytized grapes showing berries in different states of noble rot. (Photo courtesy of D. Lorenz, Staatliche Lehr-und Forschungsanstalt für Landwirtschaft, Weinbau und Gartenbau, Neustadt, Germany).
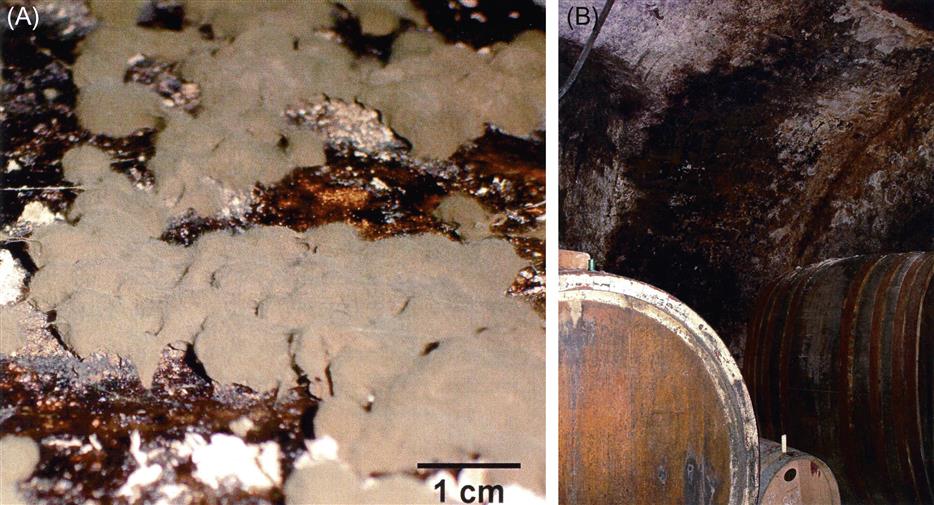
Plate 9.2Growth of the fungus Racodium cellare (A) in the cellar of Martinspforte vineyard (Einselthum, Pfalz, Germany) (B). Colonization is dense above the small new wooden barrel used for ‘barrique’ wine but sparse above the larder old barrels flanking it. The fungus derives most of it nourishment from ethanol escaping into the air. It is thought to cleanse the cellar air of off-odors. (Photo courtesy Roland Weber, from Tribe, H. T., Thines, E., and Weber, R. W. S. (2006) Moulds that should be better known: the wine cellar mould, Racodium cellare Persoon. Mycologist20, 171–175, with permission from Elsevier).
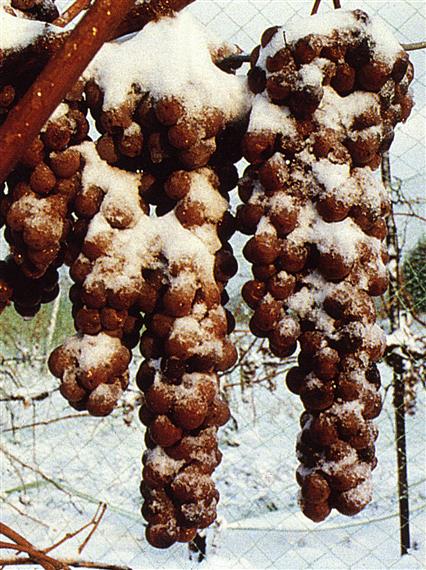
Plate 9.3‘Vidal’ grapes ready for picking in the production of icewine. (Photo courtesy of Inniskillin Wines Inc., Canada).
Plate 9.4Transfer of harvested grapes for icewine production from the vineyard to the winery. (Photo courtesy of E. Brian Grant, CCOVI, Brock University, St Catharines, Ontario, Canada).
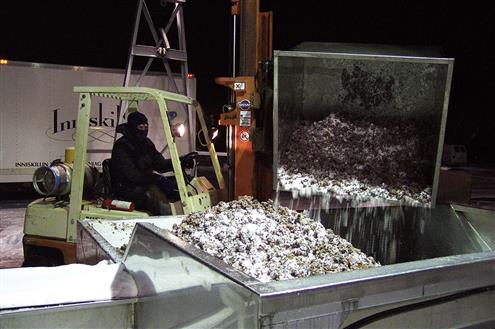
Plate 9.5Forklift truck placing basket full of icewine grapes in preparation for crushing. (Photo courtesy of E. Brian Grant, CCOVI, Brock University, St Catharines, Ontario, Canada).
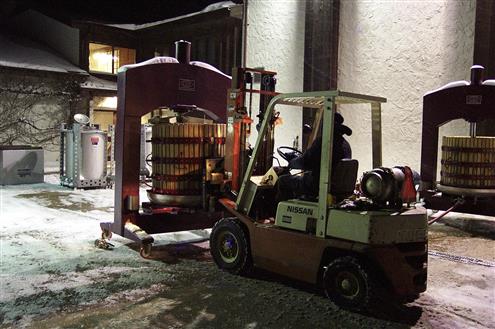
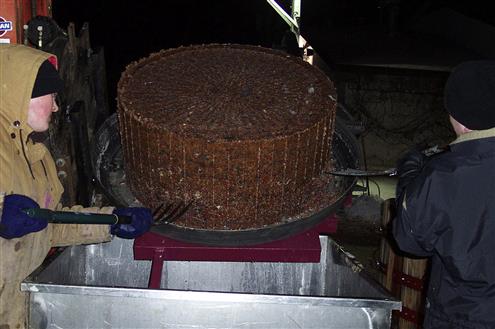
Plate 9.6Press cake of icewine grapes from a basket press being crumbled for the second pressing. (Photo courtesy of E. Brian Grant, CCOVI, Brock University, St Catharines, Ontario, Canada).
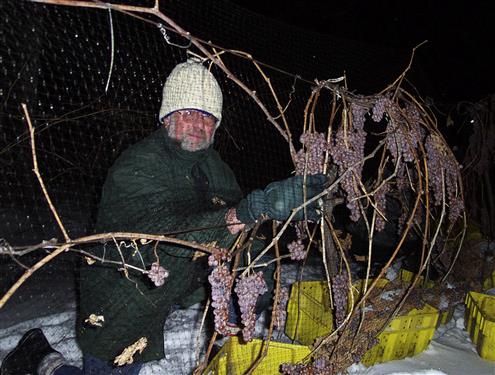
Plate 9.7Harvesting grapes for icewine production. (Photo courtesy of E. Brian Grant, CCOVI, Brock University, St Catharines, Ontario, Canada).
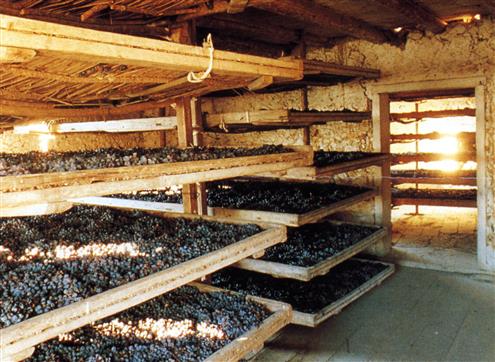
Plate 9.8Warehouse for the slow drying of grapes in the production of recioto wines. (Photo courtesy of Masi Agricola S.p.a., Italy).
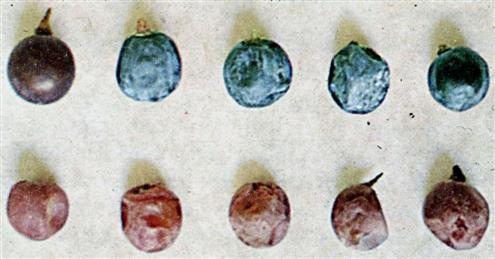
Plate 9.9Grapes exposed to progressive drying in the recioto process. Upper row: healthy grapes; lower row: grapes infected with Botrytis cinerea. (Photo courtesy of Dr Usseglio-Tomasset, Instituto Sperimentale per l’Enologia, Asti, Italy).
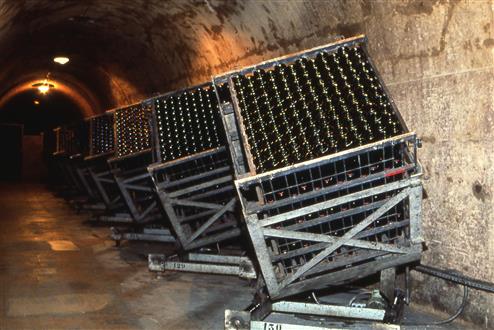
Plate 9.10Mechanical riddling machine in Champagne. (Photo courtesy of Peper-Heidsieck, France).
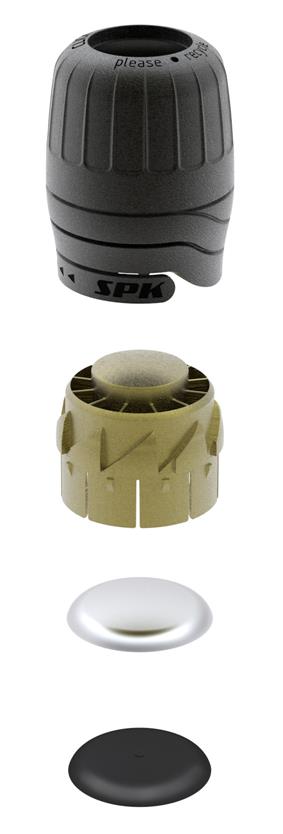
Plate 9.11The SPK Zork cork for sparkling wines that offers the option to seal the bottle effectively once it has been opened. (Photo courtesy of contacted Scholle Packaging).
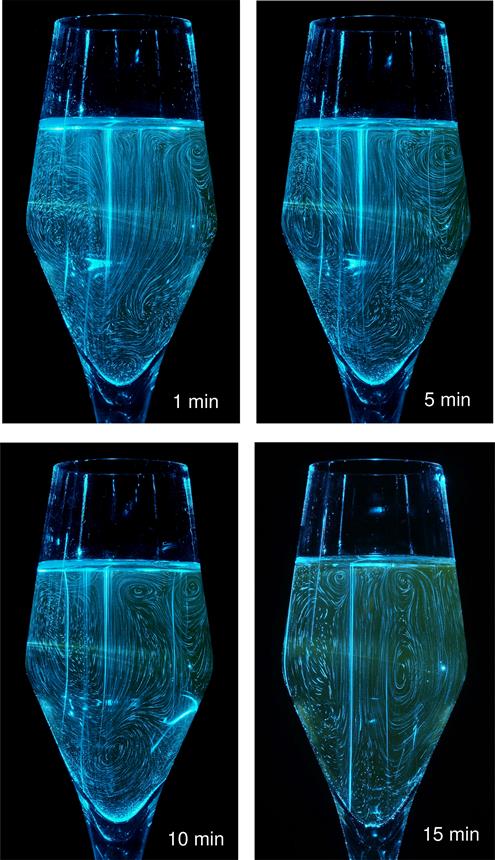
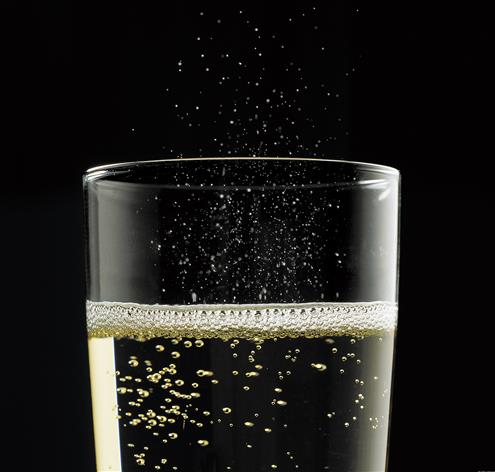
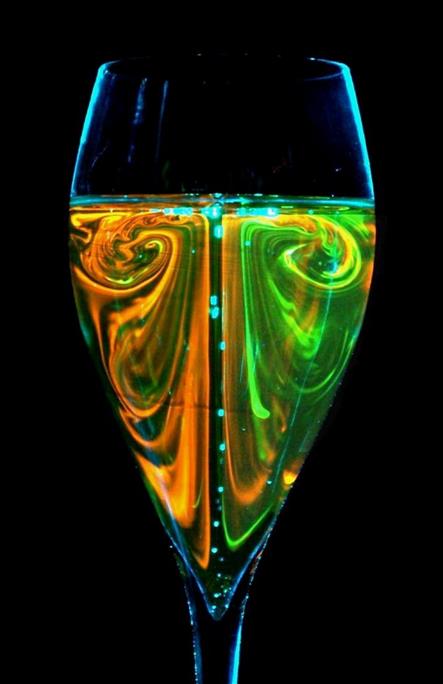
Plate 9.13Typical time-sequence showing the flow patterns found in the plane of symmetry of the flute. (Photo courtesy of G. Liger-Belair, F. Beaumont and G. Polidori, From Liger-Belair et al., 2008a, reproduced by permission).
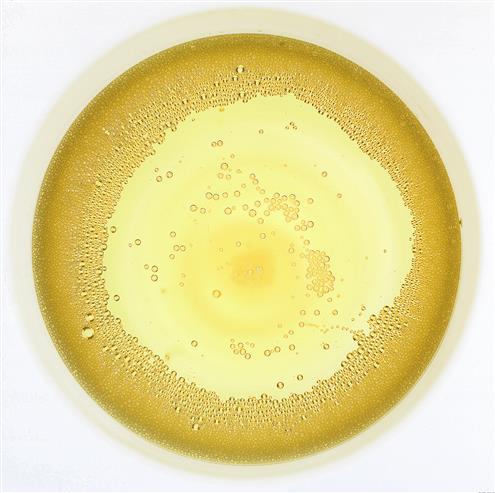
Plate 9.16Growth of flor yeasts on the surface of wine in a sherry butt. (Photo courtesy of Bodegas Pedro Domecq, S.A., Spain).
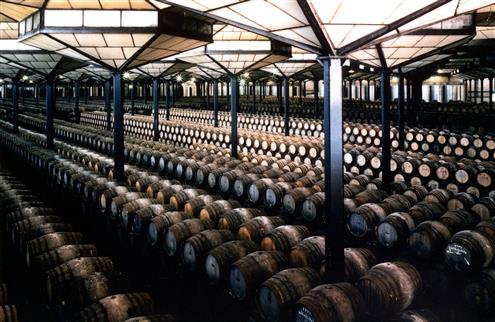
Plate 9.17Las Copas bodega, showing stacked rows (criaderas) of sherry butts. (Photo courtesy of Gonzalez Byass, Spain).
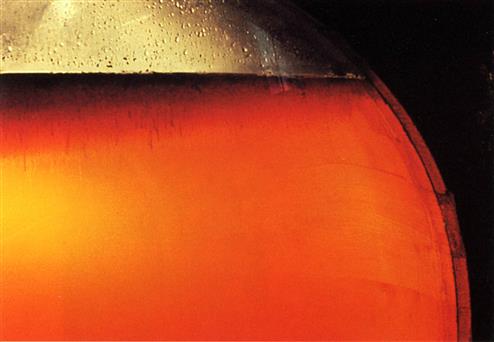
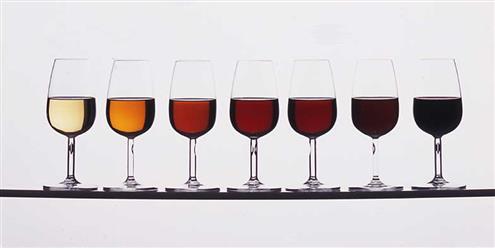
Plate 9.18The color range of different types of port. (Photo by João Paulo Sottomayor, courtesy of Instituto dos Vinhos do Douro e do Porto, I. P.).
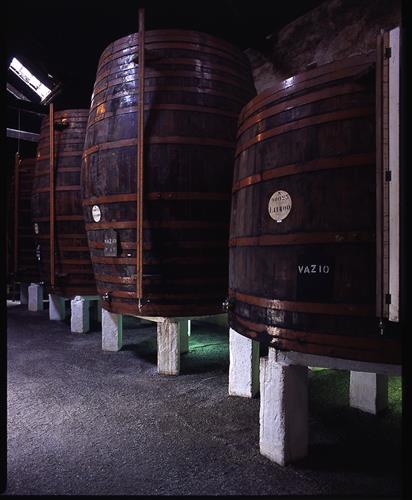
Plate 9.19Different cooperage for port aging. (Photo by Luís Ferreira Alves, courtesy of Instituto dos Vinhos do Douro e do Porto, I. P.).
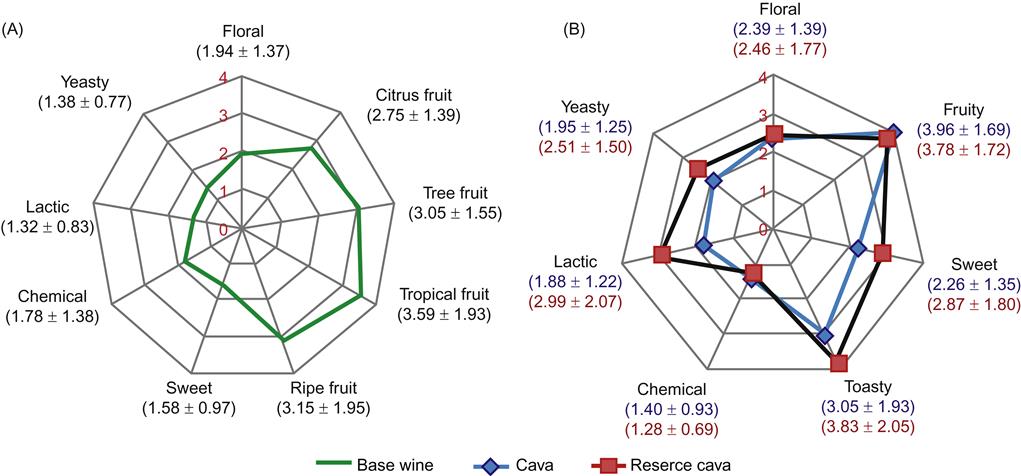
Plate 9.20Aroma profiles of the base wine (A) and cava (aged for 14 and 24 months before disgorging, respectively) (B) obtained from it. (From Torrens et al., 2010. Copyright 2010 American Chemical Society, reproduced by permission.)
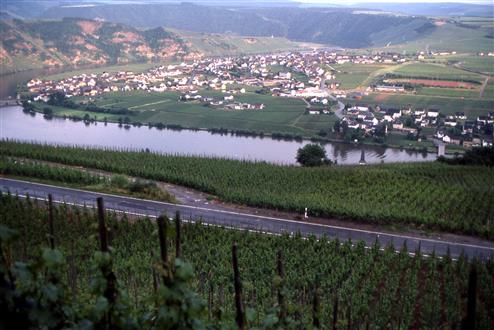
Plate 10.1Steeply sloped vineyards near Zeltingen in the Mosel, Germany. Photo R. Jackson.
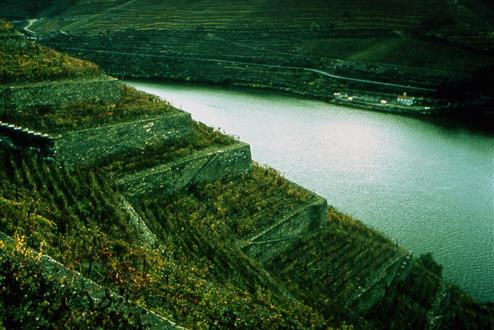
Plate 10.2Terraced vineyards of the Douro, Portugal. Photo courtesy of Instituto do Vinho do Porto, Portugal.
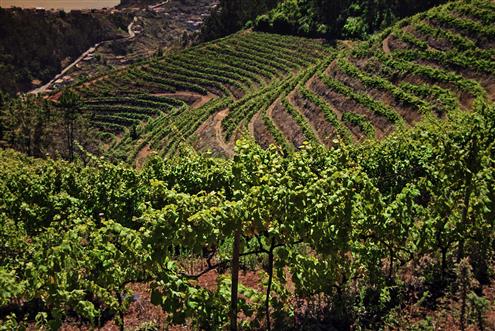
Plate 10.3Terraced vineyards and training with bilateral cordons in Madeira. Photo courtesy of Sogrape Vinhos S.A., Portugal.
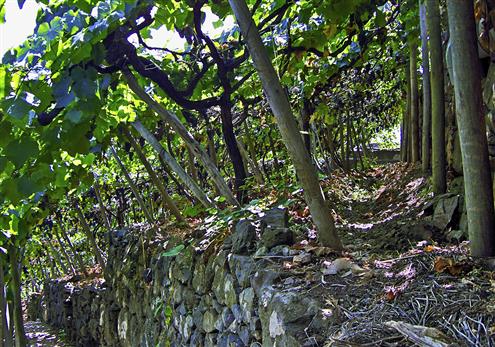
Plate 10.4Training and retaining wall for a terraced vineyard in Madeira. Photo courtesy of Sogrape Vinhos S.A., Portugal.
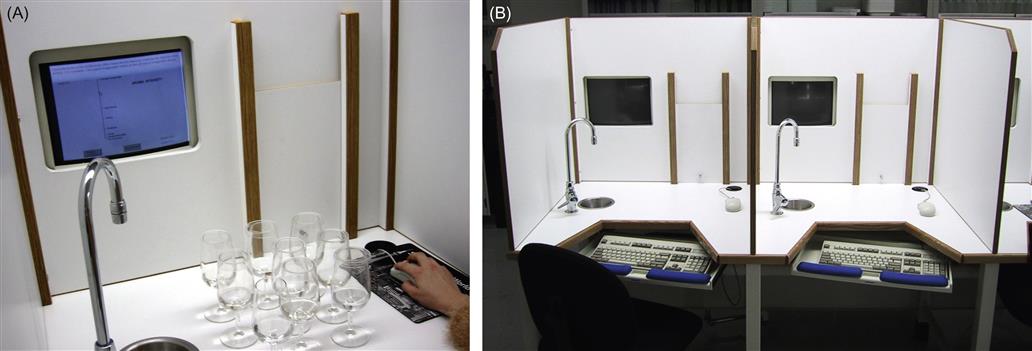
Plate 11.1Tasting booths in a wine sensory laboratory. (Photo courtesy G. Pickering, CCOVI, Brock University, St Catharines, Canada).
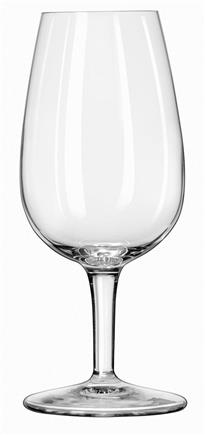
Plate 11.2Example of a Luigi Bormiolo D.O.C. international wine-tasting glass (7.5 oz.). (Photo courtesy of Libbey®).
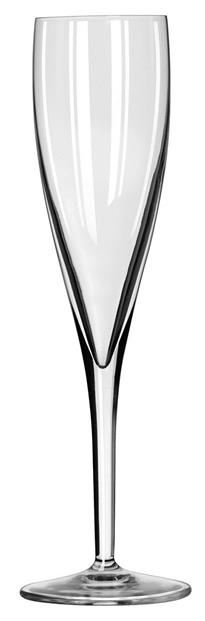
Plate 11.3Example of a Luigi Bormiolo Accademia Del Vino champagne flute (6¼oz.). (Photo courtesy of Libbey®).
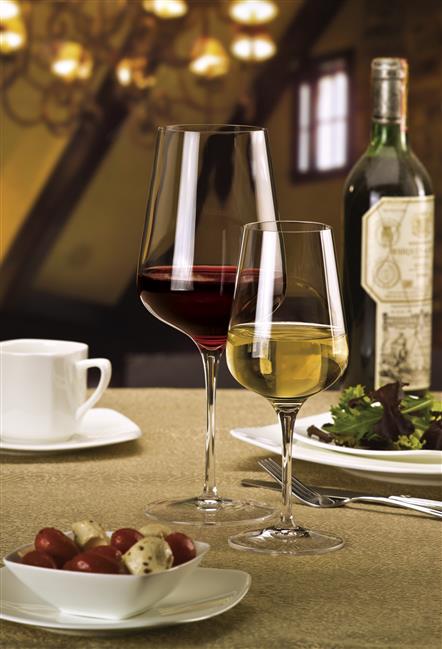
Plate 11.4Example of Luigi Bormiolo Intenso wine-tasting glasses of differing volumes. (Photo courtesy of Libbey®).
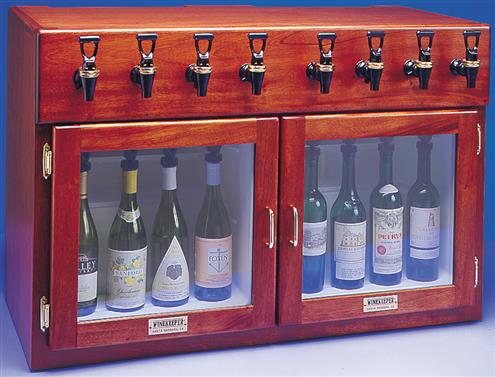
Plate 11.5Wine dispenser divided into ambient and refrigerated sections, using nitrogen gas cylinder as the dispensing agent. (Photo courtesy of the WineKeeper®).
Plate 11.6Visualization of the swirling flow in a champagne flute with a circular etching on the bottom of the glass. (Photo courtesy of G. Liger-Belair; from Polidori et al., 2008, reproduced with kind permission from Springer Science and Business Media).