CHAPTER 1
Introduction
The global surface temperature has increased gradually since the turn of the twentieth century. This is evident in figure 1.1, which shows the time series of the global mean surface temperature anomaly (relative to a 1961–90 baseline) since the middle of the nineteenth century. Although the temperature fluctuates over interannual, decadal, and interdecadal time scales, it has increased gradually during the past 100 years with a relatively large increase during the past several decades. For the period prior to the middle of the nineteenth century, many attempts have been made to reconstruct the large-scale trends of surface temperature from natural archives of climate-related proxies, using data sets that include more than 1000 tree-ring, ice-core, coral, sediment, and other assorted proxy records from ocean and land throughout the globe (Jansen et al., 2007). As one example of such efforts, figure 1.2 depicts the time series of Northern Hemisphere mean surface temperature reconstructed by Mann et al. (2008, 2009) for the past 1500 years. According to this reconstruction, surface temperature was relatively low between 1450 and 1700 (i.e., the Little Ice Age) but was relatively high prior to 1100, during the Medieval Climate Anomaly. These results suggest, however, that the warmth of the past half-century is quite unusual during at least the past 1500 years.
As stated in the Fifth Assessment Report of the Intergovernmental Panel on Climate Change (IPCC, 2013b), “it is extremely likely that human influence has been the dominant cause of the observed warming since the mid-20th century” (17). The report further concludes that a majority of the observed warming can be attributed to the anthropogenic increase in the concentrations of greenhouse gases such as carbon dioxide, methane, and nitrous oxide. According to figure 1.3, which shows the temporal variation in carbon dioxide (CO2) concentration over the past 1200 years, the level of atmospheric CO2 fluctuated by around 280 ppmv (parts per million by volume) until the end of the eighteenth century, when it began to increase gradually. This increase accelerated during the twentieth century, when temperature also increased as indicated in figure 1.1. Other greenhouse gases such as methane and nitrous oxide have also increased in a qualitatively similar manner during the same period. Although greenhouse gases are minor constituents of the atmosphere (table 1.1), they strongly absorb and emit infrared radiation, exerting the so-called “greenhouse effect” that helps to maintain a warm and habitable climate at the Earth’s surface.

FIGURE 1.1 Annual global mean surface temperature anomalies (relative to the 1961–90 reference period mean) from the latest versions of the three combined land-surface-air temperature (LSAT) and sea surface temperature (SST) data sets (HadCRUT4, GISS, and NCDC MLOST). For the identification of the three institutions indicated by acronyms, see Intergovernmental Panel on Climate Change (IPCC) (2013a). From Hartmann et al. (2013).
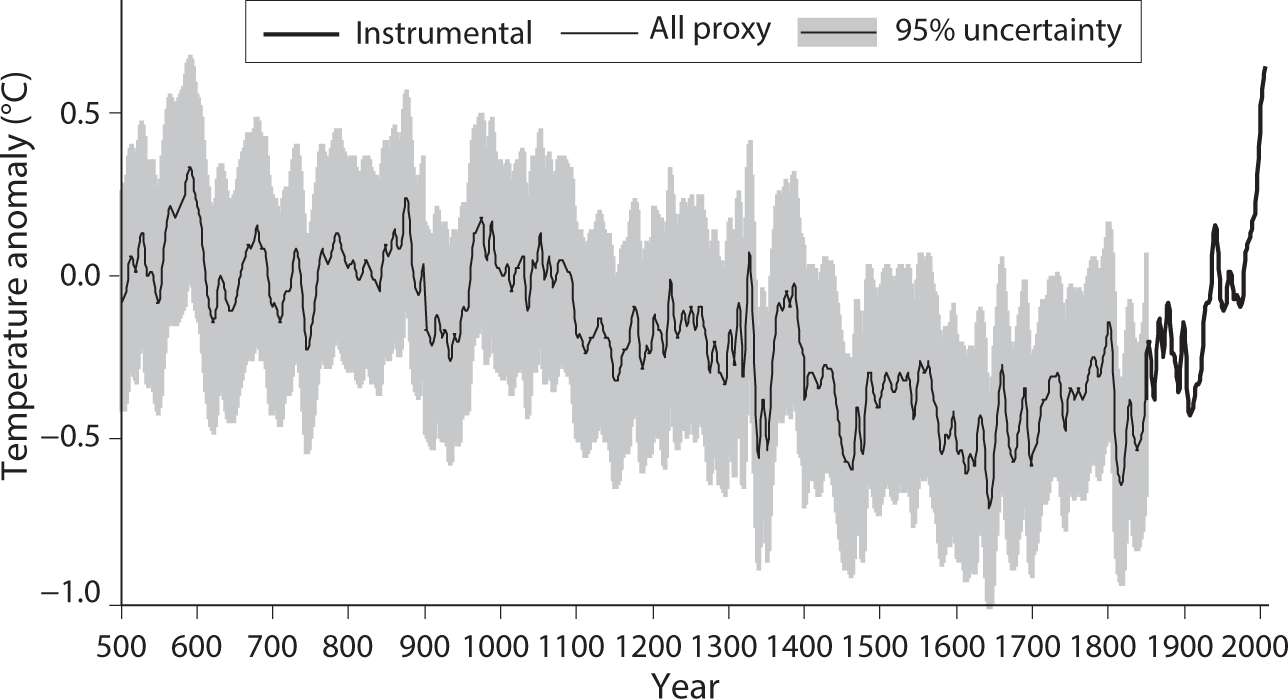
FIGURE 1.2 Time series of Northern Hemisphere mean surface temperature. The thin line indicates the temporal variation of reconstructed decadal surface temperature anomaly (°C), averaged over the entire Northern Hemisphere, during the past 1500 years. Anomalies are defined relative to the 1961–90 reference period mean; shading indicates 95% confidence intervals. For the recent period, anomalies obtained by thermometers are indicated by the thick line. From Mann et al. (2008, 2009).

FIGURE 1.3 Temporal variation of CO2 concentration in air over the past 1100 years, from Antarctic ice-core records (D57, D47, Siple, South Pole) and (since 1958) data from the Mauna Loa measurement site. The former are based upon the analysis of air bubbles in the Antarctic ice sheet, and the latter were obtained from instrumental observations. The smooth curve is based on a 100-year running mean. From Schimel et al. (1995).
In the remainder of this chapter, we describe the mechanism by which these gases affect the temperature of the Earth’s surface by modifying the upward flux of infrared radiation emitted by it. We then discuss how the greenhouse effect increases in magnitude as the concentrations of these gases increase, warming not only the Earth’s surface but also the entire troposphere owing to the upward transport of heat by turbulence and convection.
TABLE 1.1 Composition of the air |
|
Constituent |
Approximate % by weight |
Nitrogen (N2) |
75.3 |
Oxygen (O2) |
23.1 |
Argon (Ar) |
1.3 |
Water vapor (H2O)* |
~0.25 |
Carbon dioxide (CO2)* |
0.046 |
Carbon monoxide (CO) |
~1 × 10⁻⁵ |
Neon (Ne) |
1.25 × 10⁻³ |
Helium (He) |
7.2 × 10⁻⁵ |
Methane (CH4)* |
7.3 × 10⁻⁵ |
Krypton (Kr) |
3.3 × 10⁻⁴ |
Nitrous oxide (N2O)* |
7.6 × 10⁻⁵ |
Hydrogen (H2) |
3.5 × 10⁻⁶ |
Ozone (O3)* |
~3 × 10⁻⁶ |
*Greenhouse gases. |
|
The Greenhouse Effect
The Earth exchanges energy with its surroundings via the transfer of electromagnetic radiation. Thus the heat balance of the Earth is determined by the heat gain due to the absorption of incoming solar radiation with relatively short wavelengths (~0.4–1 µm) and the heat loss due to outgoing terrestrial radiation with relatively long wavelengths (~4–30 µm), as illustrated schematically in figure 1.4. In a hypothetical situation in which the energy output of the Sun and the composition of the Earth’s atmosphere are unchanged, the net incoming solar radiation and outgoing terrestrial radiation averaged over the entire globe and over a sufficiently long period of time would be exactly equal to each other. This is because the Earth as a whole seeks the temperature that satisfies the requirement of radiative heat balance. If the temperature of the Earth is too high, for example, the heat loss due to outgoing terrestrial radiation is larger than the heat gain due to net incoming solar radiation, thereby reducing the temperature of the planet as a whole. On the other hand, if the temperature is too low, the reverse is the case, raising the temperature of the planet. In the long run, the Earth’s temperature is maintained such that the net incoming solar radiation and outgoing terrestrial radiation at the top of the atmosphere are in balance.

FIGURE 1.4 Schematic diagram illustrating the radiative heat budget of the Earth.
Averaged over the entire globe, the incoming solar radiation at the top of the atmosphere is 341.3 W m−2 (Trenberth et al., 2009), of which 101.9 W m−2, or about 30%, is reflected back into space by the Earth’s surface, cloud, aerosols, and air molecules. The remaining 70% is absorbed, mostly by the surface, implying that the net incoming solar radiation at the top of the atmosphere is 239.4 W m−2, which is slightly larger than the value of 238.5 W m−2 for outgoing terrestrial radiation that has been obtained based upon satellite observations (Loeb et al., 2009; Trenberth et al., 2009). The radiative imbalance of 0.9 W m−2 is consistent with the planetary warming that is currently under way. Assuming that the Earth-atmosphere system radiates as a blackbody according to the Stefan-Boltzmann law (see box Blackbody Radiation and Kirchhoff’s Law on p. 8), one can compute approximately the effective emission temperature of the planet. The temperature thus obtained is −18.7°C, which is about 33°C lower than the Earth’s global mean surface temperature of +14.5°C.
Because the Earth’s surface radiates almost as a blackbody, as noted above, one can also use the Stefan-Boltzmann law to estimate approximately the upward flux of radiation emitted by the Earth’s surface. The flux thus obtained is 389 W m−2 and is much larger than the 238.5 W m−2 of outgoing terrestrial radiation emitted from the top of the atmosphere. This implies that the atmosphere traps ~151 W m−2 of the upward flux of radiation emitted by the Earth’s surface before it reaches the top of the atmosphere. In short, the atmospheric greenhouse effect prevents approximately 39% of the outgoing radiation emitted by the Earth’s surface from escaping from the top of the atmosphere, thereby keeping the surface warmer than it would be by approximately 33°C. Thus, satellite observations of outgoing terrestrial radiation provide convincing evidence for the existence of a greenhouse effect of the atmosphere that intercepts a substantial fraction of the upward flux of terrestrial radiation emitted by the Earth’s surface.
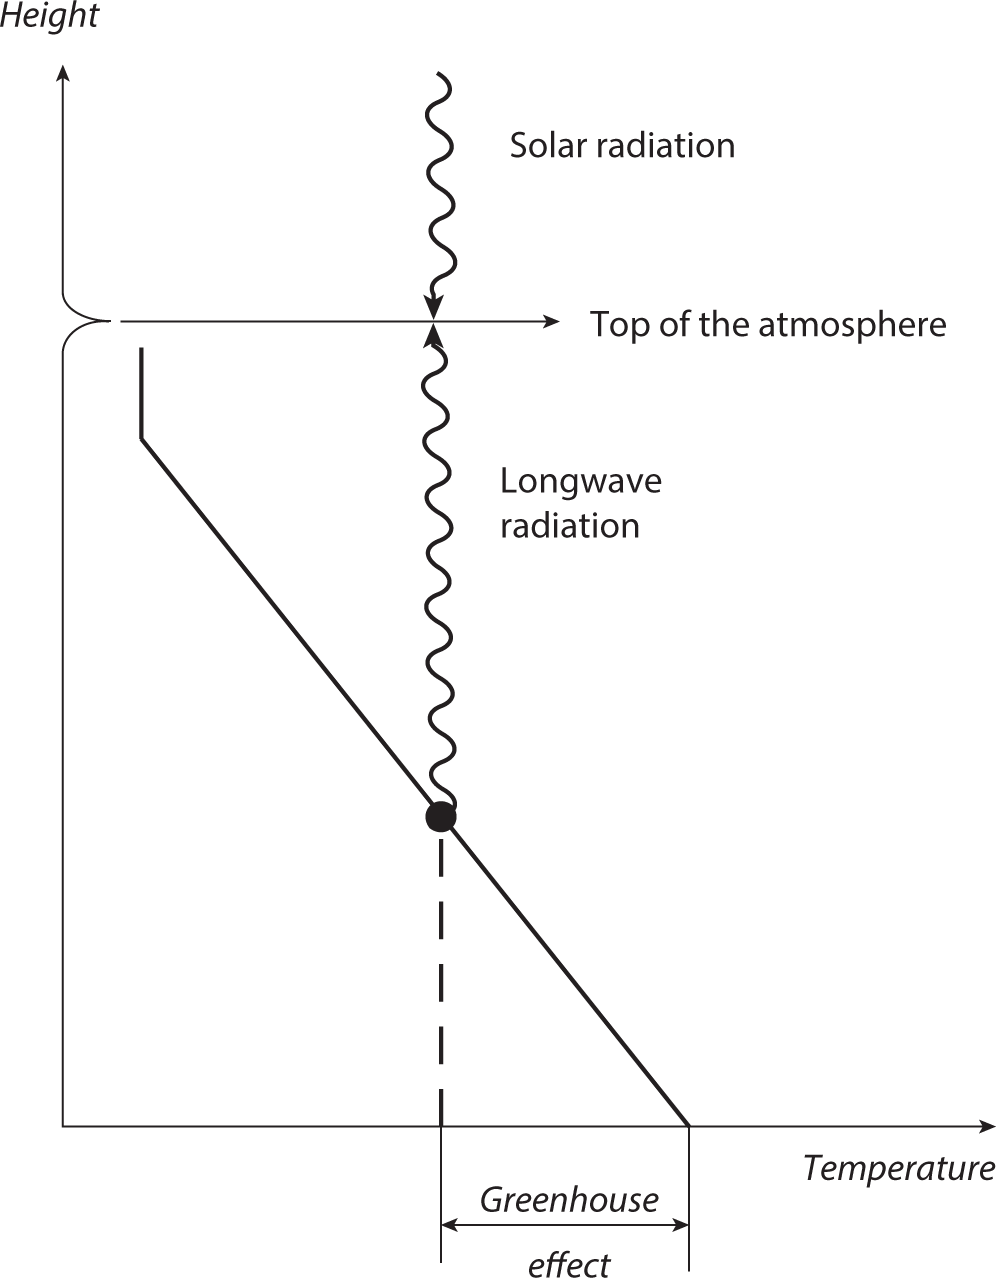
FIGURE 1.5 Schematic diagram illustrating the greenhouse effect of the atmosphere. The slanted solid line indicates the vertical temperature profile of the troposphere. The vertical line segment at the top of the slanted line indicates the almost isothermal temperature profile of the stratosphere. The dot on the slanted line indicates the average height of the layer of emission for the upward flux of outgoing terrestrial radiation from the top of the atmosphere.
Figure 1.5 illustrates schematically the greenhouse effect of the atmosphere. In this figure, the slanted solid line indicates the idealized temperature profile of the troposphere, where temperature decreases almost linearly with height. The dot on the slanted line, located in the middle troposphere, indicates the average height of the layer of emission for the outgoing terrestrial radiation from the top of the atmosphere. As noted above, its temperature (TA) is −18.7°C, which may be compared with +14.5°C—that is, the global mean temperature of the Earth’s surface (TS). As already noted, the difference between the two temperatures is 33°C, indicating that the atmosphere has a large greenhouse effect that warms the Earth’s surface by this amount. In the following paragraphs, we shall attempt to explain why the atmosphere has this greenhouse effect and why it is so large.
Figure 1.6, which is a modified version of a figure presented by Peixoto and Oort (1992), illustrates how the atmosphere absorbs solar and terrestrial radiation. Figure 1.6a contains the normalized spectra of blackbody radiation at 255 K and 6000 K, which roughly mimic the spectra of outgoing terrestrial radiation and incoming solar radiation at the top of the atmosphere, respectively. As this figure shows, terrestrial radiation occurs at wavelengths that are mostly longer than 4 µm, whereas solar radiation involves wavelengths that are mostly shorter than 4 µm. Thus, it is reasonable to treat the transfer of terrestrial radiation in the atmosphere separately from that of solar radiation. Hereafter, we shall call the former “longwave radiation” to distinguish it from solar radiation with relatively short wavelengths.
Figure 1.6b and c illustrates the spectral distribution of absorption (%) by the cloud-free atmosphere. Although the clear atmosphere is almost transparent to the visible portion of solar spectrum at wavelengths between 0.3 and 0.7 µm, allowing the major fraction of incoming solar radiation to reach the Earth’s surface, it absorbs very strongly over much of the spectral range of terrestrial longwave radiation, mainly owing to water vapor. In the so-called “atmospheric window” located between 7 and 20 µm, where water vapor is relatively transparent, carbon dioxide, ozone, methane, and nitrous oxide absorb very strongly around wavelengths of 15, 9.6, 7.7, and 7.8 µm, respectively, as shown in figure 1.6d. Although not shown in this figure, chlorofluorocarbons (CFCs) also absorb strongly in the 7–13 µm range, as pointed out, for example, by Ramanathan (1975). Although these greenhouse gases are minor constituents of the atmosphere, as shown in table 1.1, they collectively absorb and emit over much of the spectral range of terrestrial longwave radiation, exerting a powerful greenhouse effect as described below.
Radiative transfer from the Earth’s surface and in the atmosphere obeys Kirchhoff’s law, as described briefly in the box Blackbody Radiation and Kirchhoff’s Law on page 8. This law requires that, at each wavelength, the absorptivity of a substance is equal to its emissivity, which is defined as the ratio of the actual emission to the theoretical emission from a blackbody. Because the Earth’s surface behaves almost as a blackbody, it has an absorptivity that is close to one, absorbing almost completely the downward flux of longwave radiation that reaches it. In keeping with Kirchhoff’s law, the Earth’s surface emits an upward flux of longwave radiation almost as a blackbody would. As this upward flux penetrates into the atmosphere, it is depleted owing to the absorption by greenhouse gases, but it is also accreted because of the emission from these gases. The upward flux decreases or increases with height, depending upon whether the depletion is larger than the accretion, or vice versa.
Blackbody Radiation and Kirchhoff’s Law
Let’s consider a medium inside a perfectly insulated enclosure with a black wall that absorbs 100% of incident radiation. Assume that this system has reached the state of thermodynamic equilibrium characterized by uniform temperature and isotropic radiation. Because the wall is black, the radiation emitted by the system to the wall is absorbed completely. On the other hand, the outgoing emission from the wall is identical in magnitude to the incoming radiation. Radiation within the system is referred to as blackbody radiation, which depends only on temperature and wavelength according to the so-called Planck function. The spectral distributions of the normalized Planck function are shown in the right and left sides of figure 1.6a for 255 K and 6000 K, which approximate the equivalent emission temperature of the Earth and Sun, respectively. Summing up over all frequencies, the blackbody radiation depends only upon temperature and is proportional to the fourth power of the absolute temperature (in Kelvin) according to the Stefan-Boltzmann law of blackbody radiation.
In order to maintain the thermodynamic equilibrium in the enclosure, it is necessary for the wall and the medium to emit and absorb equal amounts of radiation, maintaining the radiative heat balance. This implies that, for a given wavelength, the emissivity, defined as the ratio of the emission to the Planck function, is equal to the absorptivity, defined as the ratio of the absorption to incident radiation. The equality between absorptivity and emissivity was first proposed by Kirchhoff in 1859.
Kirchhoff’s law requires the condition of thermodynamic equilibrium, such that uniform temperature and isotropic radiation are achieved. Obviously, the radiation field of the Earth’s atmosphere is not isotropic and its temperature is not uniform. However, in a localized volume below about 40 km, to a good approximation, it may be considered to be locally isotropic with a uniform temperature, in which energy transitions are determined by molecular collisions. It is in the context of this local thermodynamic equilibrium that Kirchhoff’s law is applicable to the atmosphere. For further analysis of this subject, see Goody and Yung (1989).

FIGURE 1.6 Spectra of blackbody emission and absorption by the atmosphere and its constituents. (a) Normalized spectra of blackbody radiation at 6000 K and 255 K; (b) absorption spectra for the entire vertical extent of the atmosphere and (c) for the portion of the atmosphere above 11 km; and (d) absorption spectra for the various atmospheric gases between the top of the atmosphere and the Earth’s surface. CH4, methane; CO2, carbon dioxide; H2O, water; HDO, hydrogen-deuterium oxide (i.e., heavy water); N2O, nitrous oxide; O2, oxygen; O3, ozone; Bλ, blackbody emission at wavelength λ. From Peixoto and Oort (1992).
For example, if the atmosphere were isothermal, these two opposing effects would exactly cancel, as they would do inside a blackbody enclosure with homogeneous and isotropic radiation, thus yielding an upward flux of radiation that would be constant with height. However, if temperature decreases with increasing height, as it does in the troposphere, the accretion of the upward flux due to emission is smaller than its depletion by absorption of the flux from below. Thus, the upward flux decreases with increasing height owing to the difference between emission and absorption in the atmosphere. In short, the atmosphere as a whole traps a substantial fraction of the upward flux of longwave radiation emitted by the Earth’s surface before it reaches the top of the atmosphere. This trapping is often called the atmospheric greenhouse effect.
The atmospheric greenhouse effect is attributable not only to well-mixed greenhouse gases, but also to cloud cover. As will be described in chapter 6, clouds emit and absorb longwave radiation, acting almost as a blackbody if they are sufficiently thick. Clouds account for about 20% of the total greenhouse effect of the atmosphere. But the greenhouse effect of clouds is not the only effect on the Earth’s radiation balance. Clouds also reflect incoming solar radiation because their albedo is higher than that of most underlying surfaces. When evaluated on a global and annual mean basis, the reflection of incoming solar radiation by clouds outweighs their greenhouse effect, and thus clouds exert a net cooling effect upon the heat balance of the planet (e.g., Hartmann, 2016; Ramanathan et al., 1989).
In summary, the atmosphere as a whole absorbs a major fraction of the upward flux of longwave radiation emitted by the Earth’s surface. On the other hand, the atmosphere also emits longwave radiation, and the upward flux from the atmosphere partially compensates for the depletion of the upward flux due to absorption. Since Kirchhoff’s law requires the absorptivity of the atmosphere to be identical to its emissivity at all wavelengths, the absorption of the upward flux emitted by the relatively warm surface is substantially larger than the emission of the upward flux by the relatively cold atmosphere. Thus, the atmosphere has a greenhouse effect that reduces substantially the upward flux of longwave radiation emitted by the Earth’s surface before it reaches the top of the atmosphere, helping to maintain a warm and habitable planet.
Global Warming
So far, we have explained why the atmosphere has a so-called greenhouse effect that traps a substantial fraction of the upward flux of longwave radiation emitted by the Earth’s surface. Here we attempt to explain why temperature increases at the surface and in the troposphere as the concentration of a greenhouse gas (e.g., CO2) increases in the atmosphere.
As described in the preceding section, the effective emission temperature of the Earth is −18.7°C, which is much closer to the global mean temperature of the middle troposphere than that of the Earth’s surface. The effective emission temperature is much lower than the Earth’s surface temperature because a major fraction of longwave radiation emitted by the surface is absorbed before it reaches the top of the atmosphere. On the other hand, much of the upward flux of the longwave radiation emitted by the colder upper troposphere reaches the top of the atmosphere because the absorption by the overlying layers of the atmosphere is small. Thus, the effective emission level of outgoing longwave radiation is located in the middle troposphere, where temperature is much colder than the Earth’s surface.
Using the terminology of quantum mechanics provides another way of visualizing the effect of greenhouse gases on longwave radiative transfer in the atmosphere. If we think of radiation taking the form of photons, the probability of a terrestrial photon escaping from the top of the atmosphere is reduced by the presence of greenhouse gases lying above the level from which that photon is emitted. Thus, photons emitted from the Earth’s surface are much less likely to reach the top of the atmosphere than photons emitted from higher levels in the atmosphere. If we imagine each photon to be “tagged” with the temperature at which it was emitted, the distribution of photons reaching the top of the atmosphere will be centered at a temperature that is much lower than the surface temperature; that is, the effective emission temperature.
If the concentration of a greenhouse gas such as CO2 increases in the atmosphere, the infrared opacity of the air increases, thereby enhancing the absorption of longwave radiation in the atmosphere. Thus the absorption of the upward flux of longwave radiation from the lower layer of the atmosphere is larger than that of the flux from the higher layer, owing mainly to the difference in the optical thickness of the overlying layer of the atmosphere. In other words, more photons from the surface and lower atmosphere will be prevented from reaching the top of the atmosphere. For this reason, the effective height of the layer from which the outgoing longwave radiation originates increases as the atmospheric greenhouse gas concentration increases. Because the effective emission level of the outgoing radiation is located in the troposphere, where temperature decreases with increasing height, the temperature of the effective emission level decreases as it moves upward, thereby reducing the outgoing longwave radiation from the top of the atmosphere.
The physical processes involved in the response of longwave radiation to increasing greenhouse gases are illustrated in figure 1.7. As in figure 1.5, the slanted solid line indicates schematically the vertical temperature profile in the troposphere, where temperature decreases almost linearly with height. Dot A on the slanted line indicates the effective emission level for outgoing longwave radiation from the top of the atmosphere. (In other words, half the photons reaching the top of the atmosphere are emitted from below this level and half from above this level.) As indicated by the arrow that originates from dot A, the emission level moves upward in response to the increase in concentration of an atmospheric greenhouse gas (e.g., CO2), as explained above. Thus the temperature of the effective emission level decreases, reducing the outgoing longwave radiation from the top of the atmosphere.
A change in the concentrations of greenhouse gases (e.g., carbon dioxide and water vapor) affects not only the upward flux of the outgoing longwave radiation from the top of the atmosphere but also the downward flux that reaches the Earth’s surface. If the concentration of atmospheric greenhouse gases increases, the increase in the infrared opacity of the air enhances the absorption of longwave radiation in the atmosphere. Thus, the absorption of the downward flux from the higher layer of the atmosphere increases more than the absorption of the flux from the lower layer. Consequently, there is a downward shift of the effective level of emission from which the downward flux originates as the atmospheric greenhouse-gas concentration increases. Because temperature increases with decreasing height in the troposphere, as indicated by the slanted line in figure 1.7, the temperature at the effective emission level of the downward flux, signified by dot B, also increases as it moves downward, thereby increasing the downward flux of longwave radiation that reaches the Earth’s surface.
The radiative response of the surface-troposphere system to an increase in greenhouse gases can be regarded as the net result of two related processes. The first process involves an increase in the downward flux of longwave radiation that increases the temperature of the Earth’s surface. Over a sufficiently long period of time, the surface returns to the overlying troposphere practically all the radiative energy it receives, with thermal energy being transferred upward through moist and dry convection, longwave radiation, and the large-scale circulation. Thus temperature increases in the troposphere, as well as at the Earth’s surface. If this warming were to occur in the absence of any other changes, it would result in an increase in the outgoing longwave radiation from the top of the atmosphere.
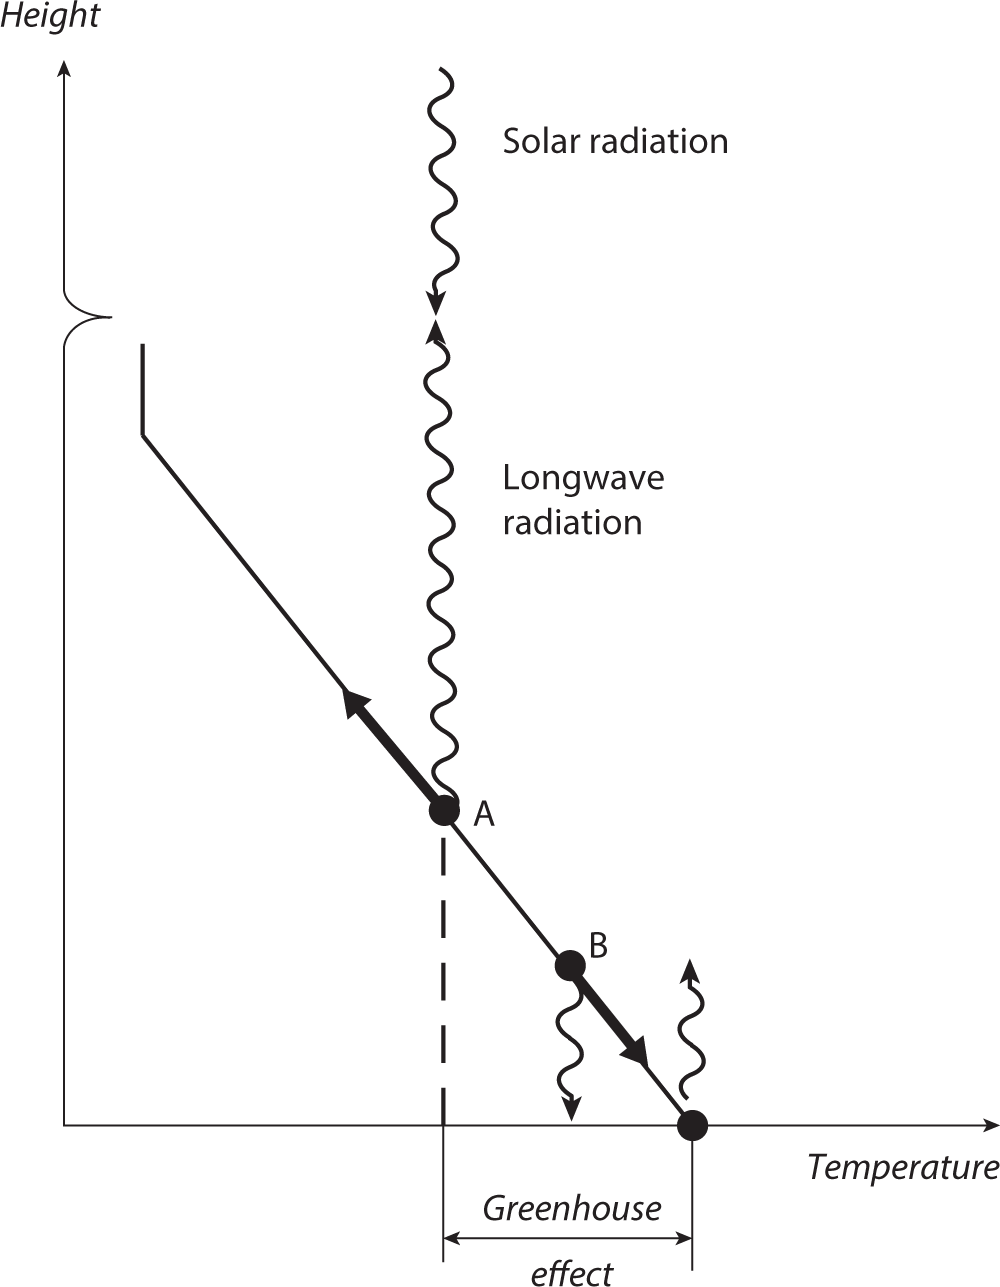
FIGURE 1.7 Schematic diagram illustrating the upward shift of the average height of the layer of emission for the top-of-the-atmosphere flux of longwave radiation (indicated by dot A), in response to the increase in concentration of a greenhouse gas in the atmosphere. The diagram also illustrates the downward shift of the average height of the layer of emission for the downward flux the longwave radiation at the Earth’s surface (indicated by dot B), in response to the increase in concentration of a greenhouse gas. See the caption of figure 1.5 for further details.
The second process involves the upward flux of longwave radiation at the top of the atmosphere in response to an increase in atmospheric greenhouse gas concentration. If the amount of greenhouse gases were to increase without allowing the temperature of the surface-troposphere system to change, the upward flux of longwave radiation at the top of the atmosphere would decrease, as explained earlier. To maintain the radiative heat balance of the planet as a whole, the surface-troposphere system warms just enough for the effects of these two processes to balance, such that the top-of-atmosphere flux of outgoing longwave radiation remains unchanged despite the warming.
An important factor that affects the magnitude of global warming is the positive feedback process that involves water vapor. As noted already, water vapor is the most powerful greenhouse gas in the atmosphere. It absorbs and emits strongly over much of the spectral range of terrestrial longwave radiation (figure 1.6d) and is mainly responsible for the powerful greenhouse effect of the atmosphere. In contrast to long-lived greenhouse gases such as carbon dioxide, water vapor has a short residence time of a few weeks in the atmosphere, where it is added rapidly through evaporation from the Earth’s surface (e.g., from the ocean) and is depleted through condensation and precipitation. Thus, the absolute humidity of air is bounded by saturation, preventing large-scale relative humidity from exceeding 100%. Since the saturation vapor pressure of air increases with increasing temperature according to the Clausius-Clapeyron equation, the absolute humidity of air usually increases with increasing temperature, thereby enhancing the atmospheric greenhouse effect. The positive feedback effect between temperature and the greenhouse effect of the atmosphere is called “water vapor feedback,” and will be discussed further in chapter 6. Water vapor feedback magnifies the global warming that is induced by the increase in long-lived greenhouse gases such as carbon dioxide, methane, nitrous oxide, and CFCs.
Global warming involves other responses of the climate system in addition to the changes in temperature. Because the saturation vapor pressure of air in contact with a wet surface (e.g., ocean) increases at an accelerated pace with increasing surface temperature, according to the Clausius-Clapeyron equation, the warming of the Earth’s surface enhances evaporation from the surface to the overlying troposphere, where relative humidity hardly changes, as will be discussed in subsequent chapters. The global-scale increase in the rate of evaporation in turn increases the rate of precipitation, thereby satisfying the water balance of the atmosphere in the long run. This is the main reason why the global mean rates of evaporation and precipitation increase by equal magnitudes as global warming proceeds, accelerating the pace of the global water cycle, as will be discussed further in chapter 10.
In this chapter, we have explained the processes responsible for the atmospheric greenhouse effect, which is essential for maintaining a warm and habitable climate at the Earth’s surface. We have also explained why temperature increases at the Earth’s surface and the global water cycle accelerates as the concentration of CO2 increases in the atmosphere. In the remainder of this book, we shall introduce various studies exploring the physical mechanisms that control changes in climate, not only during the industrial present, but also during the geologic past. We will introduce these studies in roughly historical order; we begin by introducing the early pioneering studies in the following chapter.