
Brad Williams is a tall, lanky, and slightly awkward economist who rides his bike to work, listens to Willie Nelson on his iPod, and takes long hikes in the woods. Yet for more than twenty years, he had one of the most important jobs in California government: forecasting the state’s economy, as well as its tax collections. His predictions had a profound impact. If he was right, the state had a better chance of closing the year with a balanced budget. If he was off by just a few percentage points, California could wind up with shortfalls of billions of dollars.
Most of the time he was dead right. The Wall Street Journal named him California’s most accurate economic forecaster between 1987 and 1998, beating out economists from the state’s top banks, business groups, and universities.
For his accuracy, Williams credited his deep data dives. Other California economists usually cobbled together their forecasts from standard-issue government data, which were stale by the time they came out, or from national statistics that they then would apply to California.
Williams and his team developed what he called a “structural econometric model,” a computer model involving more than a hundred interdependent factors, including interest rates, salaries, and taxable sales. He constantly refreshed his forecasts with data revisions or new statistics, pulling in numbers from a wider array of sources and running them through his number crunchers.
Once all the models were run, Williams turned to his most reliable tool: his gut instinct. Behind his data-driven exterior, Williams practiced a kind of Zen forecasting, setting aside the numbers and models and meditating on an economic question. He might be sitting at his desk or riding his bike when he would arrive at a view on, say, the California housing market or the future of aerospace wages.
“I’m not beholden to data,” he says. “Data and modeling can give you a structure and a way to think about a problem, but you have to broaden it. Once you look at the data and the models, you try to stand back. There’s a lot of reflection. The data will tell you what impact a decline in the housing sector may have on employment or other parts of the economy. But it won’t tell you whether real estate will fall or rise. That’s where you use reason and judgment. It’s just a lot of thinking.”
In the mid-1990s, however, Williams encountered a problem that even his most intense thinking marathons and computer models couldn’t solve. For decades, California’s economy had moved broadly in line with its tax revenues. If the state’s GDP and employment were growing strongly, so were tax revenues. When times were tough, taxes also went down.
Suddenly, however, the California economy began to split in two. Tax revenues (especially income-tax revenues) began to soar while the broader economy and wages remained flat. Williams’s complex econometric models stopped working, since the usual connections and explanations no longer applied.
“It was like we suddenly had two different states,” Williams said. “We had the California economy and then we had personal income taxes. The traditional economic measures of personal income and employment somehow had become less significant in explaining what was going on in the economy, especially in terms of revenue.” In his more than 20 years of forecasting, he had rarely encountered such a puzzle. He and his team did months of economic sleuthing. They discovered that most of the increase in income taxes was coming from a small group of people making astronomical incomes—some in the hundreds of millions of dollars.
He also discovered that most of those super-earners lived and worked in Silicon Valley, and that most of their incomes were coming from stock sales. Using salary studies and information from the state tax department, he found that the average incomes of the top 20 percent of Californians (households making at least $95,000 in 1998) jumped by nearly 50 percent between 1993 and 1998, while incomes for the rest of the state grew by less than 15 percent. The biggest surge was in capital gains from stock sales. Capital gains realizations tripled between 1990 and 1998, to $60 billion.
On its face, Williams’s discovery seemed like a positive outgrowth of the nascent dot-com boom. Kicked off by Yahoo’s IPO in 1996, and fueled by stock market speculation in a slew of new Internet companies, the dot-com boom created instapreneurs and sudden wealth on a scale that the country hadn’t seen since the railroad boom of the nineteenth century. California was hosting a new gold rush, and the fact that some of the gold dust was raining down on government seemed to confirm the state’s ideal of shared prosperity.
Yet it wasn’t truly shared. And for Williams, the emergence of these “two Californias” had more troubling implications. He had done enough research on tech stocks and financial markets to know that the forces behind the income boom—momentum investing, speculation, paying huge multiples for “eyeballs”—could quickly unwind. California’s economy was becoming less reliant on its traditional pillars of aerospace, agriculture, real estate, and consumer sales, and increasingly reliant on stock market wealth that could vaporize overnight. An economy once built on real things was now built on paper.
In turn, California’s tax revenues were also more volatile, balanced on a tiny sliver of the population. By 1998, the top 1 percent of earners in California were making 20 percent of the income, up from 14 percent in 1993, and paying 41 percent of the state’s personal income taxes—more than the entire bottom 80 percent. While the rich taxpayers of California were small in number, their tax revenues rapidly eclipsed the money from the rest of the economy.
Williams had stumbled onto a problem that could be far more severe than any real estate bust or defense-spending slump. If most of the state’s income-tax revenues were coming from the wealthy, and most of their wealth was coming from fickle stock markets, then California’s revenues could crash with any sudden moves in the stock market.
“It seemed like we created a revenue cliff,” he said.
When and how California’s government would fall off that cliff remained unclear. It all depended on the stock market. So in 1998 and 1999, Brad Williams decided that the entire business of forecasting California’s economy and tax revenues had to change.
To keep doing his job, he needed to reinvent himself. Looking at the wages and salaries for the whole state no longer had as much value. What he really needed to understand was the economy of the paper millionaires in Silicon Valley. He needed to become a plutologist.
So he began poring over SEC filings for Yahoo, Apple, and other California tech giants to better understand the stock holdings and stock sales patterns for the top executives. He followed the companies’ earnings releases and studied models on stock option pricing and volatility.
Since among the rich, stock sales are often discretionary and driven in part by psychology—they might buy on optimism and sell on pessimism, rather than on financial need—Williams tried to better understand the mind-set of the wealthy. He met with financial advisors to the rich, asking them about their clients’ investment plans and planned stock sales.
Yet the advisor meetings, like many of his new research tools, proved to be less reliable than his old methods of forecasting.
“The advisors were usually wrong,” Williams said. “They would tell me, ‘Oh, these guys are going to be selling their stock,’ and then they’d hold on to it. It was very difficult to figure out where these stocks were going or what the wealthy were planning to do with their holdings.”
Williams quickly realized that predicting the stock sales of the rich was largely futile. To accurately forecast the financial future of the rich, he realized, he had to predict the stock market. And that, he noted, “is impossible, as we all know.”
He also realized that the California state government wasn’t responding to his warnings of an impending bust and its consequences. In 2000, he prepared a report for the government with the innocuous title “California’s Changing Income Distribution.” Its message was more dire: most of the state’s income growth—and by extension its tax revenues—was coming from a small group of highfliers with the state’s most unstable incomes.
“The shifting distribution has helped state revenues to surge in the past five years, made revenues more volatile and raised the share of taxes paid by higher-income Californians,” the report said.
He added that capital gains “can fluctuate substantially from one year to the next” and that state tax collections were suddenly “subject to more volatility than in the past.” The report also warned of the political and social implications of “concentrations of economic and political power,” in which “certain individuals can become mired at the low end of the distribution with no easy way of moving up.”
Williams wasn’t the only one noticing the state’s growing dependence on the wealthy, of course. Economists and governors had for years lamented the state’s dependence on its top earners. Yet whenever the volatility issue was raised by the governor or legislatures, it became a political football. Republicans argued that the surest way to reduce a looming budget crash and volatility in state revenues was to lower taxes on the highest earners. Democrats called the volatility issue a red herring, saying the real issue was widening income inequality, which was creating a surge in incomes for the elite and widespread poverty and stagnation for the rest of the state. They preferred to spend the money from the rich while they had it rather than worrying about its end.
“In California government, it seems to be about getting as much as can, when you can and hope that you can keep it,” says Roger Niello, a financial accountant and a Republican former state assemblyman. “People would rather get money now and have it taken away later than not getting it at all.”
Williams wasn’t interested in the political crusade. He was fiercely nonpartisan and more worried about the economic fallout from a crash. In 2001, his worst fears came true. When the dot-com bubble burst and markets froze after the September 11 terrorist attacks, stocks began a long slide that wiped out $4.7 trillion in wealth from U.S. markets.
California found itself in the midst of a trickle-down recession. The dot-com bust and ensuing recession created a mirror image of the boom, with the wealthy leading the crash and dragging tax revenues down with them. The state’s revenue from capital gains plummeted 66 percent, from $17 billion to $6 billion, while personal income taxes fell 32 percent, largely because of declines at the top. By 2002, California had a budget shortfall of more than $20 billion.
Williams didn’t predict the recession. In fact, his budget statement from 2000 was fairly optimistic, calling for “continued growth.” Yet he had identified the risks of high-beta wealth and tried to bring them to the attention of the state’s politicians. And few very people took notice.
“I wouldn’t say they ignored me,” Williams says. “I think they listened, and some of them understood the message. But I just don’t think it was a priority.”
The multibillion-dollar deficit lingered for years. Yet the lessons of the dot-com bust and of Williams’s analysis were quickly forgotten in the state capital. By 2005, California was enjoying another surge in spending fueled by the incomes of the wealthy. In 2004, state revenue collectors received a $200 million check from a single Google executive selling stock, according to state officials. (The check was too big for the state’s collection system, so they asked the filer to break it down into smaller checks).
Williams once again began to sound the alarms. In 2005, he released a report stating that the state’s tax revenues could vary by as much as $12 billion in a single year, and that such swings were “more likely than not.” He wrote that the state tax system had become even more vulnerable after the dot-com bust and that stocks were poised for more radical swings.
“We believe that significant revenue volatility will continue to be a major characteristic of California’s tax system, absent major policy changes to the tax system’s structure,” he wrote.
This time he offered potential fixes, which fell into two broad categories: fixing the tax structure to make it less volatile, or putting in place better planning tools to manage the volatility.
The way California’s government worked at the time was that the state would treat each year’s windfall from the rich as a recurring income stream, allocating the money to long-term programs in education, health care, pensions or other areas. When the revenues from the rich dried up, the spending continued, leading to multibillion-dollar budget shortfalls.
Williams’s first approach involved broadening the tax base. This could be done by lowering the tax rate on capital gains, making the tax code less progressive, increasing other kinds of taxes (such as the sales tax) to reduce the role of income taxes, or using income averaging, which would spread out tax payments more evenly out over multiple years.
For the second approach, Williams suggested that the state set aside more money during booms for a rainy-day fund. The state had long had such a fund, but it was never large enough to offset recessions. He also recommended that the state spend the biggest windfalls on onetime projects such as roads, bridges, or paying down debt, so the state would avoid long-term commitments it couldn’t meet.
“The message was, ‘Hey, we’ve got a real problem here in California, and if we want to try to solve it, here are some choices,’ ” he said. “I wasn’t telling them what to do. But at least they had some choices.”
The state legislators, however, weren’t interested. Democratic leaders in the legislature were loath to lower taxes on the wealthy, especially with the middle class eroding and the rich getting richer and earning more and more of the income growth. Republicans often wanted to lower taxes or return any excess money to the taxpayers.
As the money rolled in throughout the 2000s—from tech companies, the real estate boom, and finance—it was committed to long-term government programs. The state’s dependence on the paper millionaires continued to grow. By 2007, the top 1 percent of California’s taxpayers were back to earning 25 percent of all income and paying 48 percent of the state’s income taxes.
By 2007, Williams was growing increasingly frustrated with state government.
“I was like a broken record,” he said. “You can only keep saying the same thing so many times before you just get tired of it.”
He was also becoming disenchanted with the whole notion of forecasting the state economy and revenues. In the 1980s and early 1990s, he’d been able to rely on the beautiful certainty of numbers: state wage data, employment revisions, average salary increases. But being a plutologist meant the impossible task of predicting the stock market and the minds of millionaires.
In 2007, he decided to retire. Two years later, the real estate bust and financial crisis wiped out half the value of the stock market, and the incomes of the rich fell by three times as much as those of the rest of the country. California suffered a tax crash that was even worse than the dot-com bust. By 2011, the state was racing to cut costs to fill a $26 billion budget hole.
On a sunny spring day in 2011, Williams is walking through the wood-paneled halls of the state capitol. He looks relaxed and cheery in a blue blazer and open collar. Yet the mood in the capitol is grim. A crowd of protestors has gathered in a hallway to protest cuts to state-supported business districts. They wear buttons and hats that say “Save Jobs.” There are protests almost every day from similar groups, battling cuts in everything from health care and education to pensions.
Williams now works for a consulting firm that advises companies or institutions on the state budget process. Business is brisk, he says, since so many people and institutions have a stake in the cuts.
“It’s very sad what’s happening,” Williams says as he winds his way through the crowds. “The sad thing is that even with all these cuts, the state hasn’t really solved the real problem, which is the volatility.”
As we exit the building and step out into the morning sunshine, I ask him if he feels any satisfaction in having predicted the problems stemming from California’s wealth addiction.
“Maybe I should,” he said. “But with this issue, there was no real pleasure in being right.”
Just as they’ve taken over the consumer economy with their outsize incomes, spending, and wealth, America’s millionaires are also becoming the dominant funders of the federal and state governments.
The top 1 percent of Americans now earn 20 percent of the nation’s income and pay more than 38 percent of its federal income taxes. For many state governments, their share is even higher. In New Jersey, the top 1 percent of earners paid 40 percent of incomes taxes in 2008. In New York, the top 1 percent pay about 42 percent, with Wall Street and the financial services business accounting for more than 20 percent of all state wages. In Connecticut, residents making more than $1 million a year (near the top half of the top 1 percent) accounted for more than a quarter of the state’s income and income taxes.
Part of the increase is due to higher tax rates on the wealthy over the past decade. New York, California, Maryland, New Jersey, and other states have raised the top tax rates or created special “millionaire” taxes to boost revenue.
The bulk of the increase, however, is driven by the growing share of national income going to the top 1 percent. The top 1 percent of earners in the United States accounted for 20 percent of income in 2008, more than double their share in the “magic year” of 1982. In California, the top 1 percent accounted for a quarter of all state income, up from 14 percent in 1993. Even in states with flat taxes, where everyone pays the same income tax rate regardless of income, the wealthy now pay a higher share of taxes. Illinois has long had a 3 percent income tax rate regardless of income. Yet taxpayers making more than $500,000 now pay 30 percent of all income taxes, up from an inflation-adjusted 18 percent in 1995.
If America has become a land of representation without taxation, with the bottom 40 percent paying little or no federal income taxes, it’s largely because so many Americans are now underrepresented in the country’s income pyramid. More and more of the government’s finances now rest on the very top of that pyramid, creating frequent swings and falls. In New York, the top 1 percent of taxpayers contribute more to the state’s year-to-year tax volatility than all the other taxpayers combined. In a report downgrading New Jersey’s credit rating in 2011, Standard and Poor’s stated that New Jersey’s wealth “translates into a high ability to pay taxes but might also contribute to potential revenue volatility.”
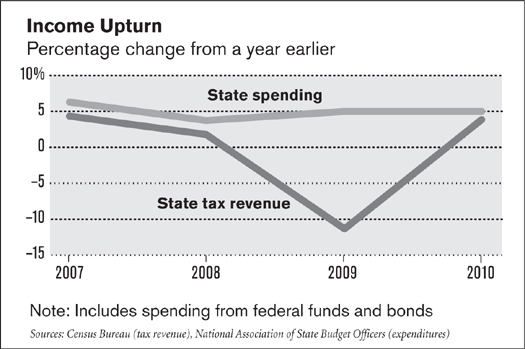
The problems are most noticeable at the state level, since the states are required to balance their budgets. State budget problems after the 2008 recession sparked a wave of public protest in Wisconsin, New Jersey, New York, and California, as well as mass layoffs of teachers, firefighters, police, and other public servants. Republicans blame runaway spending, public employee pensions, and unions. Democrats blame excessive tax cuts for the rich. Yet as you can see from the table below, the trouble with state budgets is a drop in revenue, not of a sudden rise in spending. And in many states, that drop was caused by the falling incomes of the rich.
Tax experts say the problems of high-beta government are likely to spread to Washington as the growing income gap widens and wealth becomes more unstable.
“These revenues have a narcotic effect on legislatures,” said Greg Torres, president of MassINC, a nonpartisan think tank that’s researched tax revenues from the wealthy. “They become numb to the trend and think the revenue picture is improving, but they don’t realize the money is ephemeral.”
The question is, how can states and governments around the world kick their high-beta wealth habit without making inequality even worse?
Roger Niello knows both sides of the high-beta government problem. His family owns Niello Auto Group, one of the largest car dealership groups around Sacramento, which sells luxury brands such as Porsche, Maserati, Land Rover, and Jaguar. During the good times, the dealerships throw off mountains of cash, putting Niello comfortably among the top 1 percent of taxpayers in the state, he says.
Yet in 2009, luxury car sales ground to a halt, and Niello’s family income fell by more than half. “I’m still fine financially, you don’t need to worry about me,” he jokes, sitting in a small office near Sacramento in a plaid shirt and jeans. “But we took a big hit.”
His knowledge of things rich has also led him to focus on the dangers of California’s tax code when he was in the state assembly between 2004 and 2010 (he left because of the state’s term limit of six years). While on the budget committee, Niello studied Brad Williams’s research and became an advocate of trying to reduce income-tax volatility. As a moderate Republican, however, he frustrated both die-hard conservatives and left-leaning Democrats.
Niello helped push a ballot initiative that would have helped create a stronger rainy-day fund for California. The initiative would have increased the mandatory deposits into the fund, raised its maximum limit, and restricted how the fund could be spent. It also allowed half the payments into the fund to be used for one-time projects or debt payments. Under the plan, the state would create a baseline growth target, based on long-term historical trends, and use all revenues above that trend line for the fund.
The initiative, however, died at the ballot box. Democrats opposed putting a cap on spending, while Republicans opposed an extension of a tax hike that was attached to the measure.
“It was a rare moment when both the extreme right and extreme left came together to oppose something,” one state senator told me.
A special tax commission set up by former governor Arnold Schwarzenegger to overhaul the tax system also tried to tackle the volatility problem. “The boom-and-bust economic cycles the current tax system depends on have turned our state budgeting system into an unpredictable roller-coaster ride that brings windfalls one year and deficits the next,” Schwarzenegger said.
The commission recommended lowering tax rates for everyone, eliminating the corporate tax and sales tax, creating a new tax on business receipts, and building a stronger rainy-day fund. The recommendations were rejected by many in the legislature, especially by Democrats. Some even lampooned the fears over volatility and the commission’s recommendations. California state senator Noreen Evans wrote a blog post in 2009 titled “The Volatility Monster—Be Afraid, Be Very Afraid.”
The Commission and governor suggest that the source of our budget woes is a sinister monster called—(cue scary music)—“revenue volatility.” As their story goes, if we slay the revenue volatility monster all our budget problems will disappear. So we have no choice but to give very rich people jaw-dropping tax cuts.
Here is the real volatility problem. Very rich people pay a lot of income taxes when they make lots of money in good economic years. Their income taxes go down in recessions because they earn less money. Equity markets, stock options, bonuses, and capital gains depend upon the health of the economy, and with the economy, are volatile. As a result of accumulation of income in a few hands, the state collects more in income taxes because our personal income tax is progressive.
The true response to solving the volatility problem is to make sure Californians are fully employed and decently paid. The Commission proposes reducing PIT (personal income tax) revenues under the fig leaf of stabilizing revenues. Using this logic, if California just stopped collecting taxes, the problem of volatility would be solved forever.
What may sound like yet another tired debate between the tax-the-rich left and anti-tax right may, however, be more of a side effect of more recent changes in wealth. Ajay Kapur, the plutonomy strategist, said the plutonomy creates an inherent imbalance in government, with a small group of rich plutonomists funding most of the government, while a great mass of non-plutonomists vanish in the income distribution and tax base.
The masses at the bottom require increased funding for entitlements and social programs. But those at the top, who are increasingly paying for those programs, will exert an outsize influence on politicians through their money and will lobby for lower tax rates. The result is that governments will have more booms and busts and permanent deficits, Kapur says.
“It’s fascinating when you think about it, because on the one hand you have this large fraction of the population that doesn’t pay any federal income tax but has all these demands for goodies,” he said. “Then you have the plutonomists, who will protect their turf and taxes so the taxes they pay will never be enough to meet everyone else’s demand. The conclusion is that budget deficits are biased toward getting bigger and bigger. Either you’ve got to cut down the demands of the population, which is very tough in a democracy. Or you have to raise revenues to pay for it. That’s not happening either. This problem and the problem of volatility appear to be a manifestation of the plutonomy and democracy.”
If government dependence on the rich is permanent and permanently unstable, is there anything governments can do?
The best hope, it seems, are people such as Brad Williams. A similar perspective comes from New York State’s current budget director, Robert Megna, who has been fixated on taxes from the rich for more than a decade, after he realized that Wall Streeters were paying more and more of the state’s taxes. Yet rather than trying to change the tax code or reduce taxes on bankers, Megna concentrated on using forecasts as a better planning tool.
He has a team of economists, for instance, that study pay on Wall Street to predict their pay. They look at quarterly earnings reports for Goldman Sachs, Morgan Stanley, JPMorgan Chase, and others and study how much the banks are setting aside each quarter for pay so that state forecasters aren’t caught by surprise at the end of the year. “There’s no getting around the fact that we are now very dependent on a relatively small slice of taxpayers, and that slice moves up and down a lot given economic conditions,” he says.
Megna’s most effective strategy is managing politics by managing economic expectations. When Wall Street has a blowout year and income tax revenues are up, say by 10 percent, Megna predicts the next year at about 5 percent. The state could still wind up with what Brad Williams called a “revenue cliff.” But the cliff will be half the size. “What you really have to do is discipline yourself and the process to say, ‘Hey, based on historical averages, we’re not going to have another year like last one.’ The key is to be conservative in the estimates.”
Of course, boom periods usually drag on longer than expected, so eventually “you could grow at 10 percent for two or three years and people say we’re too conservative.”
In the end, however, Megna admits he couldn’t hedge against the recessions of 2001 or 2009, or predict that a hedge fund manager who made $1 billion one year and paid more than $100 million in state taxes may pay nothing the next year. “Just because you can understand the volatility doesn’t mean you can predict it,” he says. While being miserly with the economic forecasts can help, ultimately the states and Washington will just have to start learning to live with the extreme ups and downs that come from relying on the rich.
“It’s a curse and a blessing,” Megna says. “Look, we’re glad to have wealthy individuals who pay a significant fraction of our revenues, and we want to encourage those people to stay in New York and remain prosperous. It’s a good thing to have [these wealthy taxpayers],” Megna said. “But you have to recognize that because you have them, you also have this extreme volatility. This is a new phenomenon for us, but sooner or later, everyone’s going to have to deal with it.”