![]()
Chapter 37: How To Prepare the Monthly Audit and Cost Projections
The following sections will prepare the restaurant manager for closing, projecting, and analyzing the expenditure and sales records established during the month. The preceding chapters have described in detail how to set up, operate, and manage a profitable restaurant. This chapter will go through the procedures for projecting the actual costs for each category so that the budget may be completed and analyzed for possible cost problem areas. The completed budget and abbreviated profit and loss statement will be a measure of how effectively management operated the restaurant during the month.
The procedures described in the following sections are fundamental accounting procedures. Although the procedures are fundamental in nature, great care must be taken when compiling and processing the information to ensure complete accuracy. Management will be basing its decisions upon the statistics provided in these reports. Inaccurate information will ultimately result in faulty decisions.
The individuals collecting and utilizing the various data should be familiar with the restaurant’s operations and the various internal control systems. All calculations should be double-checked by another employee prior to being used in the cost projections. Calculators with printed tapes should always be used so that column totals may be verified.
The general manager must take an active part in the end-of-the-month closeout. His participation will serve two purposes:
1. It will ensure that the closeout procedures are correctly carried out.
2. The computations will be much easier for the manager to recall and hold more meaning in the day-to-day operations.
The most common error made in the end-of-month closeout is carelessness. Attention to detail and proper management involvement will eliminate most errors. Countless hours of extra work for the internal bookkeeper, manager, and public accountant can easily be avoided simply by taking a little more time to ensure all business and accounting papers are handled correctly.
For the purposes described in this book, the accounting period, or cycle, begins on the first day of each month and ends on the last day, regardless of the actual number of days in the month. At the end of the month all the sales and expense accounts will be closed out and balanced. The ending inventory, the computation of which will be described in an upcoming section, will be taken on the last day of the month after the close of business. This month’s ending inventory will be the new beginning inventory for next month.
DEFINING THE ACCOUNTING PERIOD
As noted in Chapter 35, “Internal Bookkeeping,” it is imperative that all expenses be entered into the Purchase Ledger for the month in which they were received. The expenses must be entered in this manner regardless of when the restaurant was billed for the items.
Adjustments will be necessary to accurately record prepaid accounts — such as insurances and magazine subscriptions — to ensure the expense is entered into the budget during the month the expense is incurred. Most of these adjustments may be computed during the budgeting process.
Certain expenditures — such as the telephone and utilities bills — might not be received until five to six working days after the end of the month. Since the bank statement and suppliers’ monthly statements will arrive during the first week of the month, it is recommended that the final profit and loss statement not be prepared until the 7th or 15th of the following month. It allows time for the bank statement to be reconciled, unrecorded expenses to be entered into the Purchase Ledger, and any necessary final adjustments to be included. Although the profit and loss statement will not be published until the middle of the next month, the ending inventories and most costs will be projected on the first of the month.
MONTHLY AUDIT PROCEDURES
On the last day of the month:
1. Gather the completed inventory forms for food, liquor, wine, and operational supplies.
2. Using current invoices and past inventories, cost out the Inventory Form. The unit cost (or price) entered on the Inventory Form must correspond to the item and unit in the actual inventory. Correct prices are ensured by continual evaluation of invoices and/or contact with the suppliers. Review the section on the beginning inventory in Chapter 8, “Profitable Menu Planning.”
3. Ensure that the employees organize and clean the storage areas and walk-ins, so that the ending inventory may easily be taken the following morning. Combine all containers and bottles. Organize and label all shelves.
4. Schedule the bookkeeper and the employees involved in taking the physical inventory— the assistant manager, kitchen director, bar manager, and general manager — to arrive prior to the start of business on the first of the month.
5. Schedule the preparation cooks to arrive an hour after the inventory crew so that you may inventory the food areas without disturbing them.
On the following morning, the first of the month:
6. The bookkeeper should arrive as early as possible in order to complete all of his work prior to management’s completion of the inventory:
A. Reconcile and record all the transactions from the previous day, as usual.
B. Enter the information on the Daily Sales Report Form. Total, double-check, and verify all the columns.
C. From the employee time cards complete, total, double-check, and verify the Labor Analysis Form.
D. Ensure that all purchases are recorded in the Purchase Ledger. Complete, total, double-check, and verify the Purchase Ledger for each company. Total the purchases in each expenditure category: food, liquor, wine, and each individual operational category.
Ensure that all paid-outs entered on the Cashier’s and Bartender’s Reports have been posted into the appropriate Purchase Ledger categories. Total the cash paid-outs. Add this figure into the purchase total for each expense category.
COMPUTING THE ENDING INVENTORY
PURPOSE
An ending inventory is taken for a complete and accurate count of the stock and materials on hand for each cost category (food, liquor, wine, and operational supplies) so that the unused amount may be used in projecting the total cost for each category.
PROCEDURE
1. Use pencils, scales, scratch pads, and a clipboard and be accurate. Liquor should be weighed on a liquor scale.
2. Two people should take the inventory. One will count while the other writes. The person counting states each item, its unit, and its total amount. The other employee enters the figure on the inventory sheet on the correct line. If there is only a part of the item, estimate how much on a scale from 0.1 to 0.9 (0.5 being half of a container). Make sure there is a figure on either side of the decimal point (e.g., 0.5, 3.0).
3. Count shelves all the way across. Do not jump around.
4. Put a zero in columns where there is no item to be counted.
5. Convert all items that are in prepared form into pound and unit costs. Example: 15 fish dinners at 12.5 oz. = 11.72 lbs.
6. For multiple weights or numbers of items, use a separate pad and double-check the entries.
7. Make sure there is an entry for every item.
8. Complete each area before moving on to a new one. Check for blanks and possible mistakes.
9. When estimates must be made, they should be made with sound reasoning, not idle guessing.
EXTENDING THE INVENTORY
1. Add the amount of each item counted and enter the figure in the “Total” column.
2. Multiply each item total by the unit price to compute the extended total. Double-check the figures. Add the total amount of the extended column to compute the page total. Double-check every figure.
3. Add the page totals to compute the total for each category. Exchange papers with each other to double-check all figures again. Save the calculator tapes and staple them onto the front of the inventories.
4. All extension columns should have a figure or a zero to ensure the item was considered.
PROJECTING COSTS
From the previous sections you will need:
A. The completed Daily Sales Reports.
B. The completed Purchase Ledgers.
C. The beginning inventory amounts.
D. From the inventory just completed, the total ending inventory amounts.
E. The Operational Supplies Cost Projection Forms.
Step 1. From the Daily Sales Report:
1. Enter total food sales less tax on the “Food Sales” line of the Materials Cost Projection Form.
2. Enter total wine sales less tax on the “Wine Sales” line of the Materials Cost Projection Form.
3. Enter total liquor sales less tax on the “Liquor Sales” line of the Materials Cost Projection Form.
4. Enter total sales (food plus liquor plus wine sales less tax) on each sales line of the Operational Supplies Cost Projection Form.
5. Double-check the complimentary and manager charge columns for food, liquor, and wine. Multiply the food total by .50 and place this figure on the “Food Comp/Manager” line on the Materials Cost Projection Form.
6. Multiply the wine comp/manager total by 0.40 and place this figure on the “Wine Comp/Manager” line on the Materials Cost Projection Form.
7. Multiply the liquor comp/manager total by 0.25 and place this figure on the “Liquor Comp/Manager” line on the Materials Cost Projection Form.
In essence, through these actions (5, 6, and 7) you are taking a credit in the cost projections for products that you have received no revenue, even though the items were perfectly acceptable to be sold. The products were given away to promote business or as a benefit to the manager and owners. Multiplying the total comp/manager sales recorded by the estimated cost percentage results in an estimated cost for these benefits. It will more than cover the costs if the food cost averages 40 percent; wine, 33 percent; and liquor, 22 percent. There is no credit taken for housed products — items that were improperly handled and, therefore, had to be discarded.
Step 2. From the Purchase Ledger:
Enter the total purchases including cash paid-outs for each category on the Materials Cost Projection Form. Enter the purchases for each operational supply category in the appropriate “Projection” column on the Operational Supplies Cost Projection Form. Keep in mind that each expense category must be projected separately. For each operational supply category to have a separate “Projection” column, additional Operational Supplies Cost Projection Forms will need to be copied. There is a space provided above each projection for the category’s name and code number.
Step 3.
Enter the beginning inventory dollar amount (last month’s ending inventory) for each category on the appropriate line of the cost projection sheets. For new restaurants, the first month’s beginning inventory amounts would have been computed when the inventory sheets were initially set up. Once the original beginning inventory is computed, it need not be calculated again since the previous month’s ending inventory amount will be the following month’s beginning inventory amount.
Step 4.
Enter the ending inventory amount (just computed by taking the inventory) for each category on the “Ending Inventory Amount” line on both cost projection forms.
COMPUTING THE COST AND PERCENTAGE FIGURE FOR EACH CATEGORY
Add: beginning inventory (+) purchases and paid-outs (+)
Subtract: comp/manager (–) ending inventory (–)
This will equal the cost of sales for each category.
Cost of sales, divided by sales, equals the percentage of cost.
If the figure seems incorrect:
• Check mathematics on projection sheet.
• Check ending inventory for mistakes (counting, extending).
• Check all mathematics from the beginning.
If costs seem too high:
• Go over Purchase Ledger, sales, invoices, credits, and totals.
• Check purchases recorded but not inventoried.
• Check for incorrect beginning inventory.
If costs seem too low:
• Check items inventoried but not on the Purchase Ledger.
• Check for incorrect beginning inventory.
COMPLETING THE BUDGET
Once the cost projections are computed, the operating budget may be completed and the net pre-tax profit calculated.
1. Enter the total sales and sales breakdown in the “Actual” column of the operating budget.
2. From the cost projection forms, enter the actual cost of each category onto the budget.
3. Subtract the total material costs from the total sales to determine gross profit.
4. From the Labor Analysis Form, enter the total labor costs and cost breakdowns.
5. Office supplies may be actually projected, but will require a lengthy inventory, so an estimate may be used.
6. The uniform expense will vary depending upon the state in which you reside. Some states require the restaurant to provide uniforms, whereas others allow the restaurant to charge the employees for them.
7. “Service Expenses” is the total amount recorded in the Purchase Ledger plus any additional invoices.
8. The fixed operating expenses should remain constant. The monthly accumulated depreciation may vary when new assets are purchased during the month and the depreciation expense is prorated.
9. General operating costs. Labor taxes may be computed by multiplying the total labor cost for the month by the sum of:
A. The current employer’s Social Security contribution, plus
B. The state unemployment compensation rate, plus
C. The federal unemployment compensation rate, plus
D. Any miscellaneous payroll taxes. Sales tax collected is not an expense and should not appear on the budget. In essence, the proprietor is acting as an agent for the state — providing a collection service.
10. Other general operating expenses may be computed by totaling the Purchase Ledger for each category plus any additional invoices.
11. Total all expenses and enter this figure in the “Total Expenditure” column. The total net pre-tax profit is computed by subtracting total expenditures from total sales.
ANALYZING THE COMPLETED BUDGET
A comparison analysis of the current budget against past operating budgets is the best way to identify cost problem areas. The goal of management is for the restaurant to operate consistently in all ways: consistent food products, service and cost percentages, and net profits. When striving to identify cost over-runs, examine the operating budget’s costs against those of previous months and past years for the same month. The important figure to regard when computing the budget is not the actual dollar amount at cost, but the percentage of cost in relation to sales.
Examine budgeted and actual sales closely. Is the sales level as high as anticipated and needed? Are customer counts increasing or decreasing when compared to previous months and last year? Why? Without a sufficient level of sales, the restaurant will ultimately fail, as sales will eventually not meet the fixed costs necessary to maintain the operation.
Concentrate all efforts on increasing sales. Advertise, develop promotional programs, make menu changes, do whatever is required to locate the problem, resolve it, and increase sales. Before looking to the outside for answers to this problem, take a good, hard look at the entire operation. Make certain all areas of the restaurant are operating properly and that all internal controls previously described throughout this book are enforced, being adhered to, and working.
VARIATIONS IN GROSS PROFIT
Changes in gross profit from month to month may be due to any one, or a combination, of the following variables:
• Changes in sales caused by a change in selling price.
• Changes in cost of goods sold caused by changes in materials costs and/or changes in volume of goods sold.
• Sales volume changes, which may be further analyzed into a change in the final sales volume.
For an illustration of this point, consider the following example:
Assume a restaurant serves only two products:
1. Shrimp, with a total food cost of $5 and a selling price of $10.
2. Chicken breast, with a total food cost of $2.50 and a selling price of $8.50.
|
MONTH 1 (1,000 Entrees Sold) 100 Chicken Breasts Total Items Sold = 1,000 |
Now examine the second month with the reverse sales mix:
|
MONTH 2 (1,000 Entrees Sold) 100 Shrimp Dinners Total Items Sold = 1,000 |
In this simplified example, you can clearly see the effect the weighted average sales have on food cost percentages. This example will also apply to liquor and wine cost percentages under similar circumstances.
POSSIBLE FOOD COST PROBLEM AREAS
1. No balance of high- and low-cost items on the menu.
2 No consideration of locally obtainable products.
3 No competitive purchasing plan.
4. Theft in any form.
5. Purchasing more than needed (spoilage).
6. No daily check of invoices, quality, and prices.
7. Improper rotation procedures.
8. No perpetual inventory.
9. No controls on issuing items from storage areas.
10. Low yields on products.
11. Over-preparing (waste, spoilage).
12. Not using or following exact recipes.
13 Not following exact portion sizes.
14. Improper handling (wrapping, rotating, storing).
15. No reconciliation of dinners sold versus dinners consumed.
16. Employee theft.
COMPUTING THE ACTUAL YIELD OVER A SPECIFIED PERIOD OF TIME
Add: beginning inventory (lbs.) (+) purchases for period (lbs.) (+)
Subtract: ending inventory (lbs.) (–)
Multiply the total by 16. This is the total ounces used.
From the itemized cooks sheets, compute the number of dinners sold using this particular product.
Multiply the number of dinners sold by portion size to compute ounces sold.
Divide ounces used by ounces sold, giving the actual yield percentage. It is a check of the yields projected by the kitchen director and shows the actual yield percentage of raw products sold.
FOOD COST PERCENTAGE
This basic ratio is often misinterpreted because it is calculated in so many different ways. It is food cost divided by food sales. Whether your food cost is determined by food sold or consumed is a crucial difference. Also, for your food cost percentage to be accurate, a month-end inventory must be taken. Without this figure, your food cost statement is inaccurate and basically useless because inventory will vary month-to-month — even in the most stable environment.
|
Food cost of sales calculation Beginning Inventory + $5,000.00 Purchases + 100,000.00 Total = $105,000.00 Ending Inventory - 35,000.00 Food Used = 70,000.00 * Employee meals, comp food, manager – 3,000.00 Cost of Food $67,000.00 Divide the cost of food by the Food Sales. Food Sales $175,000.00 Food Cost Percentage 38.28% * Employee meals, complimentary food, and manager-consumed food are removed from the food cost equation as these costs should be reclassified on the P&L. Employee meals are an employee benefit, complimentary meals are considered promotional costs, and manager meals are a management benefit. |
Distinguishing between food sold and consumed is important. All food consumed is not sold. Food consumed includes all food used, sold, wasted, stolen, or given away to customers and employees. Food sold is determined by subtracting all food bought (at full price) from the total food consumed. See the above example.
WEIGHTED FOOD COST PERCENTAGE
Once your food cost is calculated, a weighted food cost percentage must be determined. A weighted food cost percentage will tell you what your food cost should have been had all procedures and controls in place operated at 100 percent efficiency.
On the following page, I have summarized sales information from the restaurant’s POS system or from other bookkeeping records. What you are doing is recreating the food cost for each item based on the standard recipe costs to determine what your food cost and food cost percentage should have been. For this example assume that only four menu items are served in this restaurant. From this example you can see that $7,000 in food costs have slipped away (assuming all calculations are accurate). The restaurant should have had a 34.28 food cost percentage.
|
MENU ITEM |
COST PER MEAL |
# OF MEALS SERVED |
COST PER MENU ITEM |
|
Chicken Kiev |
$5.00 |
2,000 |
$10,000.00 |
|
Steak Oscar |
$8.00 |
4,000 |
$32,000.00 |
|
Stuffed Flounder |
$9.00 |
1,000 |
$9,000.00 |
|
Hamburger Platter |
$3.00 |
3,000 |
$9,000.00 |
|
Weighted Total Cost $60,000.00 Actual Sales $175,000.00 Weighted Food Cost Percentage 34.28% Variation Over Actual Food Cost Percentage 4% (or $7,000.00) |
|||
DAILY FOOD COST ANALYSIS
Traditionally, the food cost of sales is calculated once a month. Yet, you can compute a daily food cost and a daily weighted food cost to analyze problem areas. Much of the inventory counting can be eliminated by moving only the products used for production into the kitchen at the beginning of the shift to pinpoint problem areas or possible problem employees or shifts. You can also calculate a separate food cost for breakfast or lunch.
BUDGETING & PROFIT PLANNING
BREAKEVEN ANALYSIS
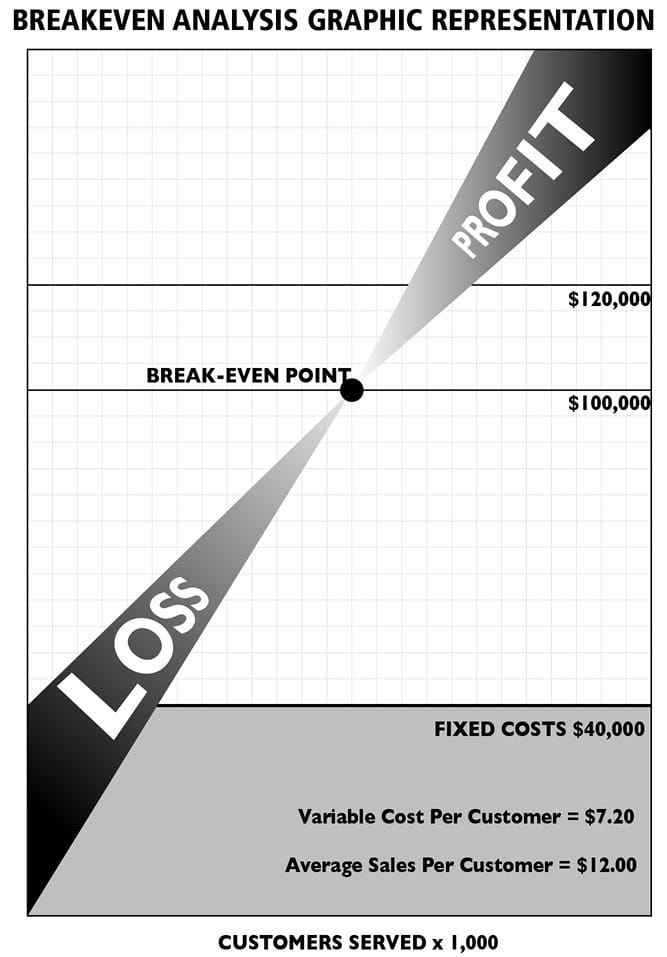
Breakeven analysis is a simple and useful accounting tool for the restaurant manager. An understanding of breakeven analysis will aid the restaurant manager in budgeting, profit planning, expansion decisions, and pricing decisions. The breakeven point is the point where the total sales minus the total costs equals zero. Total sales may also be regarded as the customer count times the average check amount.
All costs may be broken down into three major categories:
1. Fixed Costs. The costs that remain the same regardless of a change in sales or production. Fixed costs remain constant at all possible levels of sales. Examples of fixed costs are: depreciation, insurance, and property taxes.
2. Variable Costs. The costs that change in direct proportion to a change in the level of sales or production. Examples of variable costs are: food, liquor, and wine material costs.
3. Semi-variable costs. The costs that contain properties of fixed and variable costs. An example of semi-variable cost is telephone expense. A fixed monthly service charge will be billed to the restaurant regardless of use. When sales are increased, more long distance phone calls will be made to suppliers. This additional use of the telephone for toll charges is the variable cost.
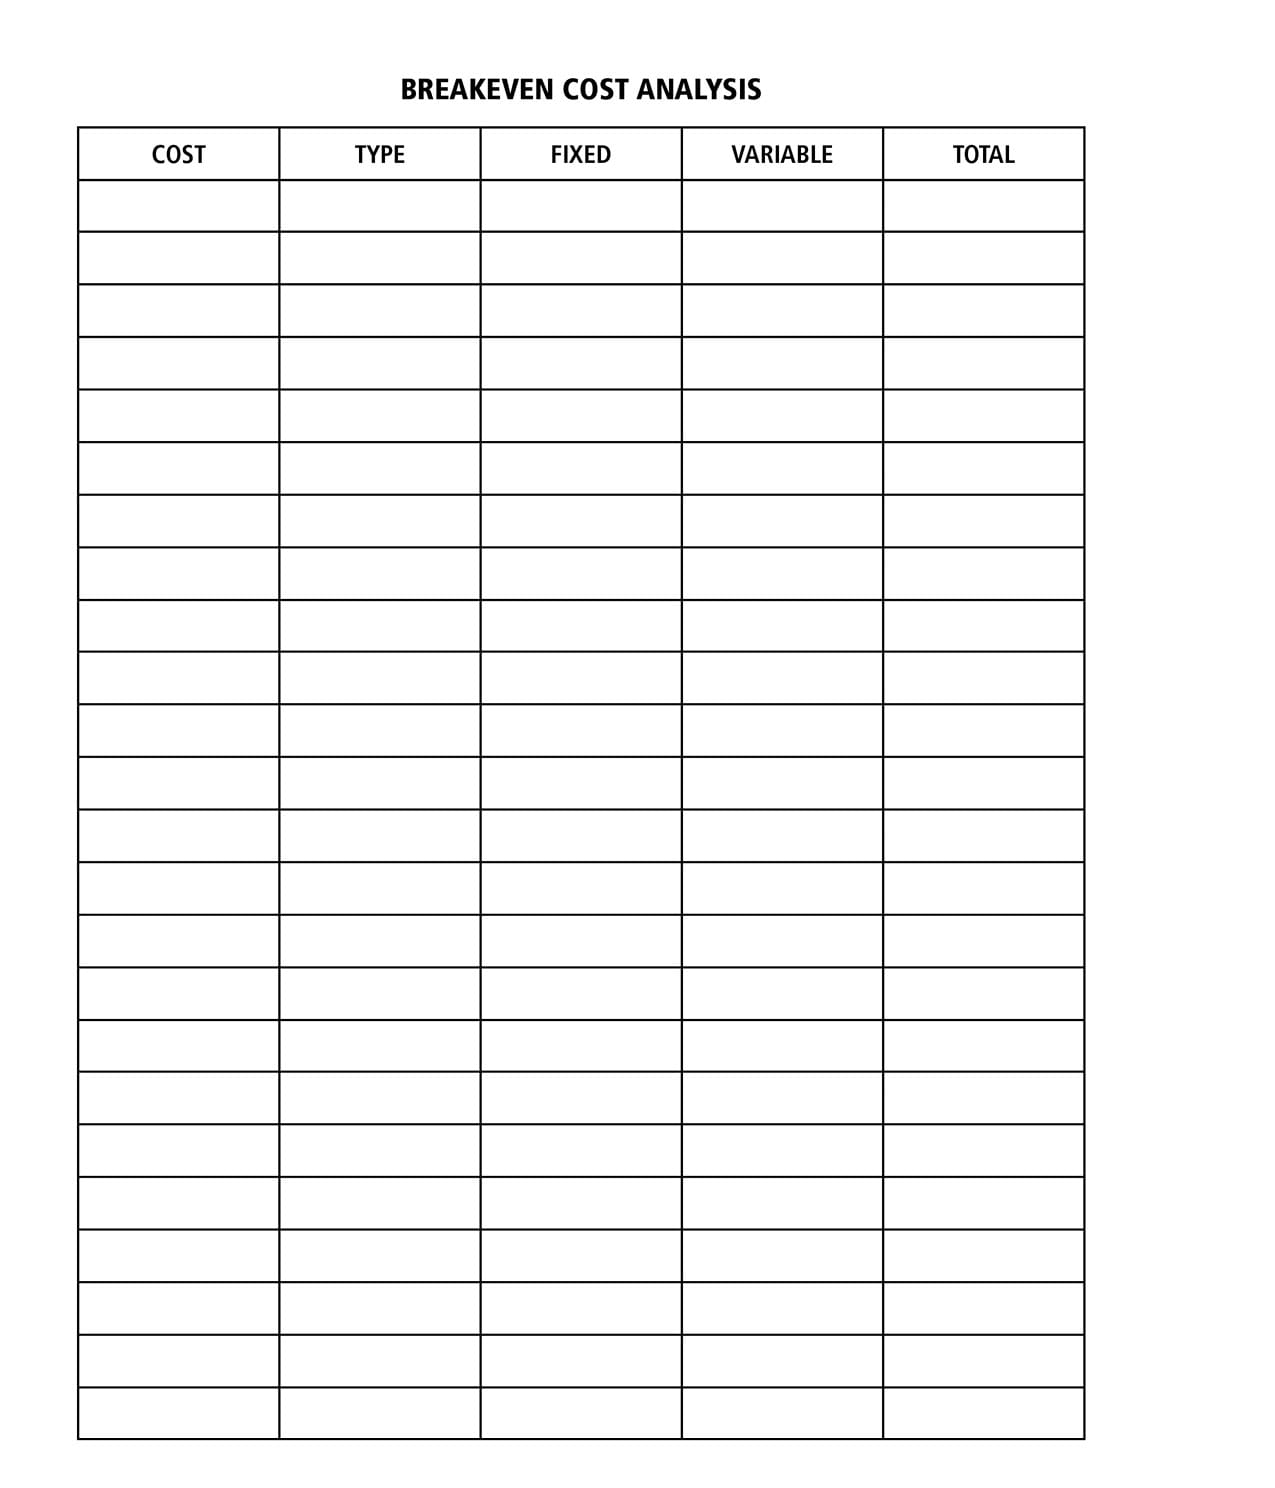
The first step in computing the break-even point is to separate the semi-variable cost into its two components. Using the Breakeven Cost Analysis Form and the completed budget, break up each semi-variable cost into its variable and fixed amounts. Enter the full amounts of each of these expenditures in the appropriate column. Some semi-variable costs may be difficult to precisely break down into either a fixed or variable amount. If so, estimate the figures.
Although the total expense must remain the same, using the telephone expenditure example, the monthly service charge would be entered in the fixed column and toll charges would be entered in the variable column. The total bill remains the same. To better visualize the concept of breakeven analysis, view the graph at the end of this chapter. Note that the fixed costs are $40,000, total sales are $100,000, and the variable cost per customer is $7.20. The breakeven point occurs at $8,333. The average sale per customer is $12.
$100,000 - $40,000 = $60,000/$7.20 = $8,333
Total Sales - Fixed Costs = Variable Costs divided by the Variable Cost per Customer.
Total Sales = Customer Count x Average per Head Sales.
Note that as sales increase, the profit margin percentage will substantially increase once the break-even point is realized. The restaurant manager should also note that once sales fall below the break-even point, losses will be incurred proportionately.
Once the graph is set up and drawn, it is interesting to note how changes in the level of sales affect the profit margin. The profit or loss at any customer count level may be easily determined by the difference between the total sales line and cost line.
Suppose sales were increased to $120,000 (an additional 10,000 customers served). At this level of sales, total costs are $112,000. $40,000 fixed costs + ($7.20 variable cost per customer x 10,000 the number of customers served), which shows a profit of $8,000 or a 40 percent profit on the additional $20,000 in total sales. Thus, once the break-even point is reached, it is accurate to assume that each additional dollar in sales will result in 40 percent profit.
Thoroughly understanding break-even analysis will aid the restaurant manager in the following situations:
1. Determining the amount of customers needed in a specific time period (usually one month) before a profit is realized.
2. Analyzing remodeling or rebuilding plans for length and cost to project the additional customers needed to make the project profitable.
3. Evaluating menu prices and net pre-tax profit margins to determine the additional profits realized from a menu price increase.
The three situations just described will be resolved using break-even analysis. For ease in understanding the major concepts, the information used in the graphic representation will remain the same in the following problems.
|
Situation 1 The break-even point = Fixed Costs The average check amount Variable cost per customer $40,000 = $40,000 = 8,333 customers $12.00 - $7.20 = $4.80 |
|
Situation 2 The number of additional customers needed per year = The increase in Fixed Costs The average check amount Variable cost per customer $25,000 = $25,000 = 5,208 additional customers $12.00 - $7.20 = $4.80 |
|
Situation 3 $7.20 + ($40,000 + $5,000 / 10,000) = $7.20 + $4.50 = $11.70 This formula will also be helpful in determining the prices that must be charged in order to reach the break-even point. Assume a particular number of customers sold and a constant cost structure in these calculations. Whenever computing a break-even formula it is always a good idea to check your answers. Check: Sales - fixed costs - variable costs = 0 Using the above situation, the check is computed below: Sales $11.70 x 10,000 customers = $117,000 Variable costs $7.20 x 10,000 customers = 72,000 fixed costs = $40,000 Desired additional profit $5,000 |
There are certain assumptions made in projecting breakeven analysis that may not always hold true and should be pointed out. The most common assumption is that the menu or selling price and costs will remain constant over a long period of time, which may not be the case, as no one can accurately foresee the future. A change in the product mix (the portion of each individual menu item to the total number of menu items sold), may drastically change, thus affecting the breakeven point.
Breakeven analysis provides the restaurant manager with a valuable tool in analyzing the relationships between volume, selling prices, and expenses. Furthermore, breakeven analysis enables the restaurant manager to effectively prepare long range budgets and provide essential information relating to price levels, expansion possibilities, and past operational performances. The graphic representation of this data provides an easy-to-read-and-interpret report containing information from several financial statements from which the restaurant manager may then make decisions based upon accurate relevant information.