In addition to seeing which sockets are open on our computer, we can also capture the exact data being sent and received.
We have a few tooling options for this:
- tcpdump is a commonly used program for packet capture on Unix-based systems. It is not available on modern Windows systems, however.
- Wireshark is a very popular network protocol analyzer that includes a very nice GUI. Wireshark is free software, released under the GNU GPL license, and available on many platforms (including Windows, Linux, and macOS).
Included with Wireshark is Tshark, a command-line-based tool that allows us to dump and analyze network traffic. Programmers often prefer command-line tools for their simple interfaces and ease of scripting. They have the additional benefit on being usable on systems where GUIs may not be available. For these reasons, we focus on using Tshark in this section.
Tshark can be obtained from https://www.wireshark.org.
If you're running Linux, it is likely that your distro provides a package for Tshark. For example, on Ubuntu Linux, the following commands will install Tshark:
sudo apt-get update
sudo apt-get install tshark
Once installed, Tshark is very easy to use.
You first need to decide which network interface(s) you want to use to capture traffic. The desired interface or interfaces are passed to tshark with the -i flag. On Linux, you can listen to all interfaces by passing -i any. However, Windows doesn't provide the any interface. To listen on multiple interfaces with Windows, you need to enumerate them separately, for example, -i 1 -i 2 -i 3.
Tshark lists the available interfaces with the -D flag. The following screenshot shows Tshark on Windows enumerating the available network interfaces:

If you want to monitor local traffic (that is., where the communication is between two programs on the same computer), you will want to use the Loopback adapter.
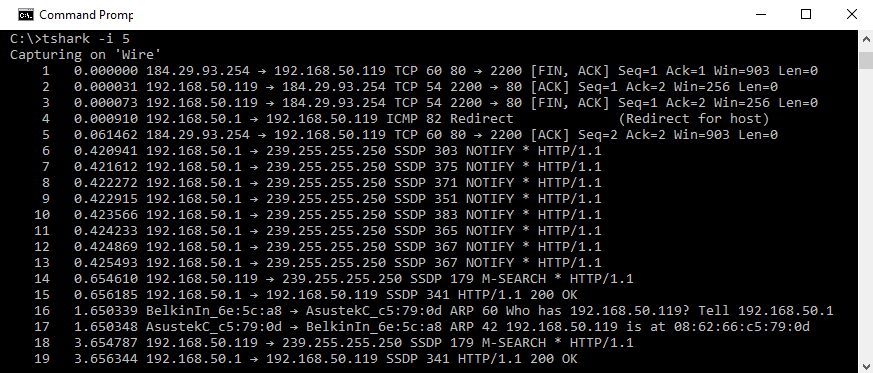
Once you've identified the network interface you would like to monitor, you can start Tshark with the -i flag and begin capturing traffic. Use Ctrl + C to stop capturing. The following screenshot shows Tshark in use:

The preceding screenshot represents only a few seconds of running Tshark on a typical Windows desktop. As you can see, there is a lot of traffic into and out of an even relatively idle system.
To cut down on the noise, we need to use a capture filter. Tshark implements a small language that allows easy specification of which packets to capture and which to ignore.
Explaining filters may be easiest by way of example.
For example, if we want to capture only traffic to or from the IP address 8.8.8.8, we will use the host 8.8.8.8 filter.
In the following screenshot, we've run Tshark with the host 8.8.8.8 filter:

You can see that while Tshark was running, it captured two packets. The first packet is a DNS request sent to 8.8.8.8. Tshark informs us that this DNS request is for the A record of example.com. The second packet is the DNS response received from 8.8.8.8. Tshark shows that the DNS query response indicators that the A record for example.com is 93.184.216.34.
Tshark filters also support the Boolean operators and, or, and not. For example, to capture only traffic involving the IP addresses 8.8.8.8 and 8.8.4.4 you can use the host 8.8.8.8 filter or the host 8.8.4.4 filter.
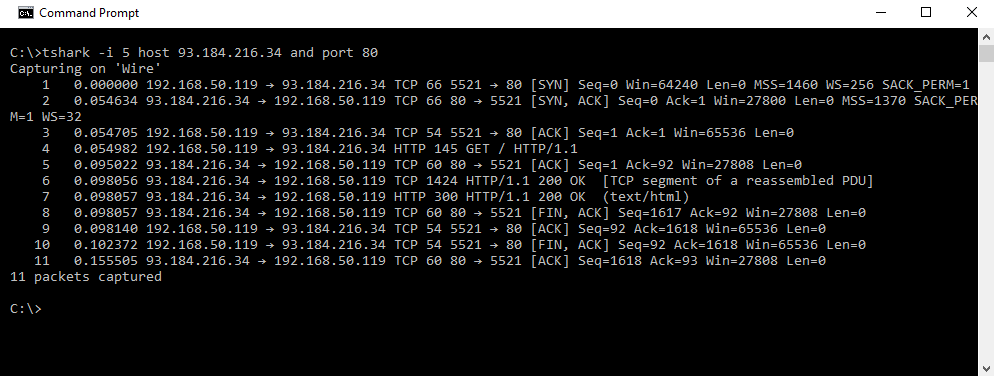
Filtering by port number is also very useful and can be done with port. For example, the following screenshot shows Tshark being used to capture traffic to 93.184.216.34 on port 80:

In the preceding screenshot, we see that Tshark was run with the tshark -i 5 host 93.184.216.34 and port 80 command. This has the effect of capturing all traffic on network interface 5 that is to or from 93.184.216.34 port 80.
TCP connections are sent as a series of packets. Although Tshark reports capturing 11 packets, these are all associated with only one TCP connection.
So far, we've been using Tshark in a way that causes it to display a summary of each packet. Often this is enough, but sometimes you will want to be able to see the entire contents of a packet.