


Urbanization—the movement of people from villages to cities and towns—began in earnest in 1800, when less than 10 percent of the planet’s population lived in cities, and reached a peak in 2000, when half the world’s population lived in cities. The world’s urban-growth rate is slowing down and is likely to come to an end by 2100, when world population growth is expected to halt and as many as three-quarters of the world’s population will live in cities. Short as it may be, the coming decades offer a critical window of opportunity to make minimal preparations for coming urban-population growth and its concomitant, mostly suburban, physical expansion. When cities grow in population and wealth, they expand. As they expand, cities need to prepare lands for urban use, ensuring that they are properly serviced yet affordable so that they may be of optimal use to their inhabitants.
Romantic as the notion may be, orderly, efficient, equitable, and sustainable cities are not self-organizing. They do not emerge from spontaneous actions by the multitudes of individuals, groups, or firms. Rather, they come about when these multitudes act in unison as a public to lay out areas of expansion in an orderly, efficient, and equitable manner before they are occupied, by reserving adequate lands for public works, public open spaces, and public facilities.
We cannot hope to slow down the urbanization process or to shift populations among cities. People are free to move within their own countries, and their right to move is enshrined in the Universal Declaration of Human Rights.1 Population growth in cities cannot be effectively guided by policy. But the conversion of land to urban use is very much guided and influenced by policy. Defining future patterns of urban development is where planners, designers, and decision makers can intervene to precede and guide the operations of the free market on the urban fringe. Without this concerted public action in advance of development, land and housing markets, efficient as they may be in theory, will fail to perform properly in practice.
And yet, there is reluctance to engage with the prospects of urban expansion, perhaps for perfectly understandable reasons. Many people have come to believe that cities consume enough land as it is and that all future construction should take place within existing urban extents. Others oppose expansion so as to conserve municipal infrastructure budgets, ameliorate traffic congestion, help decaying central cities thrive again, conserve energy, reduce air pollution, or protect precious cultivated lands at the urban fringe. This reluctance, reasonable as it may seem, keeps the prospects of urban expansion rather obscure and prevents us from addressing them in a clear, forthright manner.
Part of this reluctance may also be ignorance, as our knowledge of the quantity and the quality of global urban expansion is meager and unsatisfactory. To tackle this lack of knowledge, the New York University Urban Expansion Program has initiated a multiphase research effort to monitor the quantitative and qualitative aspects of global urban expansion.2
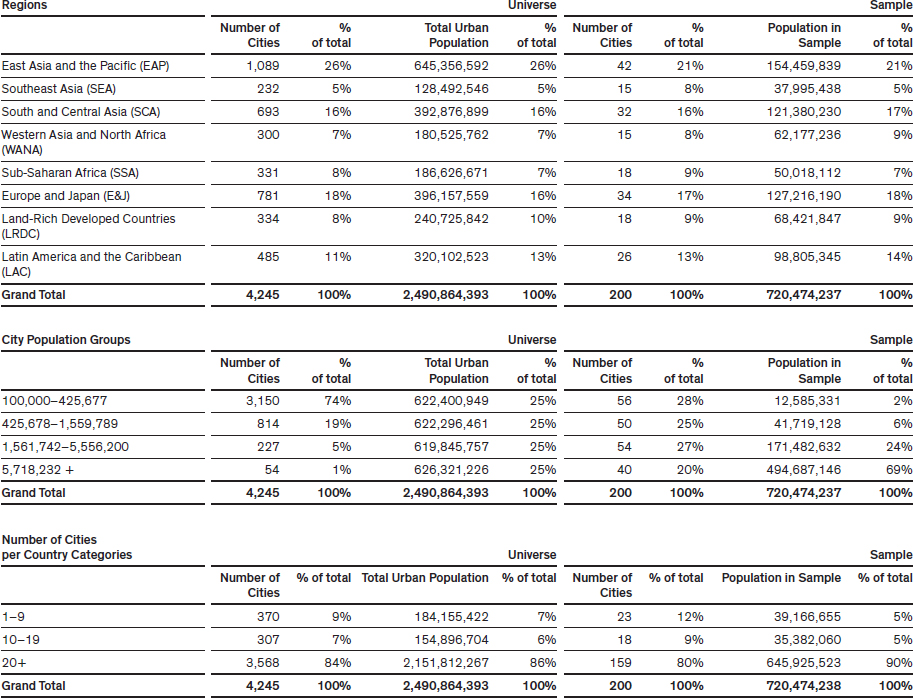
Our empirical data on actual urban expansion and its key attributes—in many cities around the world over long periods of time—provides a much-needed basis for understanding the global and historical contexts of urban expansion. Our research focuses on studying a stratified global sample of 200 cities, strategically chosen from the 4,245 cities in the world with a population above one hundred thousand in 2010. This sample allows us to make powerful generalizations about cities worldwide.3 (fig. 2.1.1) Our data, coupled with theories that could explain the underlying forces that are propelling and shaping this urban expansion, could provide the evidence needed to assess and address our various concerns: that it would be very difficult, if not futile, to resist urban expansion; that ignoring it or denying it in the hope that it will not occur will simply allow it to take place unhindered and in a more costly and destructive way; that acquiring a better understanding of it will make it less formidable and more manageable; and that making minimal yet effective preparations for it is the right way, and certainly the only responsible way, to proceed.
2.1.1 A comparison of the universe of cities and the sample of cities, stratified according to the categories of region, city population group, and number of cities per country
This essay presents some important findings from our ongoing research on the finite dimensions and the measurable attributes of our planet’s increasingly infinite suburbia.4 We focus on two simple questions. First, what is the physical extent of our planet’s urban areas today, and how are they expanding over time? Second, how well laid out are recently built suburban peripheries, and how are layouts changing over time? With both of these questions, the aim is to reveal the reasons for change and to expose the ways in which change matters.
We believe that provisional answers to these questions can make us less fearful of the rapid expansion of the suburban peripheries of our cities. Better knowledge will help us confront this expansion in a meaningful way, one that will allow us to engage with suburban peripheries pragmatically and realistically in the years to come.
Our research into urban expansion adds some important information to the widely known fact that urban expansion is greatest in developing countries. There is near universal agreement that a settlement of 100,000 people or more constitutes a city.5 We have now identified 4,245 cities (not single municipalities, but entire metropolitan areas) on our planet that were home to 100,000 people or more in 2010. The total 2010 population of this universe of cities amounted to 2.5 billion, or 70 percent of the world’s 2010 urban population of 3.6 billion.6
Three-quarters of these cities are in developing countries. More precisely, 3,130 cities out of the total 4,245 (74 percent), housing 1.85 billion people out of a total 2.5 billion (also 74 percent), are in developing countries. Moreover, the share of projected urban-population growth in coming decades in the developing countries is much greater. Between 2015 and 2050, the world’s urban population is now expected to increase by 2.38 billion people.7 Only 5 percent of that increase (130 million) will be in developed countries. The rest, 95 percent (or 2.25 billion), will be in the developing countries. In other words, the increase in the city populations in developing countries will be eighteen times that of the increase in the city populations of developed countries.
The challenge of urban expansion in the coming decades is therefore largely a challenge facing cities in developing countries. Compared to the developed world, these cities, on the whole, have fewer fiscal resources, weaker rules of law, higher levels of corruption, and less experienced public servants, but also higher built-up area densities, more reliance on public transport, and lower levels of energy use. It may well be that the suburbanization agenda for cities in developing countries is quite different than the suburbanization agenda of those in developed countries. Nonetheless, from the point of view of monitoring suburbanization, we believe that it is important to study both developed-country cities and developing-country cities using the same conceptual framework and the same methods for data collection and analysis.
Our mapping and measuring of global urban expansion since 2003 has exposed important relationships between the spatial extent of an urban area and specific factors.8 The findings from our early modeling of the urban extent of ninety cities were consistent with classical models of the city—for example, the economic geographer William Alonso’s Location and Land Use.9 Specifically, we found that the following parameters positively correlate with a greater spatial extent in a statistically significant way: city population, per capita income, availability of buildable land on the urban periphery, amount of arable land per capita in the country, and cheaper cost of transport. In other words, the greater the magnitude of these parameters (and the cheaper the cost of transport), the larger the urban extent.10
Moreover, we have found that urban extents grew at a faster annual rate between 1990 and 2000 than the population of cities did. Cities in our sample expanded at an average annual rate of 3.6 percent, while their populations grew at an average rate of 1.6 percent per year.11 The consumption of urban land per person increased at an annual rate of 2.1 percent, and the inverse metric, the average residential density in the built-up areas of cities, declined at the same average rate of 2.1 percent per year.12 This is largely explained by increases in income, the availability of land for expansion, and inexpensive transport.
We also found that average built-up area densities were significantly different among the three world regions: land-rich developed countries (the United States, Canada, and Australia); Europe and Japan; and developing countries. Average built-up area densities in developing countries, 428 people per acre (173 people per hectare) circa 1990 and 334 people per acre (135 people per hectare) circa 2000, were found to be double those of Europe and Japan, 205 people per acre (83 people per hectare) circa 1990 and 163 people per acre (66 people per hectare) circa 2000. Yet those in Europe and Japan were found to be triple those of land-rich developed countries, sixty-seven people per acre (27 people per hectare) circa 1990 and fifty-four people per acre (22 people per hectare) circa 2000.
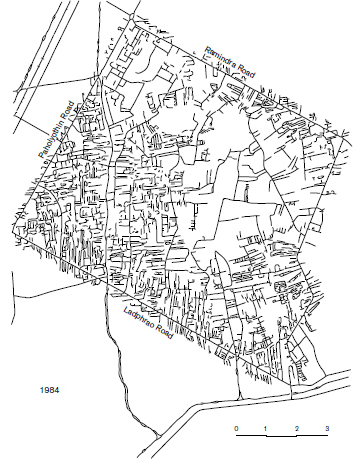
Our analysis of thirty cities for the period 1800 to 2000 revealed that the decline in average urban density was in motion for a majority of cities during most of the twentieth century, after a period of increases during the nineteenth century. In 1800, during the time of Napoleon, Paris had a population of 0.5 million people and covered an area of some 4 square miles (11 square kilometers). By 2000, it had a population of some ten million people and an area of some 770 square miles (2,000 square kilometers). In other words, its population grew twentyfold, while its area grew two hundredfold. The average density in Paris declined ninefold during this period—from 180 people per acre (450 people per hectare) to 20 people per acre (50 people per hectare)—at an average annual rate of 1.1 percent. Similar rates of decline from peak density to that observed in Paris were observed in the other cities in the group as well. (fig. 2.1.2)
2.1.2 The expansion of Paris, France, from 11 square kilometers in 1800 (gray) to 2,000 square kilometers in 2000
Preliminary results for one-third of the cities in our stratified sample of two hundred global cities, results that still need to be checked, suggest that the average densities of the built-up areas of cities continued to decline in the period 2000–2014.13 (fig. 2.1.3) For example, Accra’s expansion during this period was quite extraordinary. Results yet to be confirmed suggest that its population grew from 1.32 million in 1991 to 2.54 million in 2000, and to 4.5 million in 2014, at an average annual growth rate of 5.3 percent. Its built-up area grew from about 24,700 acres (10,000 hectares) in 1991 to 79,600 acres (32,200 hectares) in 2000, and to 152,700 acres (61,800 hectares) in 2014, at an average annual growth rate of 7.8 percent, a rate one and a half times that of its population growth rate. As a result, the average built-up area density in Accra declined from 336 people per acre (136 people per hectare) in 1991 to 222 people per acre (90 people per hectare) in 2000, increasing to 247 people per acre (100 people per hectare) in 2014. Its population density fell by slightly more than one-quarter during the 1991 to 2014 period, declining at an average annual rate of 1.3 percent.
What can we say now about the prospects of the urban/suburban explosion in the coming decades? Between 2010 and 2050, the developing world’s urban population is expected to double, from 2.6 billion to 5.2 billion. Economic development and cheap transportation are likely to increase land consumption per person, meaning they will hasten a decrease in average urban densities. If the consumption of land per capita increases at 1 percent per annum—the rate at which it increased in Paris, on average, during the last two centuries—the land area of cities in developing countries is likely to triple. If it increases at 2 percent per annum—the average rate of increase in our earlier sample of 120 cities between 1990 and 2000—the land area of cities in developing countries is likely to more than quadruple.
The prospects of urban expansion in sub-Saharan Africa will be much more extreme than in the rest of the developing world. Between 2010 and 2050, the urban population in sub-Saharan Africa is expected to quadruple, from 295 million to 1.15 billion. If densities remain the same, urban areas will increase fourfold as well. If the consumption of land per capita increases at 1 percent per annum, the land area of cities in sub-Saharan Africa is likely to increase almost sixfold. If it increases at 2 percent per annum, land area of cities in sub-Saharan Africa is likely to increase more than eightfold.
Lower, more modest, increases can be expected in developed countries: a 75 percent increase in area if land consumption increases at 1 percent per annum, and a 160 percent increase if land consumption per capita increases at 2 percent per annum. These are indeed explosive increases in the expansion of cities.
Policy makers at the local, national, and international levels, as well as activists and interested citizens, should be aware of the dimensions of the coming urban expansion, so that adequate lands can be prepared for that expansion, and so that it is orderly, efficient, equitable, and sustainable. Turning a blind eye to urban expansion will likely result in just the opposite: disorderly, inefficient, inequitable, and unsustainable expansion. Limiting it forcefully, in the name of rural land conservation, for example, will likely choke the residential land supply and place housing out of reach of the majority of households. Whether observed urban expansion now is orderly and whether land and housing are affordable are empirical questions being explored in subsequent phases of our monitoring effort.
We know very little about the peripheries of our cities, where urban expansion is now taking place. Radical and irreversible transformations are taking place in these vast areas, as lands that may have been in cultivation for centuries are converted to urban use, never to convert back to rural use. The owners of rural land may sell it to urbanites—speculators, developers, or ordinary city folk—who may have much better information about its market price, the laws governing it, and its potential use and value. The urban periphery, being far from the center of the city, may also be less regulated and less familiar to public officials. Land documents may be incomplete or nonexistent, while property rights and property lines, possibly enshrined for generations through continuous use, may be quite resistant to abrupt change.
Land-use change on the urban fringe is subject to this asymmetry of information and is not well understood. Nonetheless, land is being transferred and put to urban use one way or another at a rapid rate, a rate commensurate with the pace of population growth and economic development in the city. Once land is transferred to urban use and to urban users, its character changes. It can join the city in two quite different ways: it can become a marginalized part of the city, never making a full transformation from rural to urban use, retaining the old property lines and rural lanes; or it can be integrated properly into the city, with appropriate urban layouts that include new property lines, new street grids, and new arterial roads. The unfettered actions of the land market cannot and will not ensure that urban peripheries are properly laid out. If they are not properly laid out at first, they are likely to remain in that condition in the future. Strictly speaking, barring clearance and redevelopment—a highly unlikely outcome anywhere that people have a voice—rural or semirural layouts cannot be transformed into urban ones once they are fully occupied. Street layouts and property lines in built-up areas are, for all intents and purposes, irreversible.
The rebuilding of London after the Great London Fire of 1666 epitomizes the power of old, often invisible, property lines over urban form. Sir Christopher Wren, the architect of London’s St. Paul’s Cathedral, quickly presented King Charles II a plan for rebuilding the city with modern street grids, wide avenues with open vistas, and public squares. (fig. 2.1.4) Others, notably the writer John Evelyn and the architect Robert Hooke, presented competing plans as well. But the king, fearful of an uprising, was reluctant to assume the power to confiscate the lands needed to implement the plans. In the resulting confusion, it was impossible to identify landowners for purposes of compensation, and the city was quickly rebuilt along the old property lines.
2.1.4 Sir Christopher Wren’s plan, never realized, for rebuilding London after the Great Fire of 1666
Modern-day suburban Bangkok, Thailand, and suburban Lima, Peru, offer a striking contrast in their street layouts. The hands-off, laissez-faire approach to urban development that characterizes Bangkok illustrates how the absence of arterial roads creates large efficiency losses and stymies organized urban expansion. (fig. 2.1.5) As a result, in a large northeastern inner suburb of Bangkok there are networks of narrow lanes that were developed during the 1960s, 1970s, and early 1980s, leaving rural property lines largely intact. This example underscores one of the drawbacks of quick, laissez-faire, market-driven urban expansion: it ignores the substantial land needs of public works. The result in Bangkok is that many arterial roads are spaced no less than 5 miles (8 kilometers) apart, and the local roads, while connecting each plot to the outside world, are not connected to each other to facilitate through traffic. Congestion is high because long intracity trips are crowded into a small number of arterial roads, resulting in elevated levels of air pollution and energy use and low labor productivity.
2.1.5 The absence of arterial roads in a 60-square-kilometer section of northwest Bangkok, Thailand, 1984
The absence of an arterial road grid in Bangkok makes it very difficult to extend the primary grid of key infrastructure services: water supply, sewerage, and storm drainage. This absence also makes it much more difficult for the city to collect and treat its stormwater and sewer water before pumping it out or recycling it. Indeed, Bangkok does not have a piped water system, a piped drainage system, or a piped sewerage system. Finally, in the absence of any public pressure or appropriate and binding legislation, the newly developed areas outside Bangkok’s traditional center have little public open space.
For Bangkok, one of the world’s largest and fastest-growing cities, the absence of adequate land for public works has been devastating. It is expanding rapidly without an arterial road network or a primary infrastructure network that can carry water, sewerage, or stormwater; without a system of dikes to manage its stormwater; and without a hierarchy of public open spaces. The solutions to this self-inflicted environmental crisis require massive investments in public works. But in the absence of rights-of-way for an arterial road network, a dike system, and the lands for a hierarchy of public parks and playgrounds protected from development, such investments are now exorbitant and quite possibly unaffordable. Necessary as they may be, the destruction of private property that building these facilities would entail makes the likelihood of their creation next to impossible.
Planning and acquiring the land for public works requires organization. While Bangkok illustrates hardly any organization to speak of—a virtual state of anarchy—the creation of Pampa de Comas, a large squatter settlement on the desert outskirts of Lima, demonstrates what can be achieved through planning and coordination. Located on public land, Comas was formed by a series of organized invasions that were carefully thought out and far from spontaneous. People came together in the city, often organized by zealous priests, to plan and prepare the settlement. Each invading family occupied one building site that had been properly surveyed and selected in advance. The sites were relatively large, measuring about 33 by 66 feet (10 by 20 meters). There were twenty sites to a block, and roads between the blocks that were 33 feet (10 meters) wide. Some blocks were intentionally left open for markets, schools, and public open spaces. Comas is now a fully built urban neighborhood, indistinguishable from any other neighborhood in the city. Squatters were eventually awarded title documents, and the houses in the district are now part of Lima’s formal housing market. With its small blocks and wide streets, no less than 27 percent of the land area in Comas was devoted to local streets, and an additional 3 percent to public open spaces. (fig. 2.1.6)
The planning and the reservation of rights-of-way for street grids at the block level are essential. In his book, La grilla y el parque, Adrián Gorelik equates the 1898 street grid in Buenos Aires—the street grid shown in its 1904 plan as covering the entire territory of the Federal Capital—with the homogenization of its territory. In the spirit of social reform, the differentiation between rich and poor, between the formal and the informal, was obliterated, and the distribution of public services, including streets and public open spaces, was equalized.14 Indeed, it stands to reason that the Comas street grid and its open spaces accelerated its incorporation into metropolitan Lima as a district among equals. By making all plots similar to each other and having each face a broad street, the Comas plan also reduced the difference in real estate values among the houses in the neighborhood, and increased the value of real estate in the metropolitan area as a whole.
The lessons from Bangkok and Lima are quite clear. To facilitate the provision of infrastructure services, arterial roads and streets must to be laid out before plots revert from a rural to an urban use. New street layouts must not discriminate between rich and poor. An adequate share of the land needs to be dedicated to streets, and streets have to be wide enough. Blocks must be small enough to make neighborhoods walkable. To serve low-income households, plot sizes in residential subdivisions must be small enough to be affordable.
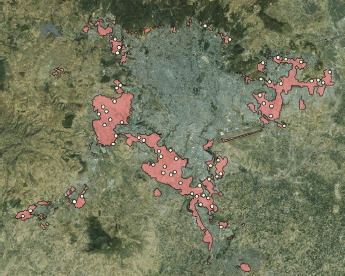
In a global sample of two hundred cities, we measure block sizes and road density in a randomly chosen set of 25-acre (10-hectare) locales in each city’s urban periphery.15 We also identify and measure access to arterial roads in the expansion area as a whole. Our initial findings reveal inefficient patterns of urbanization that are now common in the developing world’s urban peripheries. (fig. 2.1.7)
2.1.7 The expansion area of Addis Ababa, Ethiopia, in 1990–2014, and the set of quasi-random, 24.7-acre (10-hectare) locales used to analyze the quality of urban layouts there
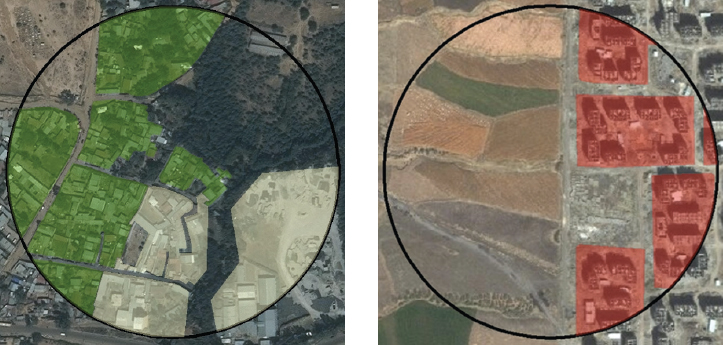
Using high-resolution satellite images of each locale, trained analysts digitized street boundaries as well as the boundaries of residential and nonresidential areas.16 Residential areas were classified into four types, depending on their stage of evolution: (1) Atomistic Housing, laid out in succession, one house after the other; (2) Informal Land Subdivisions, where land is subdivided into plots and narrow lanes, typically ignoring land subdivision regulations; (3) Formal Land Subdivisions with proper street layouts; and (4) Housing Projects, with identical houses or apartment buildings arranged in a regular pattern on the site. In addition, wherever possible, analysts identified plots in land subdivisions and measured their widths and lengths. Finally, in addition to the digitization and labeling of land uses in locales, analysts digitized the medians of all blocks that intersect the locale, as well as the medians of all arterial roads—roads 59 feet wide (18 meters) or greater that are connected to other 59 foot-wide roads—within 0.6 miles (one kilometer) of the expansion area. (fig. 2.1.8)
2.1.8 Atomistic housing (left) and housing projects (right) in two 24.7-acre (10 hectare) locales in the expansion area of Addis Ababa
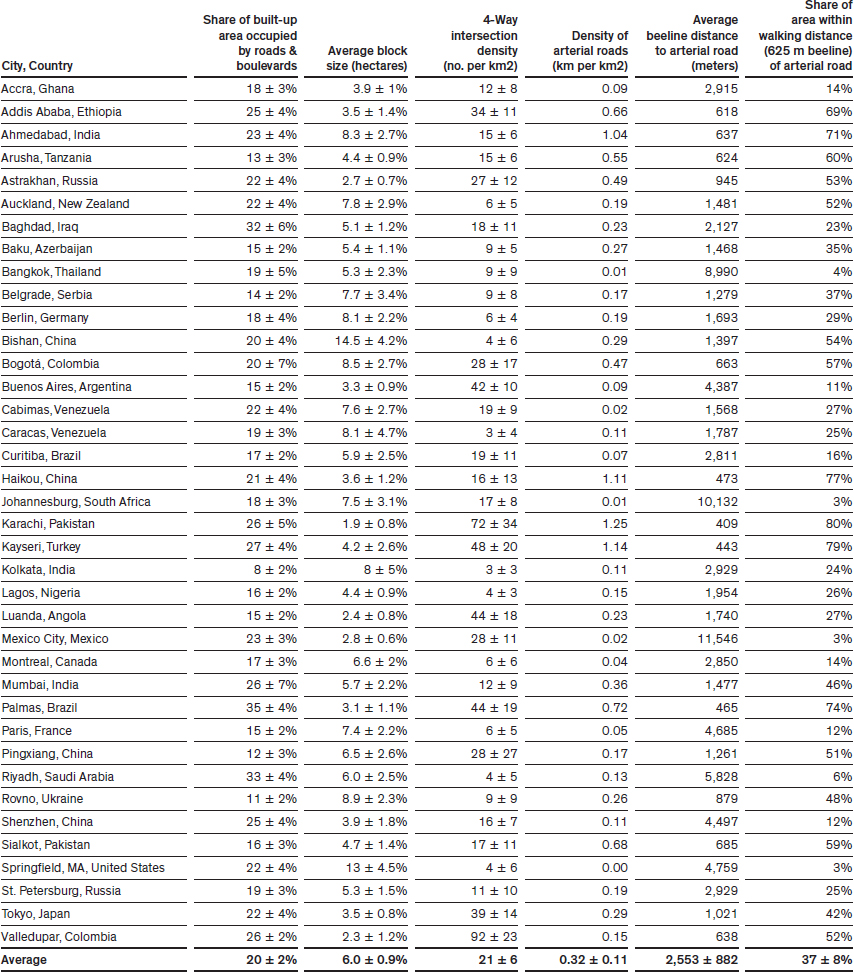
Initial results from thirty-eight cities reveal some important regularities in the urban layouts on the peripheries of cities in 2015. On average, the share of the built-up area devoted to streets and boulevards is 21 percent, with Kolkata, India, as a low outlier at 8 percent, and Palmas, Brazil, as a high outlier at 35 percent. Block sizes on the urban periphery of cities were found to be quite large, compared to, say, blocks in Manhattan, New York, a highly walkable urban area. Blocks in Manhattan average 5.4 acres (2.2 hectares) in area, compared to the average of 14.8 acres (6 hectares) in thirty-eight out of two hundred cities for which we can report preliminary results. It is quite clear that in most urban peripheries, relatively large block sizes compromise their walk-ability. In Manhattan, average intersection density is 236 per square mile (91 per square kilometer). The average intersection density in the urban peripheries of the thirty-eight cities was much lower, 54 per square mile (21 per square kilometer). (fig. 2.1.9)
2.1.9 Preliminary values for selected characteristics of urban layouts in a subset of thirty-eight cities from the global sample of two hundred cities, 2015
Preliminary results for the thirty-eight of two hundred cites also reveal a maximum density of arterial roads of 2.0 miles per square mile (1.25 kilometers per square kilometer), in Karachi, Pakistan. The minimum was observed in Springfield, Massachusetts, in the United States, which had no arterial roads in its expansion area at all. The average distance to an arterial road in this subset of thirty-eight cities was 1.6 miles (2.6 kilometers), beyond convenient walking distance; the average share of the area in the urban peripheries of these cities that was within walking distance of an arterial road was 37 percent. These values confirm that most of the area of present-day urban peripheries is not accessible to arterial roads and is therefore quite unlikely to be served by public transport in an efficient and equitable manner.
We look at one specific example: a typical residential area in the expansion zone on the northern periphery of Kolkata, India. Most of the housing is atomistic housing, built over land that was not subdivided into regular plots with street access to each plot before it was occupied. There are very few roads in the area, and only one wide paved road a considerable distance away from most houses.
New statistical findings for the expansion zone of Kolkata confirm these observations. The share of the residential area occupied by atomistic housing in the expansion area of Kolkata is 92 percent. The share of the built-up area devoted to roads and boulevards is 8 percent. Arterial roads are practically nonexistent. Given the density of arterial roads, 0.18 miles per square mile (0.11 kilometers per square kilometer), we can estimate that, on average, arterial roads are spaced some 11 miles (18 kilometers) apart.
Our superficial examination of the data suggests that urban peripheries the world over are not being developed in an efficient, equitable, and sustainable manner. That said, we need the full data set, soon to be completed, for all two hundred cities in the sample if we are to begin to understand the scope of the problem and chart effective paths for solving it, or at the very least ameliorating it, in the coming years.
It is clear that cities in the developing countries will see the most dramatic expansions of their built-up areas over the next decades. It is not clear that these rapidly growing cities are making or will make the necessary preparations for their inevitable expansion. How can we ensure that residential land on the urban fringe remains affordable to all of those in need and accessible to jobs by efficient and sustainable transport? What can be done to see to it that neighborhoods are laid out before they are occupied, to ensure the orderly and efficient provision of infrastructure services?
The authors and their colleagues at the New York University (NYU) Urban Expansion Program are working toward providing a pragmatic answer to this question. The primary mission of the program is to train, assist, and empower municipalities of rapidly growing cities so that they can make room, in a set of four practical steps, for their inevitable expansion:
Making room is seen as critical in ensuring that residential land on the urban fringe remains affordable by all those in need as well as readily accessible by efficient public transport. Making room is also seen as critical in ensuring that new urban neighborhoods are laid out before they are occupied to ensure the orderly and efficient provision of infrastructure services.17 To date, there are two urban expansion initiatives—one focused on four intermediate cities in Ethiopia and one focused on five intermediate cities in Colombia—in advanced stages of completion. In both countries, a number of cities have finalized their infrastructure grid plans and are now actively securing the rights-of way for an arterial 98.4-foot-wide (30-meter-wide) road grid, spaced 0.6 miles (1 kilometer) apart. The national governments of both countries are now actively transforming these initiatives into national programs. Exploratory work on new urban expansion initiatives in several other countries—Mexico, China, India, Myanmar, Indonesia, and Rwanda—is now underway.
The key message of this work for confronting Infinite Suburbia is that the remaining decades of the present century offer a window of opportunity for taking action that will shape the suburban peripheries of cities—peripheries that will be vastly larger than the cities of today—for centuries to come. These actions must now move away from the offices of academics and bureaucrats to putting stakes in the ground. To succeed, they must be done at scale. To be done at scale, they must engage thousands of municipalities. To engage thousands of municipalities—the great majority of them in developing countries—they must be simple and inexpensive, and the time for undertaking them is now.
2 The NYU Urban Expansion Program is supported by the NYU Stern Urbanization Project and the NYU Marron Institute of Urban Management, in partnership with the United Nations Human Settlements Programme (UN-Habitat) and the Lincoln Institute of Land Policy. The NYU Urban Expansion Program is described in a recent article in the Economist at http://www.economist.com/news/international/21604576-cities-are-bound-grow-they-need-planning-be-liveable-roads-redemption. A short video can be found at http://urbanizationproject.org/blog/urban-expansion. A primer describing it can be found at http://urbanizationproject.org/uploads/blog/UEPrimer2014.pdf. Animation of the expansion of thirty cities can be seen at https://www.youtube.com/playlist?list=PLzYZm159uzQNc7H5UCCXHx4c4TKdCeaNt. The intellectual foundation of the program is a ten-year research project on urban expansion, culminating in the publication of two books: Shlomo Angel, Planet of Cities (Cambridge, MA: Lincoln Institute of Land Policy, 2012); Shlomo Angel et al., Atlas of Urban Expansion (Cambridge, MA: Lincoln Institute of Land Policy, 2012).
3 The sample is roughly 5 percent of the 4,245 cities with one hundred thousand people or more in 2010. The sample was selected with three criteria in mind: (1) having cities from eight world regions in proportion to the urban population in each region; (2) having one-fourth of the cities drawn from each of the four population-size categories, each category containing one-quarter of the total population of the cities in the universe; and (3) selecting cities from three country categories—those with 1 to 9 cities, those with 10 to 19 cities, and those with 20 or more cities, with a slight bias toward the first two categories. It is also important to note that the second criterion—dividing the cities into four population-size groups, each containing the same total population—biases the sample toward larger cities: The four population size groups contain the same total population, but there are as many as 3,150 cities in the first group (cities of 100,000 to 425,000 people), and 56 of them are in the sample, and there are only 54 cities in the fourth population size group (5.6 million and more) and 40 of them are in the sample. As a result, the 200 sample cities have a population of 720 million, 29 percent of the total population of the universe. We tested the representativeness of the sample in the following manner: We know the 2000–2010 population growth rates of all cities in the universe and in the sample. We compared their averages—both weighted and unweighted—and found that they were not statistically different from each other at the 95 percent confidence level.
4 Complete results for the first three phases of the program were presented at the Habitat III conference in Quito, Ecuador, on October 2016, and are available at http://atlasofurbanexpansion.org/.
5 With the important exception of China where there were only 657 officially designated cities in 2015, we identified hundreds of additional settlements of one hundred thousand people or more that we have counted as cities.
6 United Nations, Department of Social and Economic Affairs, Population Division 2014, File 3: Urban Population at Mid-Year by Major Area, Region and Country, 1950–2050 (thousands), accessed August 13, 2015, http://esa.un.org/unpd/wup/CD-ROM/.
7 Ibid.
8 Shlomo Angel et al., The Dynamics of Global Urban Expansion (Washington, DC: World Bank, Transport and Urban Development Department, 2005); Shlomo Angel et al., Atlas of Urban Expansion: The 2016 Edition, 2 vols. (New York; Nairobi; Cambridge, MA: NYU Urban Expansion Program at New York University, UN-Habitat, and the Lincoln Institute of Land Policy, 2016), http://atlasofurbanexpansion.org/data.
9 William Alonso, Location and Land Use (Cambridge, MA: Harvard University Press, 1964).
10 These variables were all significant at the 95 percent confidence level, and together they explained more than 80 percent of the variation in urban extent in the ninety cities studied.
11 These average rates were significantly different from one another at the 95 percent confidence level.
12 These average rates were significantly different from zero at the 95 percent confidence level.
13 At a rate significantly different from zero at the 95 percent confidence level.
14 Adrián Gorelik, La grilla y el parque: Espacio publico y cultura urbana en Buenos Aires (Buenos Aires: Universidad Nacional de Quilmes, 2001).
15 In early 2016 we plan to report on all two hundred cities as well as on the change of urban layouts over time. Locales were chosen from those areas of cities that were new between 1990 and 2014. In these expansion areas, we picked an initial set of 40 points, using a halton sequence to generate the points. The halton sequence generates a quasi-random number sequence, in our case a set of quasi-random coordinates of points the expansion area. The points are not truly random in the sense that, given the same origin, the halton sequence will always generate the same sequence of coordinates for points. Around each point, we drew a circle with an area of about 25 acres (10 hectares or 0.1 square kilometers), and we focused our analysis on that circle, referred to as a locale. The extent of the sampling in a particular city’s expansion area is not predetermined. We start out with forty locales in each city, but the decision of when to stop analyzing locales depends on results of a test designed to tell us whether we have captured the average expansion area value for a particular metric with a high degree of statistical confidence. Until this criterion is met, we continue the sequential sampling of locales within the expansion area.
16 The digitized results for forty locales in the expansion area of each city in the global sample are processed in an automated Python Script in ArcGIS to result in a set of up to eighteen metrics—some more useful than others—that characterize urban layouts in a given expansion area. Selected average metric results—including their 95 percent confidence limits—for forty locales in a subset of thirty-eight selected cities from the global sample of two hundred cities—for which preliminary data are already available—are presented, for illustrative purposes, together with data on arterial roads in the expansion areas of these cities. It was not possible to include data on housing characteristics or on the share of roads in different road-width categories in the expansion areas of these cities at the time of writing, as these were still being tested for accuracy.
17 The NYU Urban Expansion Program is described in a recent article in the Economist, online at http://www.economist.com/news/international/21604576-cities-are-bound-grow-they-need-planning-be-liveable-roads-redemption.