

Since World War II, many core municipalities have experienced substantial suburban expansion within their borders. Los Angeles, Milwaukee, Portland, and Denver are just a few examples. In some cases, new suburban areas were annexed, while in others, such as Los Angeles, there was ample agricultural land within the city limits for broad, postwar suburban greenfield expansion. Other core municipalities that were largely developed after World War II, such as Phoenix and San Jose, are virtually all low-density and automobile-oriented suburbs. All of these places contrast with the higher densities and more transit-oriented development typical of core municipalities such as New York and Boston, which were largely developed before World War II.
Many analysts have treated “core municipalities “as if they were the same thing as urban cores, with suburbs being the rest of the metropolitan area. That was a rough approximation of reality before World War II. However, since that time, thousands of suburban municipalities have been established, virtually all of which are low-density and automobile-oriented. Some core municipalities have annexed suburban areas; others have not. In short, urban versus suburban analysis based on municipal jurisdictions produces only the crudest results. There is a need for more fine-grained analysis based on function, whether urban core or suburban.1
The need is made more pressing by the currently influential strain of urban theory that seeks to restore urban forms and travel behavior to prewar—or resembling prewar—conditions.2 At its most extreme, there is an interest in reconfiguring even the built form of present neighborhoods. Data that exaggerate the extent of the urban core, which is inevitable in conventional analysis, could lead to underestimating the complexity of such an endeavor.
The United States experienced a sea change in urban form and travel patterns after World War II. The suburbs came to dominate urban growth, and automobile ownership rose substantially. This was an acceleration of trends that began in the nineteenth century and intensified in the first three decades of the twentieth century as the automobile became available.3 Between 1900 and 1930, automobile ownership rose from virtually zero to approximately 0.79 per household. Continuation of this trend was postponed for a decade and a half by the Great Depression and World War II. In 1945 automobiles had declined to 0.68 per household.4
However, things changed radically as soon as the war ended. The next five years were transformational, as automobile ownership increased at a 6 percent rate annually, reaching 0.93 by 1950. By 2013, the number of light vehicles (cars, light trucks, and sport utility vehicles) per household had reached 2.00.5 The automobile now accounts for 98 percent of passenger transport within US cities (metropolitan areas or urban areas).6
At the same time, urbanization expanded substantially. Since 1940, 95 percent of the population growth has occurred in metropolitan areas, rather than nonmetropolitan areas, and has been mostly in suburbs.7 Homeownership rose from 41 percent in 1940 to 65 percent in 1970. It has largely remained at this point, except for during the peak real estate bubble years between 2000 and 2010. Since the war, most owner-occupied housing has consisted of detached homes in suburban settings with larger yards. As a result, the average population density of urban areas has decreased. Between 1950 and 2010, the total population density of the largest urban areas within major metropolitan areas declined at least 48 percent.8
Virtually all population growth in major US metropolitan areas (defined as those with a population of one million or higher) has been suburban or exurban since before World War II. Nearly all of the core municipalities that have not been annexed and which were largely developed by 1940 have lost population (these municipalities are referred to as “constant border municipalities”).9 Further, among all other core municipalities, virtually all of the population growth has occurred in annexed areas or greenfield areas that were undeveloped in 1940. These expansions have been more suburban than urban core in nature or function.
Analyses that contrast prewar US urban form with postwar automobile-oriented suburbs have been hampered by the lack of conveniently available data. Typically, to denote the urban core, data for core municipality (or for central city, an Office of Management and Budget long-time term) have been used. The remainder of |the metropolitan area has been considered suburban (although some of it may be considered exurban).10 Core municipalities usually contain the entire historic center, characterized by areas of high-density housing (usually multi-unit buildings) and high percentages of transit use. Alternatively, suburbs tend to be dominated by automobile travel, and much of the housing is detached.
Yet this jurisdictional bifurcation is not a reliable way to differentiate the suburbs from the urban core. While core municipalities vary considerably in their urban form and travel patterns, most contain large areas that have the suburban characteristics of low-density detached housing and high automobile use. In fact, the majority of core municipality residents can be classified as living in suburban areas, rather than in urban cores. There are also a few cases of high-density urban cores that stretch across the boundaries of core municipalities into jurisdictional suburbs: New York, into southern Westchester County and into Hudson and Essex counties in New Jersey; Boston into its inner suburbs, such as Cambridge, Somerville, and Brookline; and Washington, DC, into Arlington and Alexandria Counties in Virginia and into Montgomery County, Maryland. And there are other instances of urban core characteristics outside the centers of metropolitan areas, such as Gary, Indiana (outside Chicago), Fall River (Providence), and Tacoma (Seattle). These are not suburban expansions of urban areas but smaller urban cores that have been engulfed by larger urban areas.
Analysis has become further complicated since the Office of Management and Budget (OMB), which defines US metropolitan area criteria, has replaced the term central city with principal city. OMB sought to acknowledge that metropolitan areas were no longer monocentric but had become polycentric.11 The polycentrism had become evident in employment centers, as large suburban employment districts had proliferated around metropolitan areas (termed edge cities in Joel Garreau’s book of the same name).12 Virtually without exception, these new centers have been much lower in employment density than the historic downtown areas (central business districts, or CBDs).
Yet in some popular usage (even sometimes by federal agencies such as the Census Bureau, the Department of Education, and the Federal Bureau of Investigation), any area that is not a principal city is considered to be suburban.13 The result of this usage is that postwar suburban municipalities such as Arlington (in the Dallas–Fort Worth metropolitan area), Mesa (in Phoenix), Hillsboro (in Portland, Oregon), and Irvine (in Los Angeles) are classified as nonsub-urban. Their average population density, at 3,200 people per square mile (about 1,200 per square kilometer), is well below the average density of the fifty-four core municipalities, even with the large share of functional suburban population in those cores.14
A more ideal and accurate method of analysis would be based on function, specifically urban form and household behavior, both of which vary substantially between the urban core and the suburbs. Due to the pitfalls of jurisdiction-based analysis, we have developed what we labeled the city sector model, which uses neighborhood-scale analysis (zip code tabulation areas) to classify segments of metropolitan areas by the way that they function at a smaller scale.15
The city sector model is similar in approach to previous research on Canadian metropolitan areas by the urban planning professor David Gordon and colleagues at Queens University, Canada.16 In a recent analysis, Gordon and the urban planner Isaac Shirokoff found that Canada’s largest metropolitan areas are more than 80 percent suburban.17
Gordon’s method of categorizing small areas by urban core versus suburban indicators can also be applied in the United States to avoid the problems of jurisdictional analysis. We used this approach to develop the city sector model, which provides a small-grained approach to classifying today’s urban form. Development of the small area analysis in the city sector model has been made feasible with the greater availability of the necessary data. This has encouraged others to perform similar analyses using the smaller areas.18
The criteria used in the city sector model for the United States were similar, but differed from those used by Gordon. We defined four city sectors that categorize neighborhoods by age of development and density: (1) Pre–World War II Urban Core, (2) Post–World War II Earlier Suburbs (generally inner suburbs), (3) Post–World War II Later Suburbs (generally outer suburbs), and (4) Exurbs (generally outside the urban areas). (fig. 2.3.1) The city sector model classifies each of the neighborhoods (zip code tabulation areas) in all of the fifty-two major metropolitan areas of the United States.
Criteria 1 |
Criteria 2 |
|
Pre-WW2 Urban Core (URBAN CORE) |
In principal urban area (AND) |
(OR) |
Post-WW2 |
Not Urban Core (AND) |
|
Post-WW2 |
Not URBAN CORE (AND) |
|
Exurban |
Outside 2010 principal urban area |
(OR) |
2.3.1 City-sector model criteria. The city sector model classifies zip codes by urban characteristics rather than jurisdictions.
The urban core includes any zip code tabulation area in the principal urban areas within metropolitan areas that has a 2010 population density of at least 7,500 people per square mile (about 2,900 people per square kilometer), and when at least 20 percent of travel by mass transit, walking, and cycling is devoted to work commutes.19 In addition, any neighborhood in the principal urban area with a median house construction date before 1946 is included in the urban core.20
Exurban areas include small areas outside the principal urban area and small areas with a population density under 250 per square mile (about one hundred people per square kilometer). Suburban areas make up the rest of the metropolitan area (outside the urban core and exurbs) and are divided into earlier suburbs, which have a median house construction age before 1980, and later suburbs, aged 1980 or later.
These city sectors, representing all zip code tabulation areas, in all fifty-two major metropolitan areas reflect the lower density, automobile-oriented suburbanization that occurred after World War II. While urban core population densities average 11,000 per square mile (about 4,200 per square kilometer), earlier suburban density is a much lower 2,500 per square mile (about 1,000 per square kilometer), and later suburban density is even lower, at 1,300 per square mile (about 500 per square kilometer). A similar contrast is evident in travel patterns. The combination of mass transit, walking, and bicycling make up 44.9 percent of trips in the urban core, much higher than the 8.7 percent in the earlier suburbs and the 3.9 percent in the later suburbs.
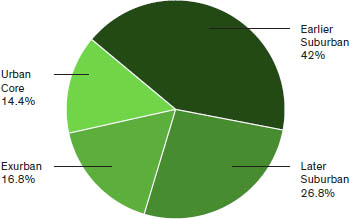
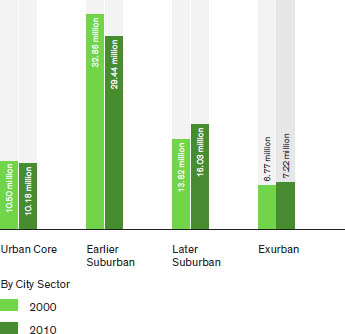
The results that follow are for the fifty-two major metropolitan areas and are all based on the City Sector model. The results show that urban cores—the densest, innermost portion of metropolitan areas—represented 14.4 percent of the major metropolitan area population in the 2010 US Census. Earlier and later suburbs together contained 68.8 percent of the population, while the exurbs had 16.8 percent. (fig. 2.3.2)
2.3.2 Population in 2010: City sectors major metropolitan areas. More than 85 percent of major metropolitan area population is in lower-density automobile-oriented neighborhoods.
In the years leading up to the 2010 Census, some analysts suggested that population growth had begun to increase more rapidly in the urban cores than in the suburbs and exurbs. Yet the 2010 census indicated that population growth in the suburbs actually continued to remain stronger than growth in the cores.21 In other words, growth in the entire metropolitan area was understood, by some, to reflect a preference for “city living.” But metropolitan areas include large swaths of what we generally think of as “suburban living,” with automobiles playing a central role. And it has been these functionally suburban (and exurban) areas that have attracted nearly all metropolitan area growth since World War II.
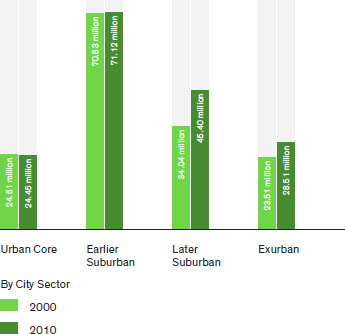
Between 2000 and 2010, the share of the metropolitan population that resided in the urban cores declined from 16.1 percent to 14.4 percent. (fig. 2.3.3) Urban cores lost approximately 160,000 residents in the fifty-two metropolitan areas, despite gains in what might be called the “micro-cores”—areas in or adjacent to the CBDs. Census data indicate that there was a total gain of two hundred thousand residents within two miles of major metropolitan area cores. However, the same data indicate that the gain was more than offset by losses in the ring that falls between two and five miles from the city halls.22
2.3.3 Population by functional sectors. Major metropolitan areas: 2000–2010. All 2000–2010 population growth was in lower density, automobile-oriented neighborhoods.
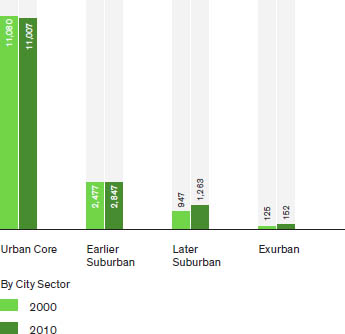
Urban cores had the highest population density in 2010, at eleven thousand people per square mile (about 4,250 people per square kilometer). The earlier suburban areas were less than a quarter as dense, while the later suburbs were about one-half as dense as the earlier suburbs. Densities were little changed between 2000 and 2010 in the urban cores and earlier suburbs, but rose in the later suburbs and the exurbs, where more vacant land was available for greenfield development. (fig. 2.3.4)
2.3.4 Population density by functional sectors. Major metropolitan areas: 2000–2010. Population densities are much lower outside the urban cores.
Interestingly, the shares of population in urban cores ranged substantially. In only two metropolitan areas did the urban core account for more than one-third of the population: New York at 52 percent and Boston at 33 percent. Some metropolitan areas had little or no urban core population. Some of the newer and fastest-growing metropolitan areas were too small, too sparsely settled, or insufficiently dense to have strong urban cores.
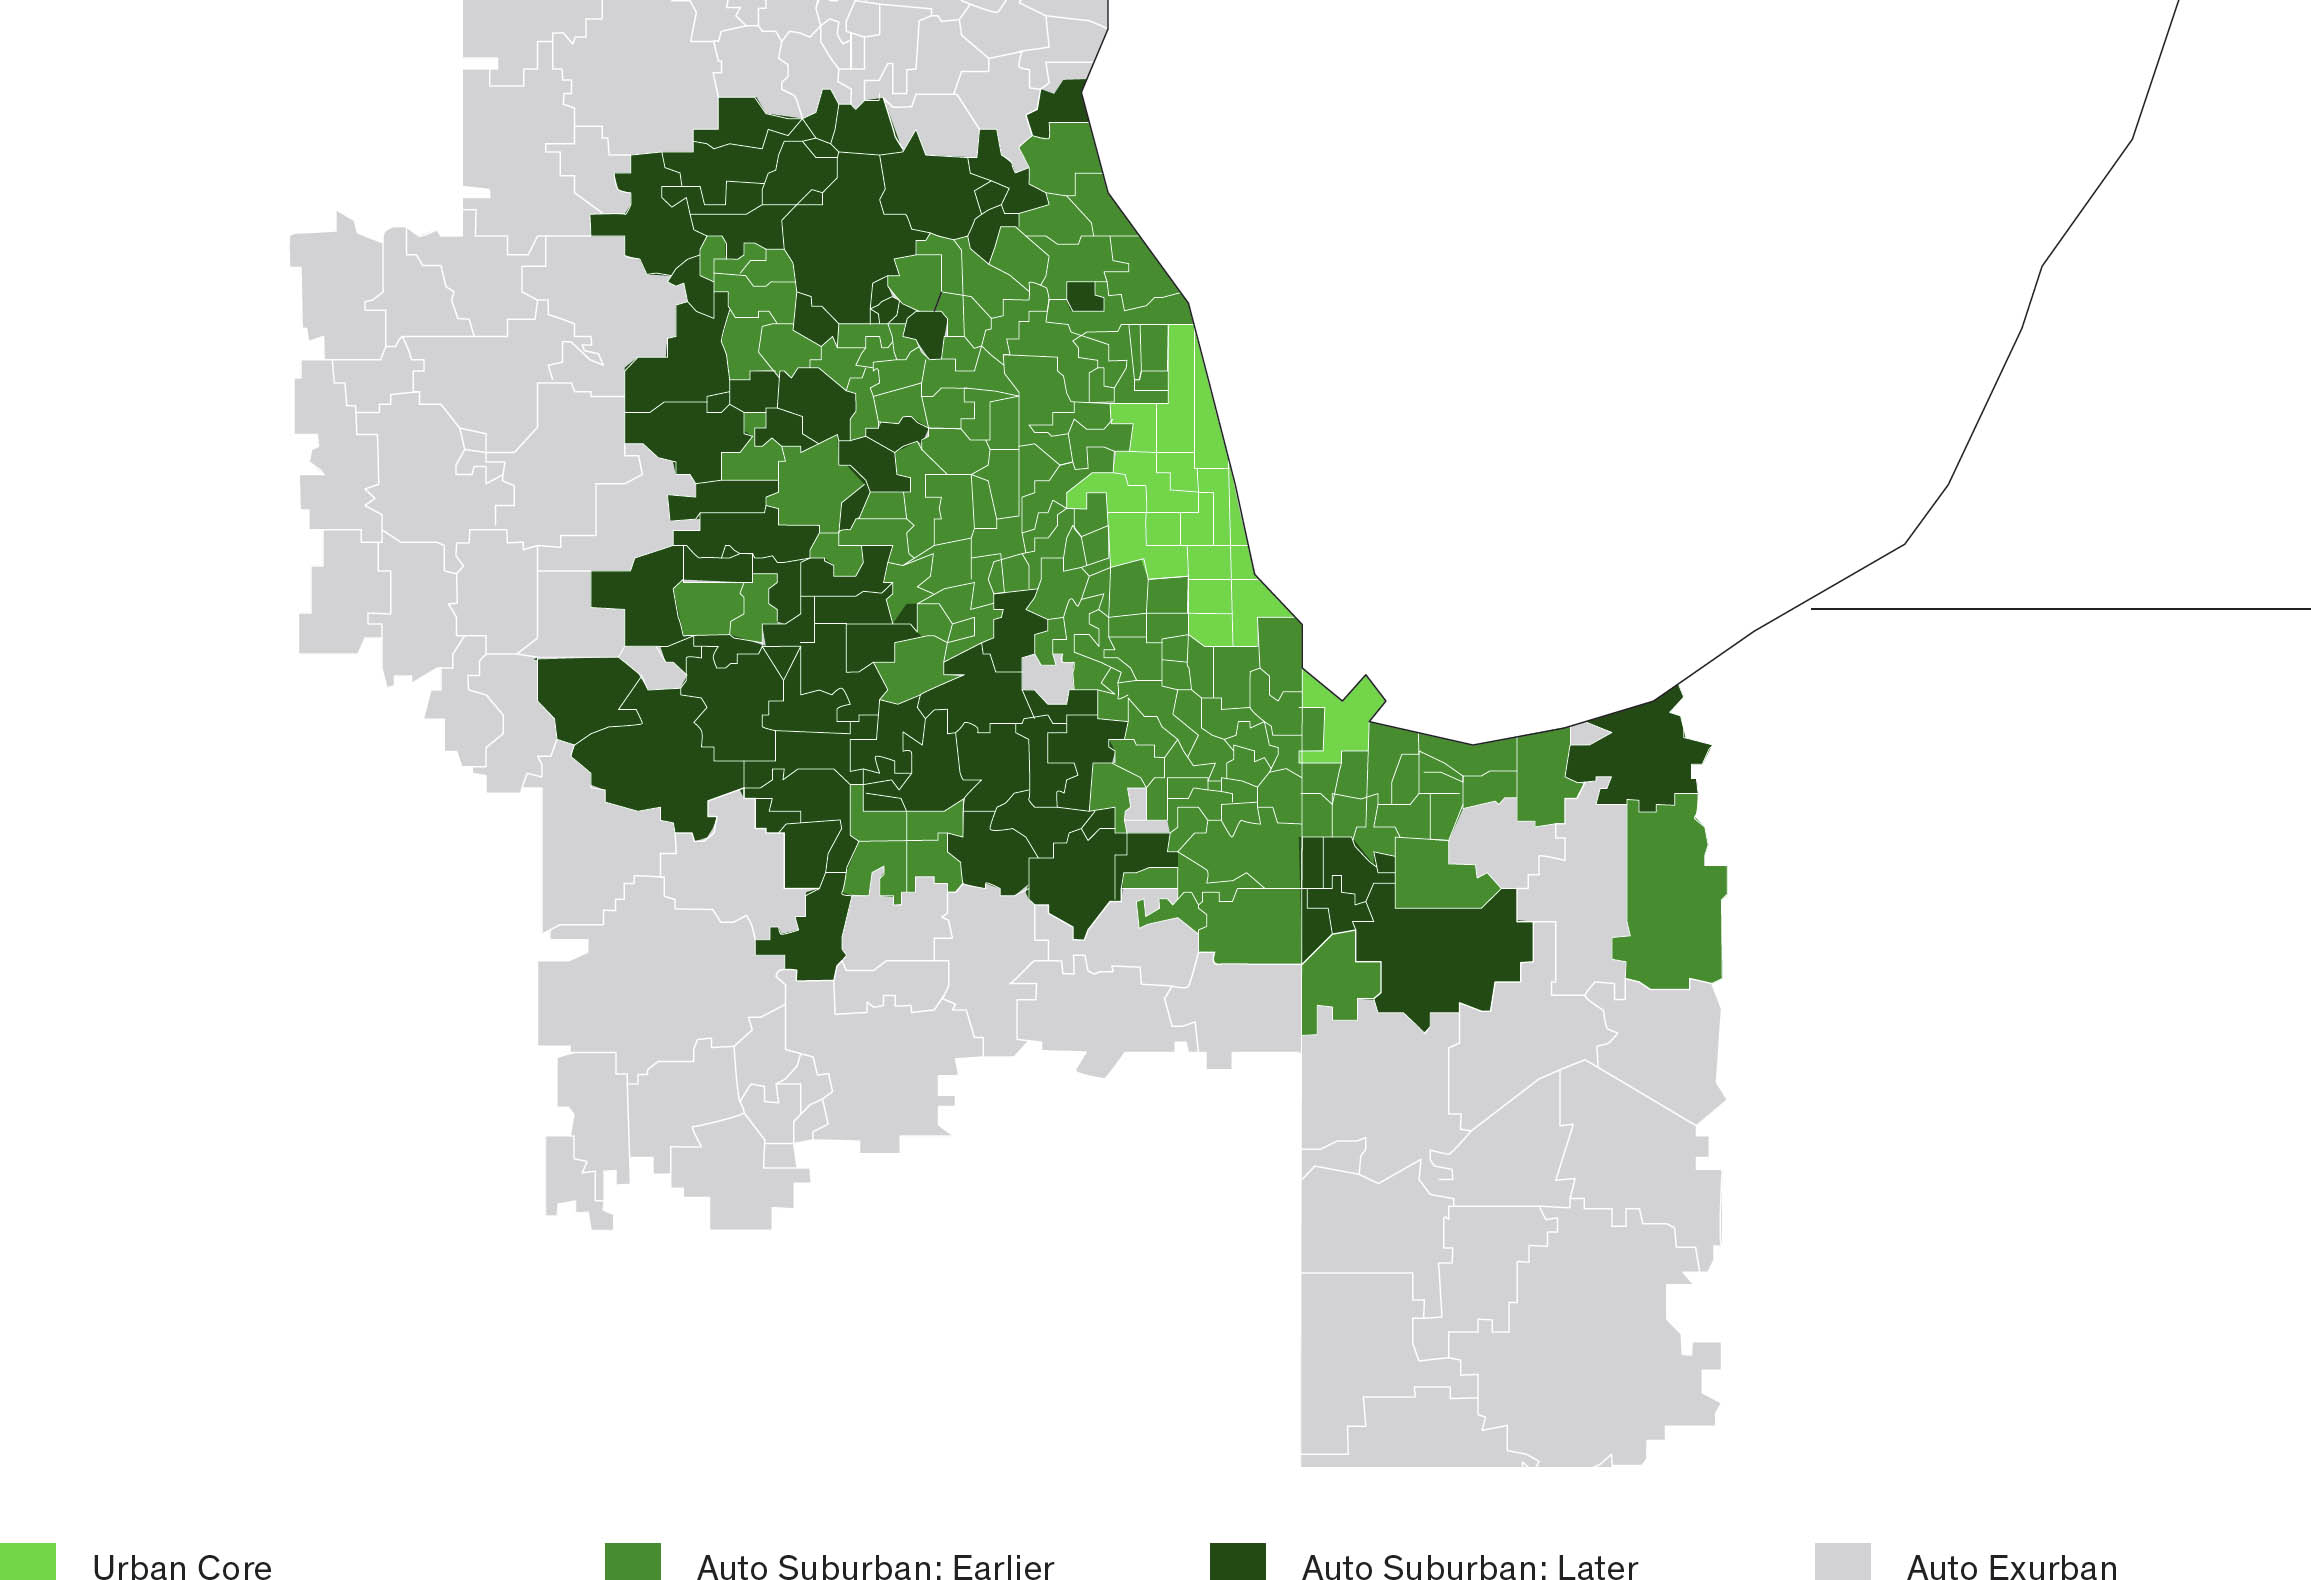
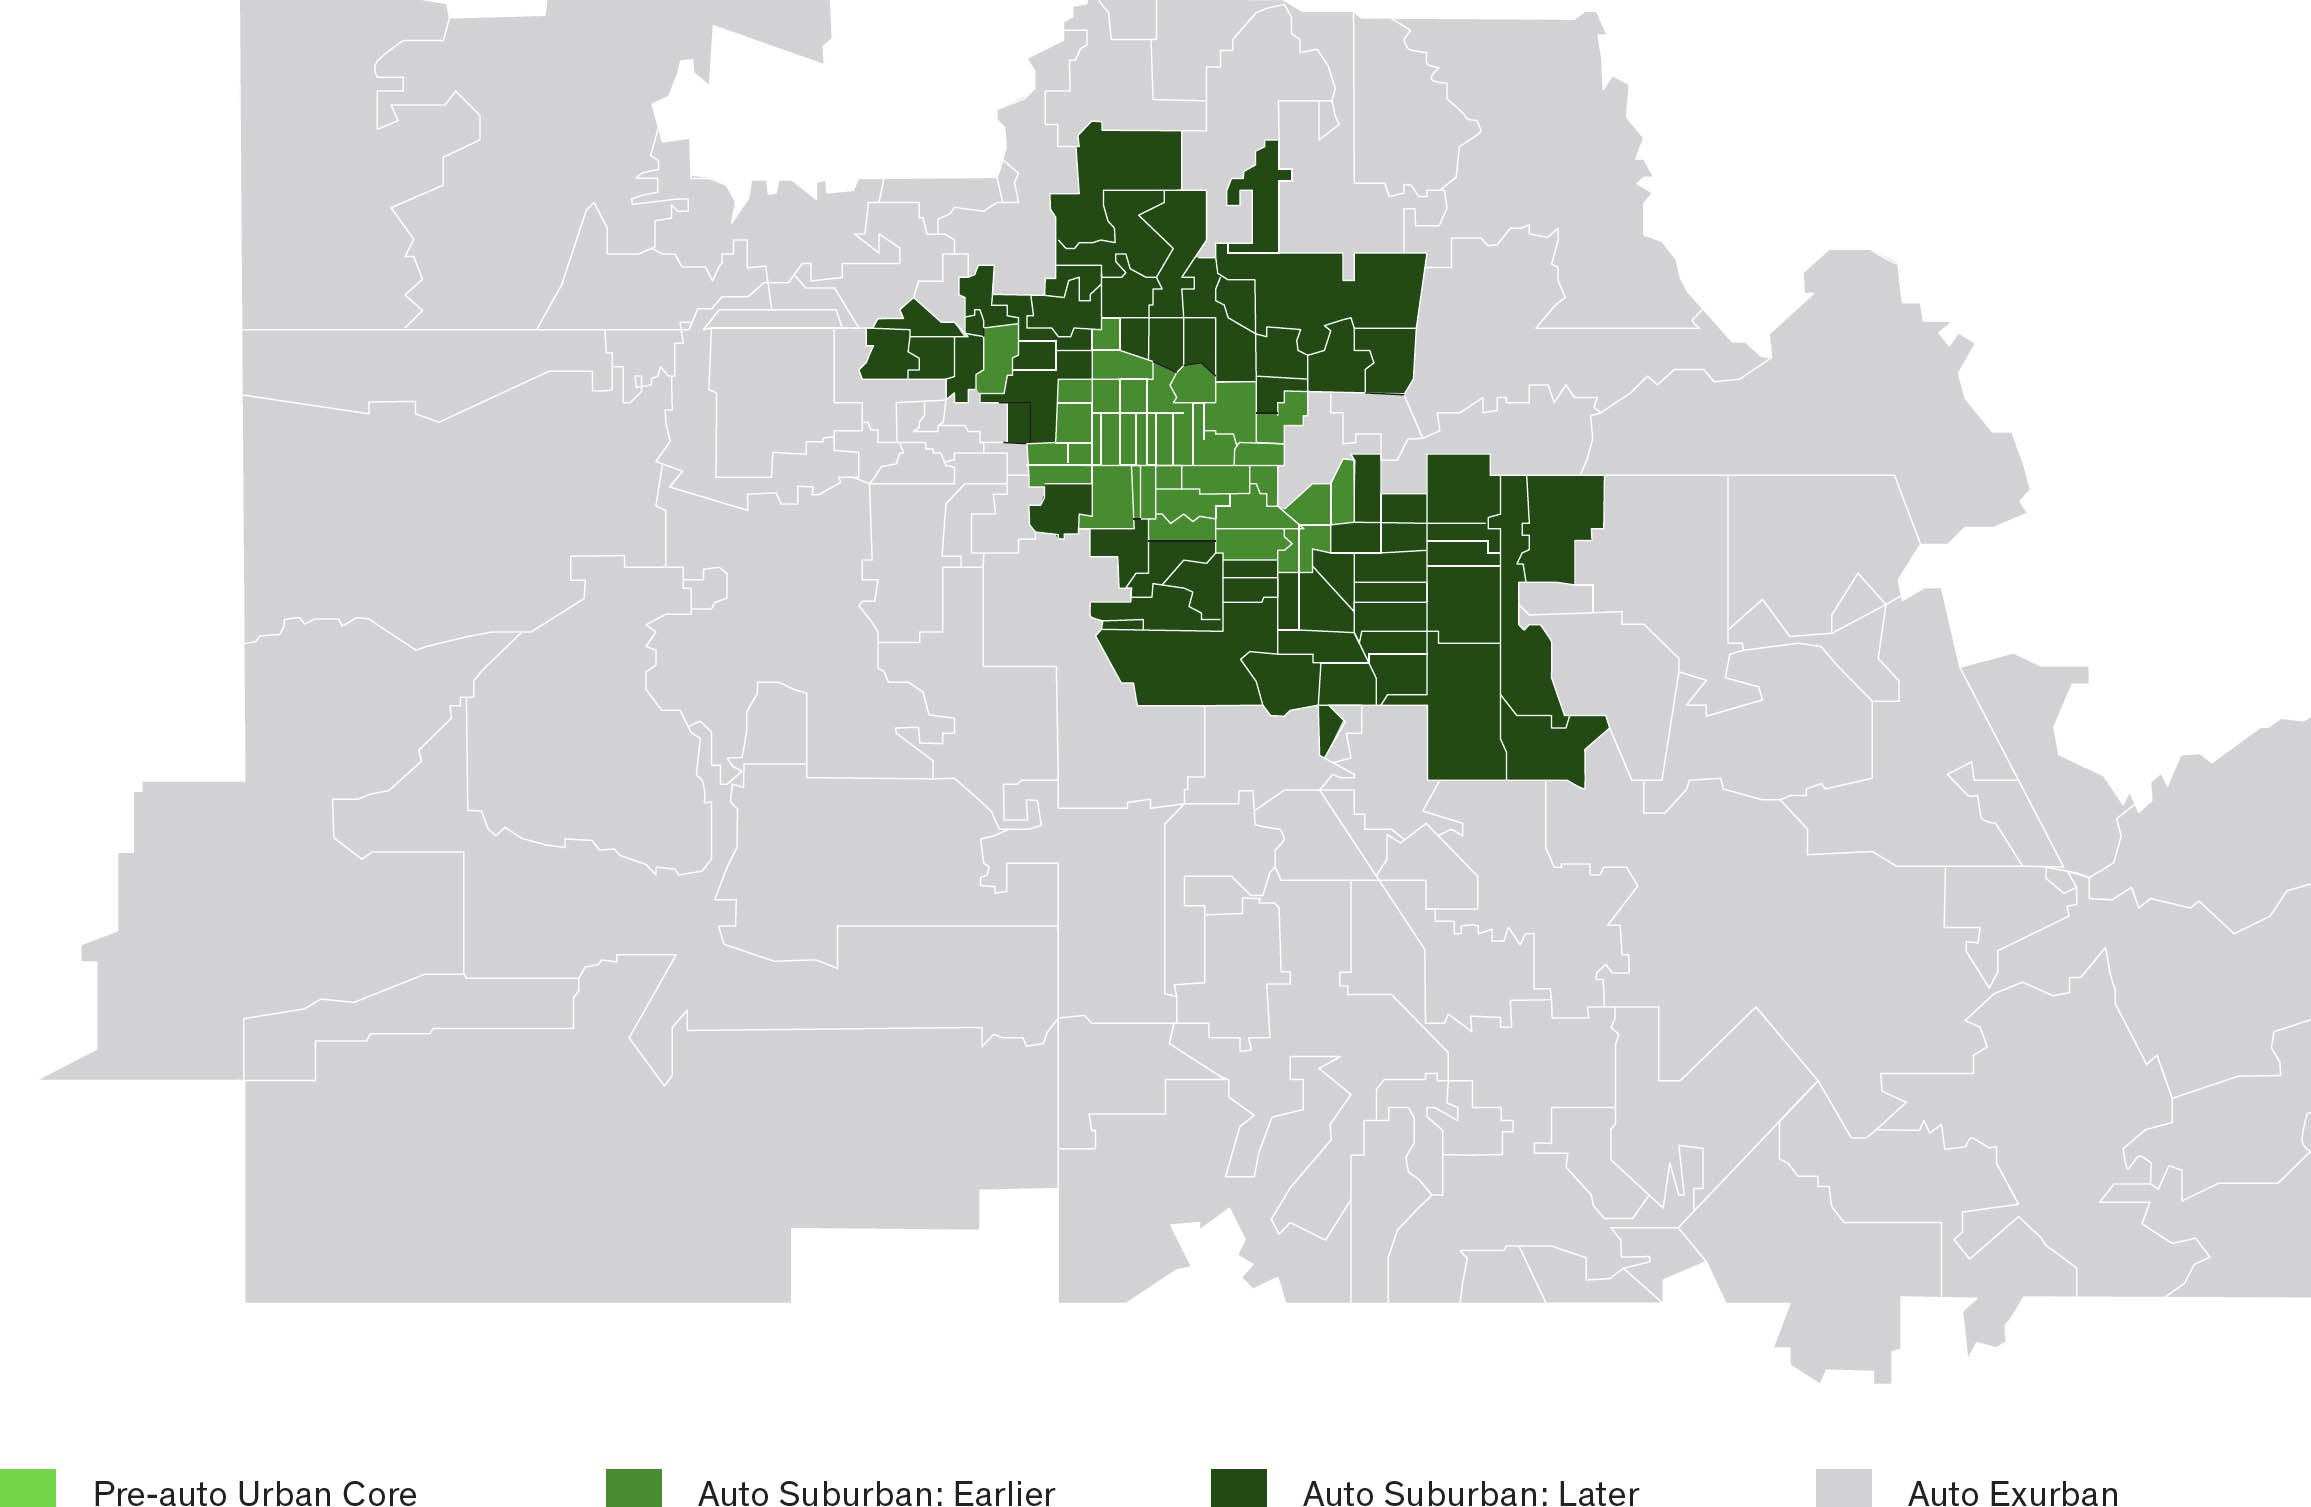
Our analysis reveals three general metropolitan typologies of growth, based on the time period, which result in large, small, or almost nonexistent urban cores. Chicago is an example of an older metropolitan area that experienced strong growth in the nineteenth century. It has a large, prewar urban core, which accounts for 26 percent of the population. Seattle experienced strong growth in the first half of the twentieth century, yielding a smaller urban core, containing 8 percent of the population. (fig. 2.3.5) Phoenix may be the most typical example of a postwar metropolitan area, with virtually no urban core. Since 1940, the Phoenix metropolitan area has grown from 120,000 residents to more than 4 million, with virtually all growth being suburban. In each of these metropolitan areas, most of the land and population are in suburban areas. And in 2010 virtually all of the population growth in municipal cores was in their suburban (and exurban) sectors. (fig. 2.3.6)
2.3.5 Chicago: 2010. City with large pre-auto urban core. Most of the Chicago metropolitan area is post–World War II suburban and automobile oriented.
2.3.6 Phoenix: 2010. City without a pre-auto urban core. All of the Phoenix metropolitan area is post–World War II suburban and automobile oriented.
According to Census Bureau County Business Patterns data, there was a reduction of 1.7 percent in major metropolitan area employment between 2000 and 2010.23 (fig. 2.3.7) The entire decline of 3.74 million jobs was in the urban core and the older suburbs. Despite the overall employment reduction, jobs increased by 2.67 million in both the newer suburbs and the exurbs. (fig. 2.3.8)
2.3.7 Employment by functional sectors. Major metropolitan areas: 2000–2010. All employment growth was in the newer suburbs and exurbs between 2000 and 2010.
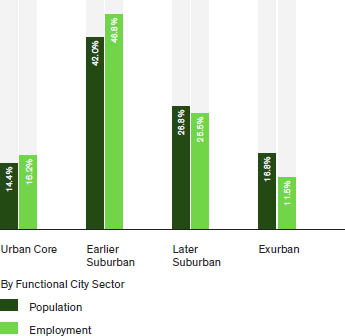
2.3.8 Population and employment locations: 2010. City sectors: Major metropolitan areas. Resident worker population and jobs are relatively well balanced in the city sectors.
The net effect on employment shares was to transfer 4.8 percentage points of total employment from the urban cores and older suburbs to the newer suburbs and exurbs. The urban core share of employment dropped from 16.4 percent to 16.2 percent, while the share in older suburbs dropped from 51.4 percent to 46.8 percent. The share of jobs in the newer suburbs and exurbs combined rose from 32.2 percent to 37.0 percent.
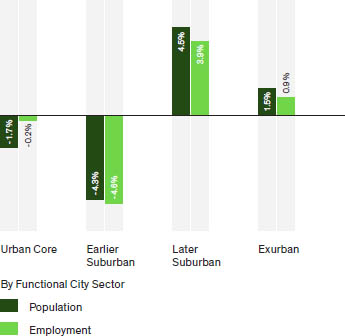
Employment dispersion is following that of the population, especially in the older and newer suburbs. Employment growth has been tracking population growth for decades, as cities have evolved from being monocentric to polycentric. Thus, employment patterns have dispersed accordingly. (figs. 2.3.9–10)
2.3.9 Population and employment: 2000–2010. Percentage point change by city sector. Resident worker population and job trends were similar by city sector from 2000 to 2010.
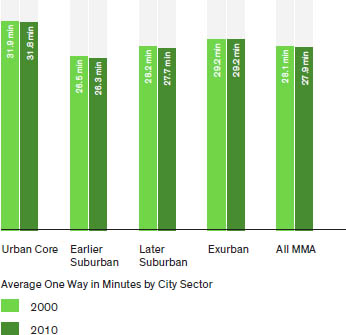
2.3.10 Work trip travel time 2000 and 2010. Major metropolitan areas. Work trip travel times are the least for residents in earlier suburban areas and the most in the urban core.
There is a perception that commuters living farthest from the urban core spend the most time traveling to work. However, the data indicate that the longest average travel times are experienced by residents who are closest to the urban core.
Since the largest share of both population and employment is in the older suburbs, rather than the urban core, it’s not surprising that resident workers in the newer suburbs have the shortest work trip travel times, at 26.3 minutes, and commute times of 27.7 minutes. Urban core residents have average one-way work trip travel times of 31.8 minutes. Those living the farthest from the urban core, in the exurbs, have one-way work trip travel times of 29.2 minutes. (fig. 2.3.11)
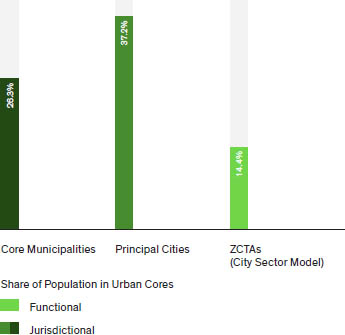
2.3.11 Urban core population share. Major metropolitan areas: 2010. Functionally urban populations are much less than core and principal city populations.
More than a quarter century ago, at the University of Southern California, Peter Gordon and Harry Richardson concluded that “the co-location of firms and households at decentralized locations has reduced, not lengthened commuting times and distances.”24 Decentralization reduces pressures on the CBD, relieves congestion, and diminishes gridlock. The dispersed and well-coordinated location of jobs and residences may be a reason why commute times and traffic congestion are lower in US metropolitan areas than in those of Europe, Australia, and Canada.25
At the same time, government transportation spending has not reflected the realities of where people live and work. Expenditures on transit are proportionally higher on transit than on roads. Transitcarries 1 percent of personal travel and virtually no freight.26 Roads carry 98 percent of travel and all surface freight that is not moved by rail or waterway. Yet, at all levels of government, expenditures on transit are 22 percent of total road and transit expenditures.27
Despite the often-expressed perception that Americans are giving up their cars, driving alone dominates commuting numbers with a metropolitan share of 73.5 percent of commuters as of 2010. Among urban core residents, the share of those who drove alone was down slightly, as was the case in the newer suburbs. However, the older suburbs and exurbs had slightly increased drive alone shares. Yet, in absolute terms, the overall number of commuters driving alone increased by 6.1 million and rose in all city sectors. Most notably, this increase is nearly equal to the total number of major metropolitan area residents commuting by transit (6.2 million).
Transit’s share of work trips by urban core residents rose a full 10 percent, to 32.7 percent. There were also small transit commuting gains in the suburbs and exurbs. Transit commuting has always been strongest in urban cores (especially commutes into CBDs) because of a strong concentration of destinations. The lack of such concentrations outside CBDs, even in suburban centers, explains the small transit shares to such locations. Approximately 55 percent of transit commuting in the United States is to destinations within the six “transit legacy cities” of New York, Chicago, Philadelphia, San Francisco, Boston, and Washington, DC. In each of these municipalities, more than 40 percent of commuters to CBDs use transit, with a high of more than 75 percent in New York’s Manhattan south of Fifty-Ninth Street.28
Between 2000 and 2010, transit commuting trips increased by approximately 975,000 overall, 61 percent of which was in the urban core. Like transit, the increase in commuting trips by nonmotorized modes (walking and cycling) of 400,000 was concentrated among urban core residents (54 percent). By contrast, working at home increased by approximately 1.25 million, but this increase was more dispersed among city sectors. Only 14 percent of the increase in working at home was in the urban cores, nearly the same as the urban core share of the metropolitan area population. Each of these three modes of work access is an alternative to driving, a major goal of many regional transportation plans. Yet the gains in two of these modes are concentrated in the urban core of metropolitan areas, where population is declining. The exception in gains is in working at home, where suburban increases are similar to the share of population.
The preference for detached housing was evident across the city sectors between 2000 and 2010. Overall, there was a 14 percent increase in detached housing in the major metropolitan areas, where detached housing rose the most (35 percent) in the newer and exurban areas (24 percent). The number of detached houses increased 2.8 million in the newer suburbs, and 1.5 million in the exurban areas. A smaller 50,000 increase in detached houses was registered in the older suburbs.
The increase of 4.4 million detached housing units is six times that of multifamily housing (owned and rented apartments), at 700,000. There were slight decreases in the number of multi-family houses in both the urban cores and the older suburbs. At the same time, multifamily housing increased by 800,000 units in the newer suburbs and 17,000 in the exurbs.29
Families with children are moving farther out in metropolitan areas. The proportion of primary and secondary school–age children (ages five to fourteen) has dropped in the urban cores. Between 2000 and 2010, the share of this age group living in the urban cores dropped from 15 percent to 12 percent.
There have been recent anecdotal reports claiming that a large share of younger adults aged twenty to twenty-nine (millennials) has been moving to urban cores. Between 2000 and 2010, there was an increase of 310,000 younger adults in urban cores. Yet only 12 percent of the younger adult population increase was in the urban core, with the 88 percent balance in the suburbs and exurbs. Overall, the percentage of major metropolitan area younger adults living in the urban cores declined between 2000 and 2010. The young-adult increase was more than four times as great in the newer suburbs, and twice as high in the exurbs in comparison to the urban core. Further, approximately 40 percent of the national increase in the younger adult population was outside the major metropolitan areas.
Similarly, there have been frequent press reports that baby boomers, those born between 1945 and 1964, are abandoning the suburbs and moving to the urban cores. The trend has been the opposite. Contrary to some reports, between 2000 and 2010, the population of baby boomers dropped 1.15 million in the urban cores, a reduction of 17 percent. A decline was also registered in the older suburbs, while increases occurred in the newer suburbs and exurbs. Overall, the major metropolitan areas lost 2.2 million boomer generation residents, while areas outside the major metropolitan areas added approximately 350,000.
It has also been anecdotally reported that older adults have been moving into the urban cores and away from suburban and exurban areas. The data show otherwise. Between 2000 and 2010, urban-core older populations declined by more than 100,000 residents. In contrast, the suburbs and exurbs added 2.8 million seniors, with the largest share in the newer suburbs (1.64 million). Senior populations also rose strongly outside the major metropolitan areas, with an increase of 2.67 million.
The 14.4 percent of the major metropolitan area population classified as urban core under the city sector model is considerably less than would be indicated by conventional, jurisdiction-based analyses. A core municipality analysis would yield a nearly double 26 percent, and a principal city analysis would result in a 37 percent urban core share.
Further, the city sector model analysis indicates a continuing dispersion of US metropolitan areas into the suburbs and exurbs between 2000 and 2010. Overall, suburbs and exurbs accounted for all of the population growth, employment growth, senior growth, baby boomer generation growth, school-age children growth, and nearly all of the millennial generation growth. And there has been virtually no shift away from driving during commutes in the major metropolitan areas.
The smaller area analysis in the city sector model provides a substantially finer-grained and more reflective picture of trends within the metropolitan area. In some cases, this analysis has shown anecdote-based conceptions of suburban decline to be generally incorrect. This need not be a concern for advocates of the urban core. The metropolitan area, which is the modern city, will perform best if all its parts prosper. The prosperity of the urban core does not require suburban decline, nor does the prosperity of the suburbs require urban-core decline.
2 Labeled variously, such as urban containment, compact city policy, smart growth, growth management, etc.
3 See, for e.g., Kenneth T. Jackson, “Urban Deconcentration in the Nineteenth Century: A Statistical Inquiry,” in The New Urban History: Quantitative Explorations by American Historians, ed. Leo F. Schnore (Princeton, NJ: Princeton University Press, 1975); Dana Ferric Weber, The Growth of Cities in the Nineteenth Century: A Study in Statistics (New York: Macmillan, 1899).
4 Data from US Census Bureau, “Historical Statistics of the United States: Colonial Times to 1970” (Washington, DC: US Department of Commerce, 1975).
5 Calculated from the “2013 American Community Survey,” US Census Bureau, accessed December 15, 2015, https://www.census.gov/programs-surveys/acs/; and “Highway Statistics 2013,” US Department of Transportation, accessed December 15, 2015, https://www.fhwa.dot.gov/policyinformation/statistics/2013/.
6 Cities as referred to in this essay are either urban areas (areas of continuous urban development, as generally defined by the US Census Bureau, also called the physical city) or metropolitan areas (urban areas with peripheral commuting sheds, also called the functional city). This is to be contrasted with cities as municipalities or local authority areas, which in the United States and Canada (and most of the world) are subcomponents of urban areas or metropolitan areas; Wendell Cox, “US Urban Personal Vehicle & Public Transport Market Share from 1900,” in United States Urban Transport Statistics: A Compendium, Demographia report, December 2008, accessed November 6, 2015, http://www.publicpurpose.com/ut-usptshare45.pdf.
7 Derived from US Census Bureau data. Urban and rural definitions have changed over the period. This estimate combines the 1940 to 1950 change under the previous definition with the 1950 to 2010 change under the current definition. A simple subtraction of the 1940 data from 2010 yields a 99 percent urban growth figure, though it does not account for the change in urban definition.
8 The actual decline was greater because of a significant change in the “building blocks” of urban areas. In 1950 the smallest building block was the municipality. In 2010 the smallest building block was the census block. In both cases, population densities were the principal criteria. As a result, in 1950 municipalities with large rural areas (such as the city of Los Angeles) were completely included in urban areas, forcing densities down. Census blocks have little or no rural area, making them more reflective of built-up urbanization. The Census Bureau estimated that the change in criteria (made for the 2000 census) increased urban densities at that time by about 7 percent. The percentage increase from 1950 would have been greater, because much of the rural area within municipal boundaries had become urban. See Wendell Cox, “Urban Areas in the United States: 1950 to 2010 Principal Urban Areas in Metropolitan Areas over 1,000,000 Population in 2010,” Demographia, March 31, 2012, accessed November 6, 2015, http://www.demographia.com/db-uza2000.htm.
9 For the purposes of this essay, there are fifty-four core municipalities, which are defined as the largest municipalities in the fifty-two major metropolitan areas (more than one million in population in 2013), with the following exceptions. Norfolk is the core municipality of Virginia Beach (suburban Virginia Beach has become the largest city in the metropolitan area). In addition, Oakland, in the San Francisco metropolitan area, and St. Paul, in the Minneapolis–St. Paul metropolitan area, are also core municipalities. See Wendell Cox, “Major Metropolitan Area and Core Municipality Population: 1950 and 2010 (Metropolitan Areas over 1,000,000 in 2013),” Demographia, accessed January 10, 2015, http://www.demographia.com/db-19502010mmsa.pdf.
10 The Office of Management and Budget (OMB) defines metropolitan area criteria in the United States. As used in this essay, exurban means generally outside the continuously built-up urban area.
11 Office of Management and Budget of the United States, “Final Report and Recommendations from the Metropolitan Area Standards Review Committee to the Office of Management and Budget Concerning Changes to the Standards for Defining Metropolitan Areas,” Federal Register, 2000.
12 Joel Garreau, Edge City: Life on the New Frontier (New York: Doubleday, 1991).
13 Wendell Cox, “Urban Cores, Core Cities and Principal Cities,“ New Geography, accessed January 9, 2015, http://www.newgeography.com/content/004453-urban-cores-core-cities-and-principal-cities.
14 Historical core municipalities, which include the largest municipalities in fifty-one metropolitan areas, plus Norfolk (instead of Virginia Beach), and second municipalities in San Francisco (Oakland) and Minneapolis–St. Paul (St. Paul). See Major Urban Areas: 2010 (Largest Urban Areas in Metropolitan Areas over 1,000,000) Classified by Historical Core Municipality and Suburban Jurisdictions.
15 A number of articles have been published at newgeography.com. There is an index at “City Sector Model” at http://www.newgeography.com/category/story-topics/city-sector-model. Maps are available at Demographia City Sector Model Metropolitan Area Maps, at http://www.demographia.com/csm-maps.pdf. Wendell Cox, “From Jurisdictional to Functional Analysis of Urban Cores and Suburbs,” New Geography, accessed January 9, 2015, http://www.newgeography.com/content/004349-from-jurisdictional-functional-analysis-urban-cores-suburbs.
16 David L. A. Gordon and Mark Janzen, “Suburban Nation? Estimating the Size of Canada’s Suburban Population,” Journal of Architectural and Planning Research 30, no. 3 (2013): 197–220.
17 David L. A. Gordon and Isaac Shirokoff, “Suburban Nation? Population Growth in Canadian Suburbs, 2006–2011,” Council for Canadian Urbanism, School of Regional and Urban Planning, Queen’s University, 2013, accessed November 6, 2015, http://www.canadianurbanism.ca/wp-content/uploads/2014/07/CanU%20WP1%20Suburban%20Nation%202006-2011%20Text%20and%20Atlas%20comp.pdf.
18 See, for e.g., Jed Kolko, “No, Suburbs Aren’t All the Same. The Suburbiest Ones Are Growing Fastest,” City Lab, February 15, 2015, accessed April 26, 2015, http://www.citylab.com/housing/2015/02/no-suburbs-arent-all-the-same-the-suburbiest-ones-are-growing-fastest/385183/.
19 The principal urban area is the largest continuously built-up urban area in the metropolitan area. In two cases, adjacent urban areas were added to the largest urban area, resulting in a larger principal urban area. Mission Viejo was added to Los Angeles and Concord was added to San Francisco.
20 The median house age specification is an additional criterion and, as a result, does not interfere with the possibility of a ZCTA becoming urban core if its densities and transit, walking, and cycling commute shares rise sufficiently.
21 Joel Kotkin and Wendell Cox, “Cities and the Census,” City Journal, accessed January 9, 2015, http://www.city-journal.org/2011/eon0406jkwc.html.
22 Wendell Cox, “Flocking Elsewhere: The Downtown Growth Story,” New Geography, accessed January 9, 2015, http://www.newgeography.com/content/003108-flocking-elsewhere-the-downtown-growth-story.
23 US Census Bureau. County Business Patterns provides data principally for private-sector employment.
24 Peter Gordon and Harry W. Richardson, “Gasoline Consumption and Cities: A Reply,” Journal of the American Planning Association 55, no. 3 (Summer 1989): 342–46.
25 Wendell Cox, “Urban Travel and Urban Population Density,” Journeys, accessed January 9, 2015, http://www.lta.gov.sg/ltaacademy/doc/J12%20Nov-p19Cox_Urban%20Travel%20and%20Urban%20Population%20Density.pdf.
26 This is all surface travel, urban and rural. In urban areas, mass transit carries 2 percent of travel.
27 Calculated from “Highway Statistics 2010,” US Department of Transportation, accessed December 15, 2015, https://www.fhwa.dot.gov/policyinformation/statistics/2010/; and the US Census Bureau, 2010.
28 Wendell Cox, “Demographia United States Central Business Districts,” Demographia, accessed January 9, 2015, http://www.demographia.com/db-cbd2000.pdf.
29 There was a reduction in single-family homes as a share of total residential building permits from 2010 to 2014 to 62.7 percent. This is below the 74.3 percentage in the 2000s and the 77.1 percentage in the 1990s. The new, lower single-family percentage is, however, above the decade rates of the 1980s, 1970s, and 1960s. Calculated from US Census Bureau data, “New Privately Owned Housing Units Authorized by Building Permits in Permit-Issuing Places,” accessed July 15, 2015, https://www.census.gov/construction/nrc/xls/permits_cust.xls.