

For centuries, cities have used containment policies to define their edges. The goal has been to prevent any suburban expansion that would enable the development of a polycentric metropolitan structure. One of the most pervasive and restrictive types of urban containment is the “greenbelt”: a circular band of landscape at the edge of a city, with low-intensity programming (passive recreation, conservation, agriculture, and forestry areas, for example) or no programmed purpose at all.1 The modern greenbelt concept originated with Ebenezer Howard and Raymond Unwin in their garden city movement during the late nineteenth century, although variations of the idea—sometimes conceived as a void or a “green lung”—have been around for hundreds of years.2
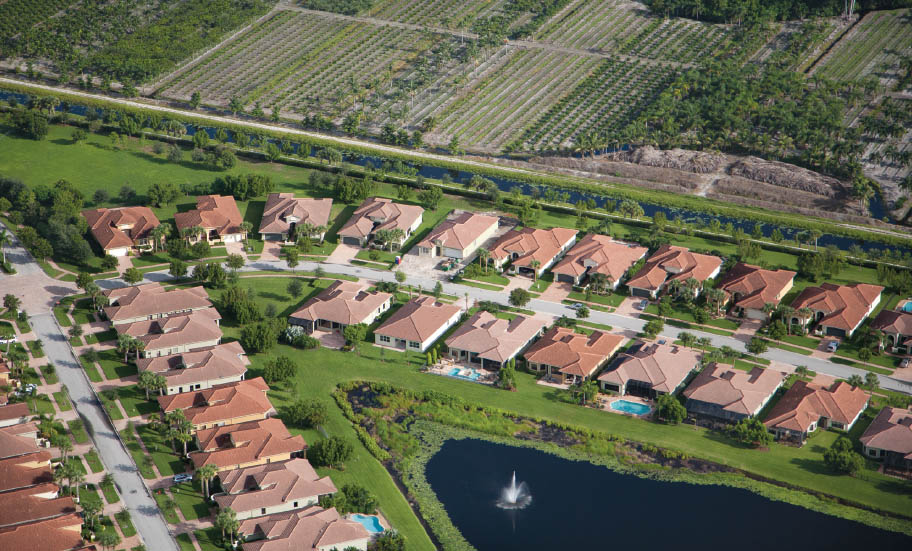
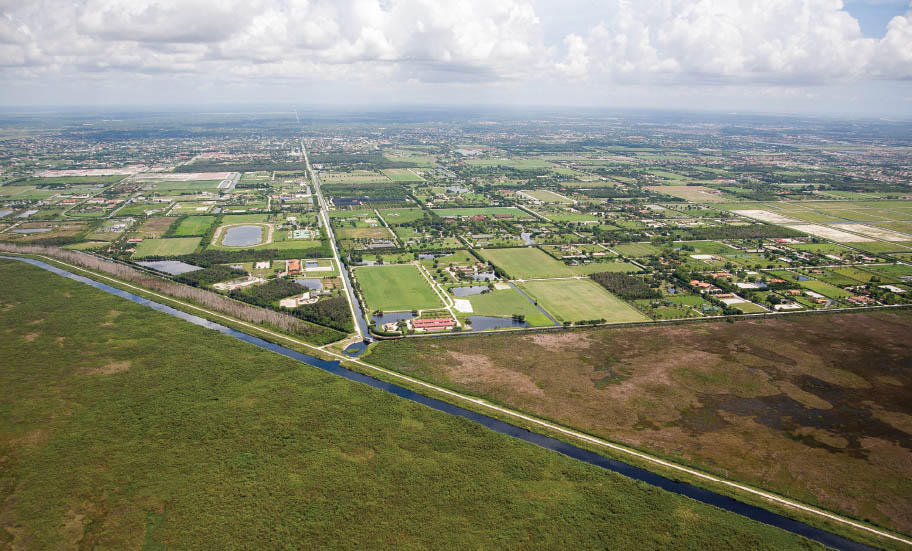
From a city planning perspective, greenbelts have several key characteristics (fig. 4.7.1). They are intended to restrict urban growth and are often preplanned to designate a city’s future urban boundary. They can also be retrofitted around urbanizing territories to redirect unplanned or speculative growth. Greenbelts are also intended to reinforce the visual or aesthetic separation of urban and rural landscapes, further hardening the dualities of city versus nature, urban versus rural.3
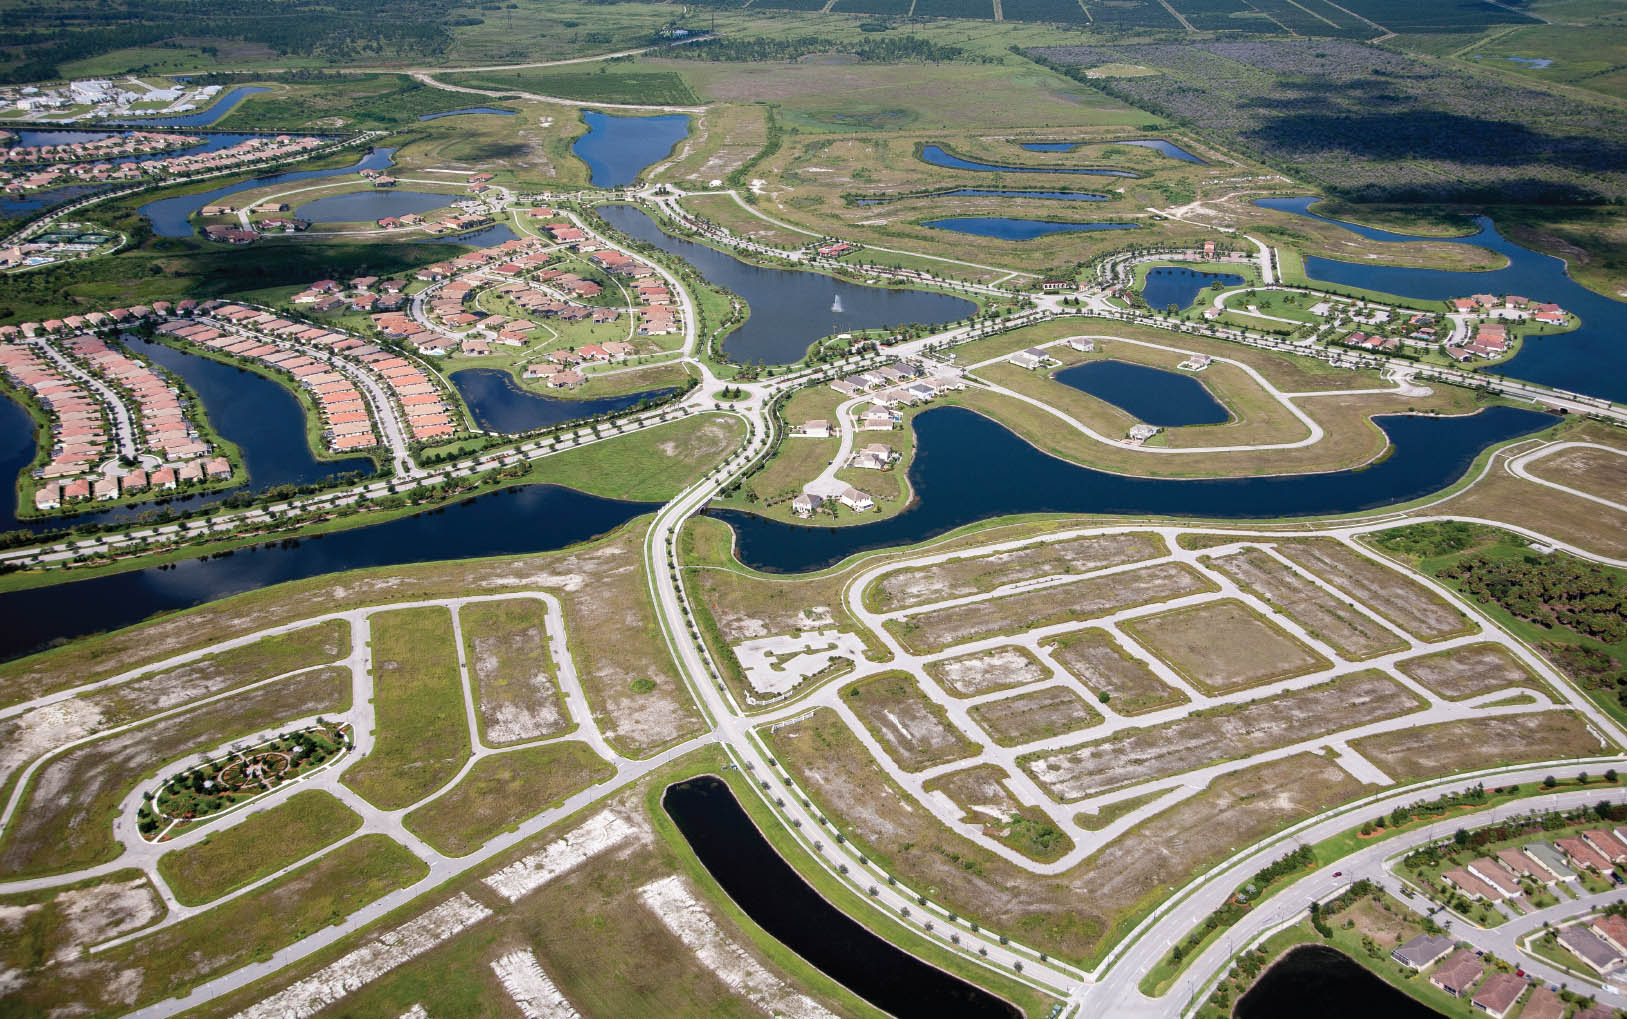
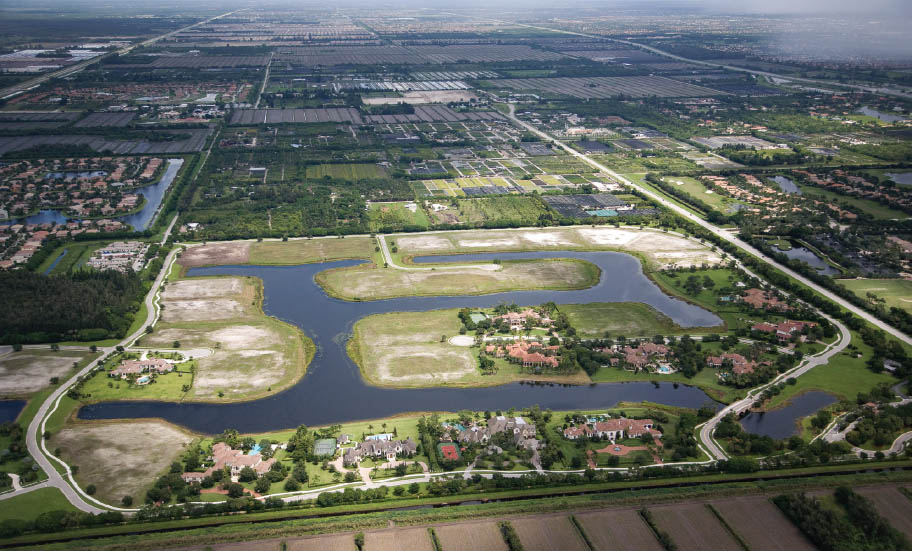
4.7.1 Agriculture Reserve, Delray Beach, Florida. Greenbelt edges can take many forms. This new planned unit development is directly adjacent to an agricultural reserve. No new development is permitted in the reserve landscape.
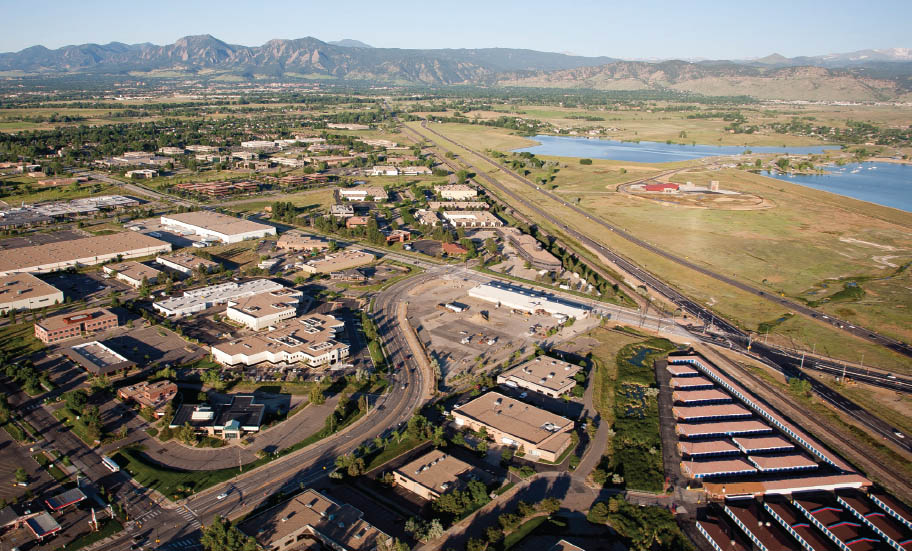
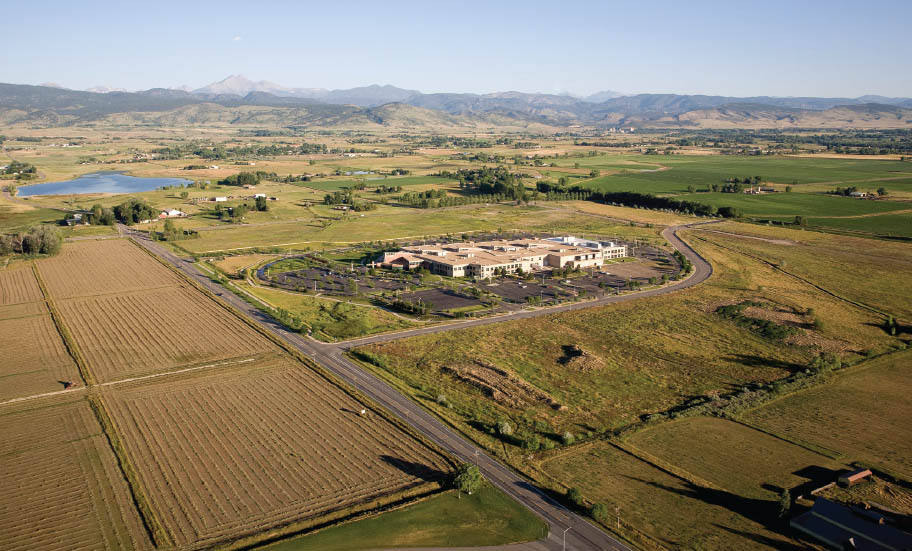
They are intended to be static, immutable forms. But, as history shows, they inevitably succumb to unplanned change, especially when they are implemented on the fringe of a city. The fringe is one of the most dynamic, complex, and frequently misunderstood manifestations of urbanization. By extension, the greenbelt concept should be reexamined as a fringe tool, especially since, over the past decades, greenbelts around the world have lost much of their effectiveness. New development and unforeseen uses have eroded their boundaries and disrupted their intended uses, while unchecked suburbanization has leapfrogged beyond them. (fig. 4.7.2)
4.7.2 Leapfrog development along Diagonal Highway, Boulder, Colorado, just outside Boulder’s restrictive greenbelt
Despite a clear failure to achieve the proposed goals, especially at the fringe, the use of greenbelts has proliferated. Why do planners uncritically default to the creation of greenbelts as a means of controlling growth? Which, if any, greenbelt strategies have been successful? Is the concept of greenbelting flexible enough to receive new meanings and new programming as cities change over time?
These questions are critical. Rapid urban expansion and population growth, combined with a number of other cultural, environmental, and economic factors, will continue to place enormous pressure on cities to reconsider how to control their leading suburban fringes. Greenbelts have not adapted to the realities of these changes. They no longer work well as urban containment tools, but they can be reconceptualized to serve other crucial functions. For example, biodiversity, water storage and purification, energy production, food cultivation and processing, affordable housing, and recreational networks can all be explored in new, interesting ways at the suburban fringe. Today’s overreliance on unsustainable, engineered, and expensive solutions to provide cities with natural resources doesn’t make sense when greenbelts can perform some of these holistic functions more effectively. Ecological function needs to become a fundamental priority in metropolitan land-use decisions, and greenbelts are the vehicle for this to change to be initiated. Parallel with this change will be a paradigmatic shift in the way we teach and practice planning and design to prioritize future ecosystem services and dynamic ecological performance in urbanism. Reconceiving the dynamics of metropolitan edges, where land conversion, degradation, ecosystem service losses, and social equity are perhaps at their most extreme, should be one of the central research ambitions of urbanism itself. Contemporary urbanism desperately needs a new model for imagining the outer edges of cities—the suburban fringes where the dynamics of land conversion, environmental systems, economic production, and technological innovation can merge into new conceptions of how we live on a landscape.
From a theoretical perspective, a greenbelt transforms the space that surrounds it in unplanned ways because planners have not considered, or planned for, the services and functions a greenbelt can provide. Its capacity to enhance surrounding areas is rarely considered. It is created, fundamentally, as “negative” space, defined more by what it is not than by what it is in and of itself.4 The greenbelt is viewed as generic green space—the opposite of development—and what matters to planners is its status as “non-development.”5 As a result, greenbelts are often reduced to being aesthetically managed agrarian landscapes that provide recreation and food for the city.6
Most important, the dynamics of the suburban fringe are rarely factored into the greenbelt scheme. Urbanists are only recently recognizing the importance of the fringe. Previously, as the geographer David Simon notes, there was a significant perception that the fringe was unimportant because of its short-term, transitory nature. Thus, when development pressures mounted at the fringe, there wasn’t any framework in place for the greenbelt to ensure flexibility and the continued high performance of the landscape. However, the fringe is now recognized as a major (and persistent) phenomenon, which exists globally, has lasting effects, and is a critical site for confronting growth challenges.7
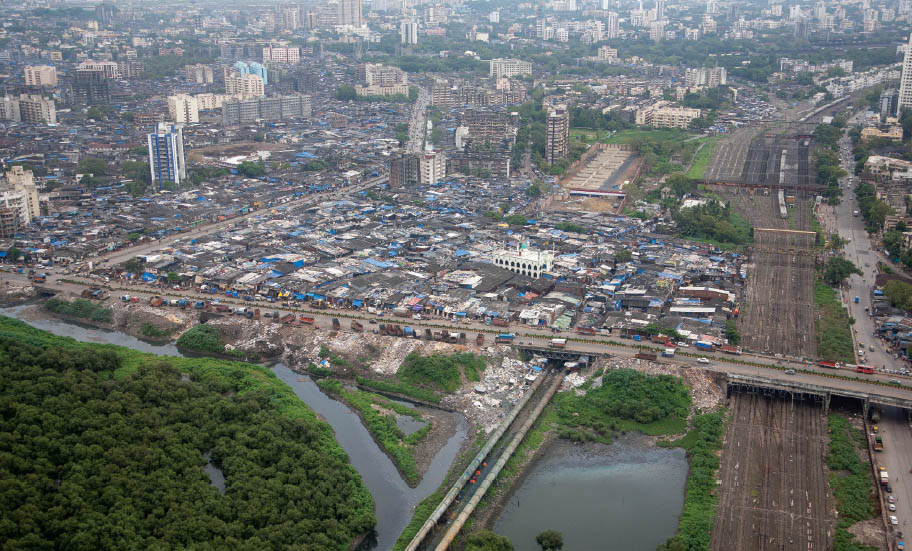
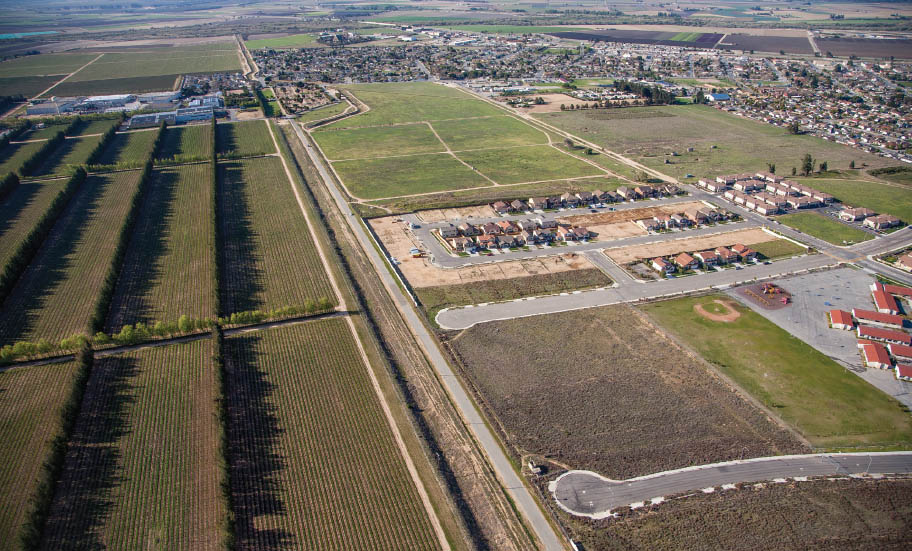
The suburban fringe—I use the term to describe a hybrid of suburb and fringe—is by nature a place of change.8 It is more or less the zone that transitions from suburban to rural land use; from a majority of housing-based uses to landscape-based uses; from recreational to industrial to fully agricultural zones.9 (fig. 4.7.3) It is a no-man’s-land of random, disaggregated, and often uncomplimentary, informal, and uncontrolled land uses. Unlike incorporated towns and cities with clearly marked edges, the suburban fringe lacks spatial distinction. It is defined more by process than form, by flows rather than boundaries. There are many types of local, regional, national, and international flows that cross each other at the fringe: people, goods, income, capital, natural resources, waste, and more. The suburban fringe is widespread globally, and as a result, there are innumerous territorial theories, terms, and concepts by academicians to describe it. Outside the United States, scholars often refer to this phenomenon as “peri-urbanization” or the “peri-urban landscape.”10 Neither urban nor rural, the suburban fringe or peri-urban landscape desperately needs the environmental stewardship capabilities and conceptual organizational capacities of landscape architects and planners. Why?
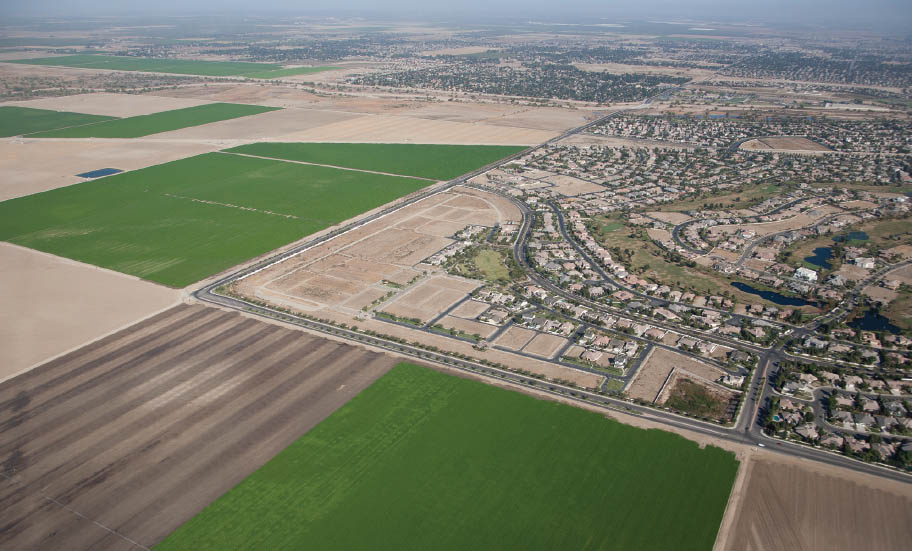
The fringe is facing massive environmental pressures, such as the need for wastewater treatment and disposal, and the threat of potable water contamination, especially in the developing world.11 Another major environmental issue at the fringe is land conversion, especially in regard to its impacts on open space preservation and agriculture production. (figs. 4.7.4–5) Additional concerns include the rate and scale of resource use, and the siting and adequacy of waste infrastructure.12 Lower-income groups often find more affordable residency on the fringe, and so are disproportionally affected by environmental degradation.13
It is significant that the suburban fringe is proliferating worldwide, especially in Asia, Latin America, and Africa. According to the East Asian planning scholar Douglas Webster, “In East Asia, the magnitude and impact of the phenomenon is, and will be, more important than in any other world region.”14 During the twenty-five years from 2002 to 2027, it is estimated that the population of peri-urban areas in East Asia will increase by approximately 200 million people, accounting for 40 percent of urban population growth in that region. In Bangkok, 53 percent of population growth from 2002 to 2022 is expected to occur outside the city proper. For Jakarta, the equivalent is 70 percent. In China, 40 percent of future urban population growth in extended urban regions that are service-oriented (Beijing, Shanghai, and Hangzhou), and over 60 percent of future urban population growth in more industrial cities (Chongqing, Chengdu, and Ningbo), is forecasted to occur in peri-urban areas. Moreover, peri-urban areas are increasingly important as sites of investment, making “the actual importance of the process in East Asia, in terms of local, national, and global impacts…even more significant than implied by the demographics.”15
Because of its unclassifiable spatial qualities and fast rate of growth, the suburban fringe has been difficult to understand and conceptualize, yet its dynamics have been radically reshaping cities.
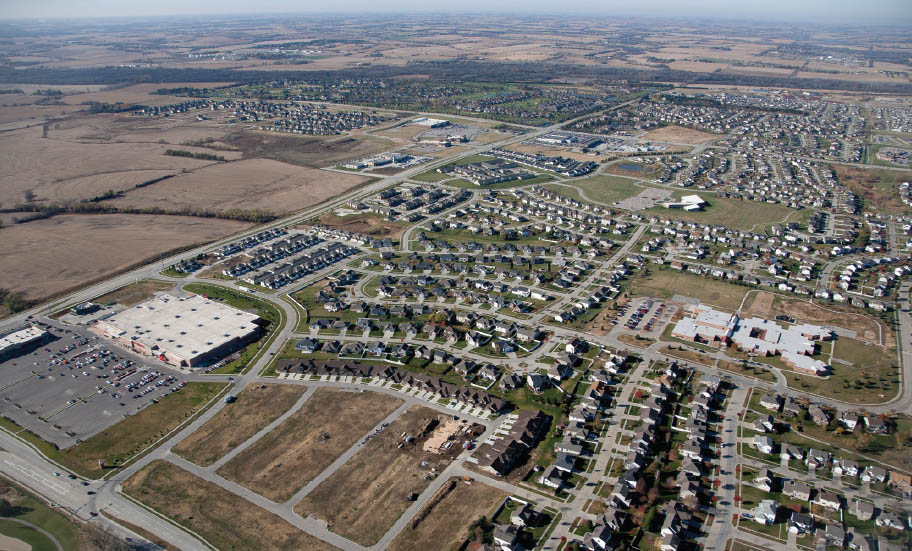
Suburban fringe dynamics have produced unprecedented spatial patterns and landscape typologies around the world. These in-between landscapes, neither rural nor urban, with their heterogeneous built forms, are often characterized by transport infrastructure to support automobiles. (figs. 4.7.6–7) Moscow, the largest city in Europe, has a suburban fringe composed of proliferating single-family homes in a unique, formal arrangement that concentrates along the highways and ring roads.16 In Western Europe, the fringe of Brussels is described as having an “urban shadow,” which forms when star-shaped urban development occurs in combination with transportation infrastructure that is overly focused on connecting urban centers, leaving “wedges” of countryside.17 Similarly, the Belgian city of Flanders has been called a new fringe prototype, resembling “neither countryside, nor cityscape, but in fact something ‘in between.’”18
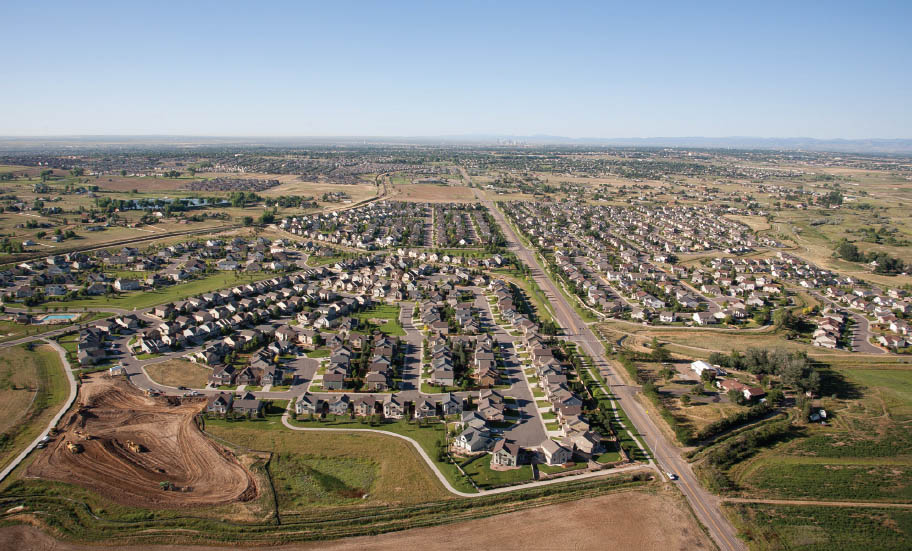
4.7.7 New suburban development north of Denver, Colorado. Layout and organization is based on single mode of automobile transportation
In Latin America, the fringes of megacities such as Mexico City, Buenos Aires, Santiago, and São Paolo contain a side-by-side mix of dissimilar activities, such as agriculture, housing, industry, recreation.19 In Southeast and East Asia, the fringe, termed desakota (city-village), is characterized by complex mosaics of juxtaposed activities previously regarded as incompatible. For example, computer assembly workshops are adjacent to rice paddy fields or coconut groves; urban-oriented activity centers such as golf courses abut rural villages; and industrial estates or themed gated communities extend into formerly agricultural lands.20 Although marginal in location, the desakota is surprisingly significant in economic terms and is evidence of the shift toward multiple urban nodes. For example, in Jakarta since the year 2000, the bulk of foreign investment has occurred at the fringe.21
Spatially, the most important phenomenon produced by fringe dynamics is the development of new urban high- and medium-density nodes, containing clusters of housing, employment, and commercial development. Instead of the traditional monocentric pattern of a high-density center that declines toward the edges, metropolitan areas that are polycentric are an inverted tent, in contrast to the tentlike density of compact European cities.
Polycentrism has emerged as the prevailing form of large metropolitan areas worldwide and is likely to continue until well into the next century.22 We define the polycentric form as a metro area consisting of a principal city along with many other spread-out nodes of density, all contributing to the regional economy. (fig. 4.7.8) For example, Mediterranean Europe’s urban areas are increasingly experiencing a change toward growth that is dispersed and horizontal, rather than vertical. Examining the Barcelona metropolitan region from 1993 to 2000, researchers concluded that widespread growth of single-family housing at the edge of metropolitan areas was linked to “high dependence on the private automobile, a strong filtering process by the property market, and [a] lack of planning,” adding, “in Barcelona and in other Mediterranean cities, the mononuclear compact city and the accompanying continuous metropolis are losing its previous and almost absolute dominance. Instead, we find a network of interrelated cities with different potentialities.”23 In Latin American megacities, the phenomenon of increasing polycentrism and the growth of secondary cities has been termed “polarization reversal.” Latin American urban form has also been described as “urban archipelagos,” characterized by diffuse boundaries and often-weak planning oversight and control.24 In Southeast Asia and East Asia, a new form of metropolitan urbanism was coined the Extended Metropolitan Region (EMR), which describes the polycentricism and expansion of urban activities into rural zones that has been occurring since the 1960s.
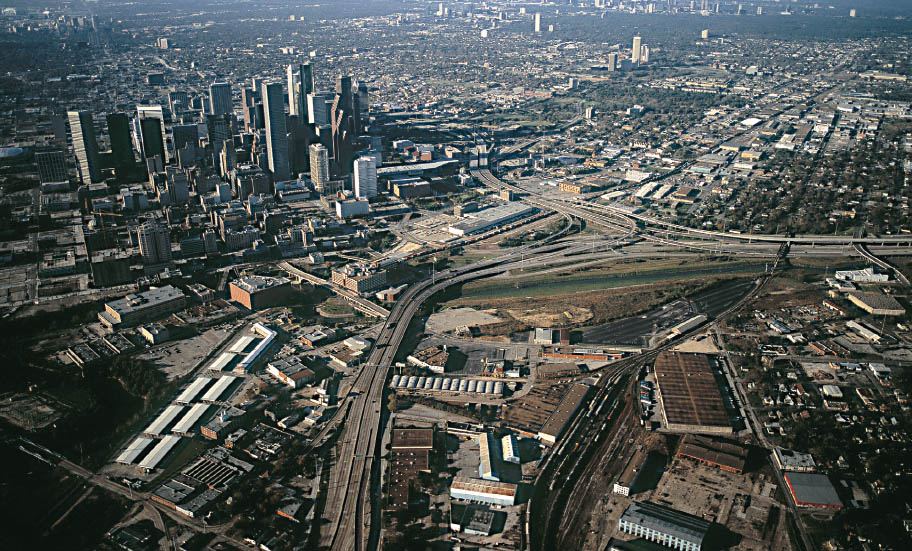
4.7.8 Polycentric growth in and around Houston, Texas. Three nodes are visible: downtown in the foreground, Uptown/Galleria in the upper right, and Rice/Medical Center in the upper left.
Greenbelts, originally conceived for the monocentric city model, need to be readapted, given the push toward polycentrism that has become evident worldwide. Some planners have taken up the question of how new greenbelt forms could more effectively adapt to today’s metropolitan structure and see the answer as including the support of new regional functions. For example, the regional planner Manfred Kühn draws on the concept of the regional city to consider how the greenbelt serves to connect, not separate, the different components of metro areas across Europe. Specifically, he has contrasted the greenbelt and the “green heart”:
Whereas the Greenbelt approach operates in a monocentric city and its surrounding countryside, the Green Heart approach operates in a polycentric city region…In the first case, landscape is an outside zone, forming a belt around the city. In the second case, landscape is an inside zone, forming the core of a city region.25
Kühn’s insights point out the need for strategic greenbelt forms that deal with the dynamics, flows, and exchanges that take place at the regional scale.
Austria’s Viennese greenbelt is an exemplary model that adapted to these changes, and went from static form to a flexible, regional mosaic of environmental services. In 1905 the town council formally established the Viennese Forest and Meadow Belt, which has evolved over the century:
In times of crisis, such as the early post-War periods, the Vienna green belt was a major source of the supply of fuel wood and emergency food and enabled large parts of Vienna’s population to survive. In times of abundance, the needs are primarily directed toward recreation and to environmental services like providing clean water and clean air and the provision of high biodiversity in and around Vienna.26
As nearby cities have grown closer together, planners are now thinking regionally and considering how to integrate Vienna’s greenbelt into a larger, transnational greenbelt system for all of lower Austria, enabling polycentric sharing of environmental and other services.27 In this way, Vienna offers one example of how this trend to multicentrality opens up new opportunities for belting innovations.
In addition to new opportunities, fringe schemes pose novel challenges. One of these, as the planner Adriana Allen notes, is the complex governance at the fringe resulting from institutional fragmentation. “No district is able to apply a single isolated approach when supplying the comprehensive water and energy flows required by its population, or to manage the wastes and pollution generated by that population within its jurisdictional limits,” says Allen.28 (Fig. 4.7.9) Because of the shifting economic and social conditions, it is hard to create stable institutional landscape discourse for optimizing the peri-urban interface: “institutional arrangements or areas of responsibility tend to be either too small or too large, too urban or too rural in their orientation.”29 Taking up similar themes, other urban scholars refer to the fringe as a place of “policy disintegration,” calling it “a ‘messy’ yet opportunistic space in policy and decision-making processes, [that] remains confused and ‘disintegrated,’ lacking sufficient understanding and explicit attention for sustainable management as [a] place in [its] own right.”30
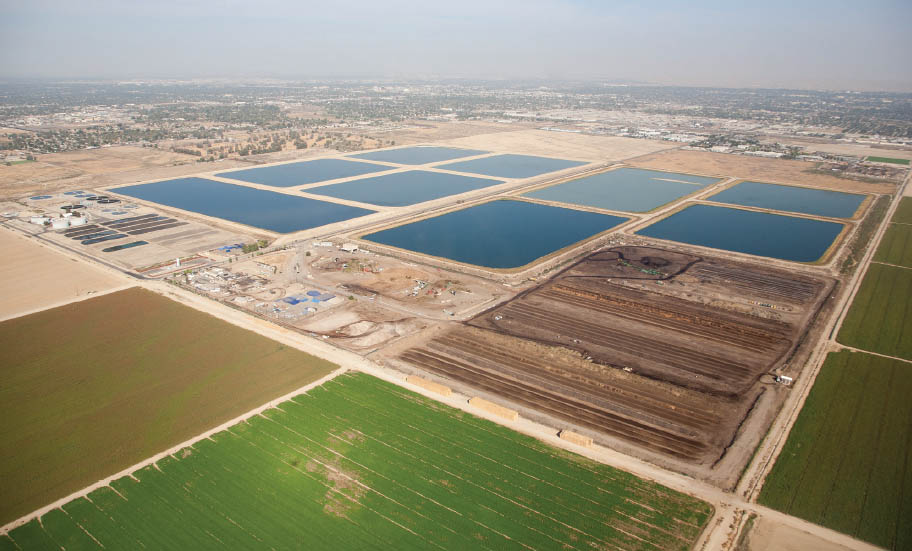
4.7.9 Wellington, Florida, edge next to the Everglades Wildlife Management Area. Stormwater retention and treatment areas are engineered for precise control.
Given the intense pressures at the fringe and the emergence of polycentrism, it is not surprising that the realization of conventional retrofits for greenbelts is drastically different than the original designs. One classic example is Metropolitan London’s greenbelt, the world’s first modern greenbelt. As its critics contend, its strict use as a containment tool renders it unresponsive to dynamic urbanization and expansion processes, including changing economic conditions, demographic fluctuations, development pressures, and other human and ecological adaptations.31 The result is that London’s greenbelt has morphed from an agrarian concept to a landscape sink for multiple urban functions far from the original idea: public utilities, reservoirs, gravel pits, and transportation infrastructure.32
Attempting to balance development pressures with greenbelt preservation demands, local authorities around the area have used different interpretations of greenbelt regulations to allow additional development around built-up areas. Namely, when greenbelt land has been taken for development, land was added to the greenbelt elsewhere to compensate. Thus, the total amount of greenbelt land remained the same, setting the precedent for land as interchangeable and rendering London’s greenbelt as a landscape constantly shifting to give way to development pressures and land conversions.33
There is currently a strong debate over the future of the greenbelt in Britain. The planner and housing specialist Nick Gallent suggests this debate is closely bound up with a larger dialogue about urban growth and its potential movement into the countryside.34 The government has identified a need for three million new homes as a result of both population growth and reduction in average household size, with much of the need concentrated in southeast England. Importantly, infill will not be sufficient to meet this demand.35 In 2008 the British government approved the largest redrawing of greenbelt boundaries in decades, allowing potential development to meet government housing and construction targets.36 Astonishingly, in a recent economics competition to rethink England’s garden cities, the highly coveted Wolfson Prize was awarded to a proposal to add hundreds of thousands of new homes in London’s greenbelt areas, based on a platform that argued greenbelt towns should have new development imposed on them!37
Since World War II, many cities worldwide have been retrofitting their greenbelts. Tokyo and Sydney established greenbelts after the war, but recently eliminated them because of strong population growth and resistance from landowners wanting to exercise their development rights.38 In India, the Bangalore Development Authority’s 2015 master plan revision includes opening up parts of its greenbelt for industrial development, even as continual ad hoc shrinkage of the greenbelt has been registered over the past decade.39 In Hong Kong, the government has struggled to preserve land inside a greenbelt that functions more as a land bank than as a conservation area.40
In South Korea, Seoul’s greenbelt (modeled in 1971 after London’s) doubly served conservation purposes and security buffering from North Korea. It has expanded four times since its inception and has eroded only moderately as upward pressure on land and housing prices forced the release of marginal land for development. Seoul’s greenbelt, however, also serves as an example of tremendous social inequity, as land is simply taken from owners without any reciprocity for lost development rights.41 The greenbelt was established by a dictatorship, and landowners were not compensated for their loss of development rights. As a result, landowners seeking compensation have been the primary drivers of greenbelt reform.42
In post-perestroika Moscow, fringe dynamics have put the greenbelt under increasing pressure. From 1996 to 2006 it lost about 11 percent of greenbelt forests to housing (seasonal dachas and permanent suburban homes, many in gated communities); vegetable gardens; transport infrastructure (roads, parking lots); retail establishments (big box stores and strip malls); and postsocialist industry (food processing and printing plants, furniture factories, gravel pits, concrete mixing plants, and landfills). The greenbelt has become increasingly fragmented, experiencing a net conversion rate of 14.6 percent between 1991 and 2001.43 In 2005 the Ministry of Economic Development released a draft of the Forest Code that would effectively eliminate the protected designation of forests in the greenbelt.44
When greenbelts are not designed with the intelligence and flexibility to adequately manage fringe dynamics, they inevitably provoke significant unintended consequences. For example, when greenbelt restrictions are too tight, development leapfrogs to areas directly beyond the restrictions, thus reversing the effects of containment. Land speculation follows this same trajectory when supply is inelastic—constrained—inside the urban core.45 Greenbelts in London, Seoul, and Boulder, Colorado, have seen widespread leapfrog expansion just outside their greenbelt perimeters. Nonetheless, planners and designers continue to uncritically adopt greenbelts as antisprawl tools.46 Ironically, planners’ rational intentions for greenbelts—to reduce the effects of land speculation, horizontal spreading, unchecked growth, and long commutes—often produce worse outcomes, as leapfrog development relocates development well beyond the belt’s borders. Critics of the use of greenbelts to contain suburban expansion say that by reducing the supply of developable land, the greenbelt creates economic and social havoc within constrained urban areas inside the greenbelt and particularly promotes crises in housing affordability.
The criticism has some truth to it. In the United States, one of the best examples of the negative effects of greenbelts on housing affordability is Boulder, which initiated the Boulder Valley Service Area in 1977 as a growth control zone to contain urban development and preserve rural edges. The growth controls did slow expansion, but they also caused an affordability crisis for people in Boulder. Today, Boulder’s median home price is $480,000; downtown it is a whopping $700,000. In contrast, nearby Denver’s median home price is about $270,000. As a result, 66 percent of Boulder employees live outside Boulder and must commute (mostly by car).47 The same result can be seen elsewhere. Scholars found that if Seoul had the flexibility to release more greenbelt land, housing prices and congestion would significantly decrease across the whole metropolitan area.48 Without intelligent flexibility, the greenbelt loses its efficiency as a policy tool.49
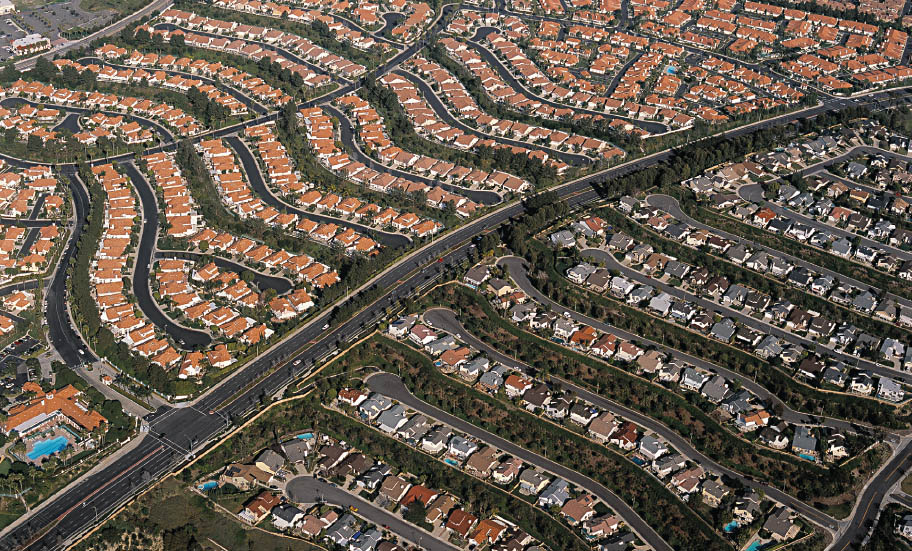
As the United States and other locations have recently experienced, housing affordability brings a diverse mixture of people to the suburban fringe. The entry of new ethnicities, incomes, backgrounds, and experiences will be changing old urban and rural dichotomies.50 New spatial patterns (dispersion, decentralization, and polycentrism with multiple nodes of higher density) are increasingly prevalent in global economies in both industrial and service-based contexts, as opposed to historical concentric urban patterns built from local and regional strengths. (fig. 4.7.10) Furthermore, critical new environmental concerns about climate change adaptation/mitigation, and about ecosystem services, have intensified over the past decades.
4.7.10 Seagate Technologies in Longmont, Colorado. Many industries do not rely on centrality in the new tech economy.
As London, the world’s first greenbelt system, reveals, a lack of spatial and programmatic flexibility combined with urban growth pressures is leading to drastic changes in greenbelt policy and use. Early greenbelts were intended to control urban growth, prevent cities from merging into each other, and keep urban and rural environments distinct, but they absorbed other functions over time to justify their continued existence.51 The unsettled relationship between the concepts of greenbelt and green infrastructure, and the functions that each are programmed to perform, is evidence of this.52
There are many examples of the integration of green infrastructure and the original greenbelt idea. Within Belgium, the Brussels Capital Region is trying to create a “blue and green network” to embed biodiversity into as many infrastructural and landscape systems as possible.53 Hamburg, Germany, also has a “green network” of variably scaled green rings at different distances from the city center that allows people and wildlife to recreate and circulate easily.54 Portland, Oregon’s Environmental Services Department launched the “Grey to Green” initiative in 2008 and invested $55 million to “help manage stormwater runoff more naturally, control invasive plants, restore native vegetation, protect sensitive natural areas, and restore Portland’s streams.”55 London is now trying to implement a “Green Grid” and “Blue Ribbon” network as part of its efforts to create green infrastructure.56 The Chicago Wilderness program formed in April 1996 as an effort to use restoration ecology in the Chicago region to conserve biodiversity and promote ecological health.57 Chicago Wilderness activities led to the creation of the Green Infrastructure Vision to identify opportunities to support biodiversity and provide habitat through green infrastructure.58 These are just a few ways in which regional authorities, metropolitan agencies, cities, and municipalities are retrofitting greenbelt concepts and trying to increase the infrastructural capacities of landscape as new growth and increased costs for environmental services mount.
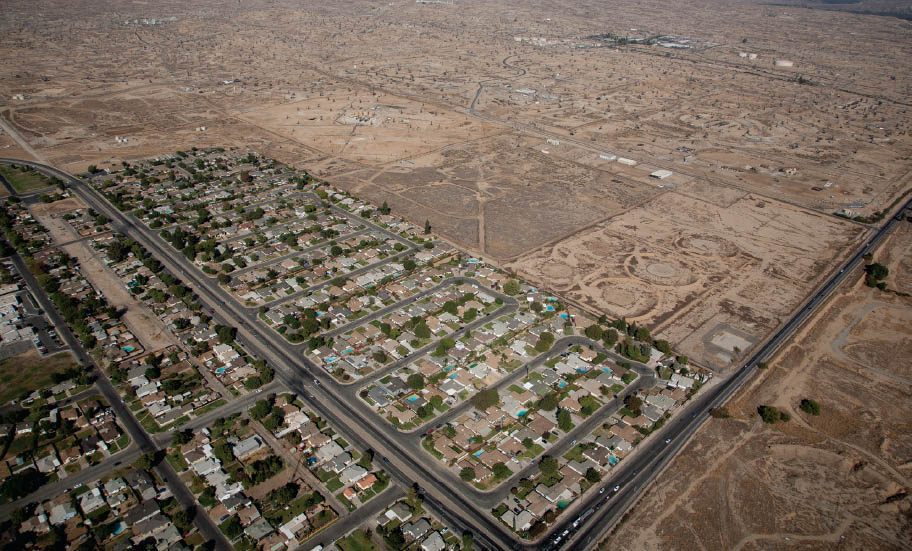
Those innovations, and others around the world, came about because the theoretical idea of the greenbelt has not optimally performed in practice, generating costs and negative social consequences. As greenbelts erode under the pressures of urbanization and the rapid transformation of the suburban fringe, antiquated conceptions of them as “containment vessels” for urban expansion, “aesthetic voids” to preserve rural landscape qualities, or “ecological tools” to separate people and nature are in dire need of revision and “reimagination.” (figs. 4.7.11–12) Moreover, the demographic, economic, and environmental contexts of rapidly growing metropolitan regions have changed. Major new forces at the suburban fringe include neo-liberalism (trade liberalization), and globalization. Economic restructuring—the rise of consumption, service, and/or leisure economies; manufacturing decentralization; and farming consolidation and intensification—also are playing a role. To those changes, add political decentralization, improved transportation and communication technologies that enable greater mobility and dispersion, environmentalism and the emergence of the international development industry.59 (figs. 4.7.13–14)
4.7.12 Edge of Oildale, 3.5 miles (5.6 km) north of Bakersfield in Kern County, California, adjacent to Kern River Oil Field
As the geographer John Herrington asserts, “Green Belts have become an outmoded and irrelevant mechanism for handling the complexity of future change in the city’s countryside.” The greenbelt must go beyond containment—growth control—to provide real recreation and tourism opportunities, ecological biodiversity, infrastructural systems such as waste and water management, productive agriculture and forestry, and economic place competitiveness and development activities.60
New concepts of belting at the suburban fringe, where intense growth pressures collide with environmental services, can change the balance of metropolitan scale sustainability. The unique fringe location and the rapid rate of conversion that is already in effect there, together with the environmental degradation accumulating at the urbanizing edges of metro areas, is a generational design challenge that opens up unlimited opportunities for greenbelts. Greenbelts could provide fringe areas with new infrastructural projects and with open space. They could lower land prices, which in turn could support new multifunctional development.61 In an embrace of polycentrism, greenbelts could also increasingly connect to each other within a region, revealing a dynamic zone of new, fluid landscape opportunities in ways that completely avoid the bureaucratic trappings of the core city.
How do we reconceive the greenbelt? Unfortunately, the planning field currently lacks a deep reservoir of methods and tools for regulating and managing dynamic, evolutionary landscape processes such as those found at the suburban fringe. Nonetheless, some scholars have theorized ways in which the fringe can have its own unique, open-ended process-based form. The resilience researcher Johan Colding has suggested that suburbs begin to use what he calls “ecological land use complementation” to better support ecosystem services.62 This concept clusters different types of green patches together to improve connectivity, taking habitat size and heterogeneity into consideration by establishing buffers to mitigate the negative effects of proximity and to provide refuge for species in habitat reserves during times of stress.
The geographer Jeremy Whitehand has elucidated the concept of fringe belts at the edges of metropolitan areas, with objects and stasis as the primary drivers of urban form: “The fringe belt concept embraces two major categories of processes: first, the structuring of urban growth and the urban area in terms of alternating zones of residential accretion and fringe belts; and, second, subsequent processes of change.”63 Others have emphasized the theoretical dimensions of fringe development. The planners Ward Rauws and Gert de Roo describe complex, nonlinear processes of change in effect at the fringe. For this reason, they suggest that planners need to plan, but at the same time to also be adaptive.64
The landscape architect and urbanist James Corner also stresses the importance of ecological and urban processes, arguing, “The processes of urbanization—capital accumulation, deregulation, globalization, environmental protection, and so on…are much more significant for the shaping of urban relationships than are the spatial forms of urbanism in and of themselves.”65 From this perspective, form is not irrelevant, but it is also not sufficient to understand urban systems. He recommends a paradigm shift from conceiving of objects to conceiving of systems, encompassing a broad range of actors, forces, exchanges, and activities.66 Corner suggests that ecology can play a critical role in this, writing, “in conceptualizing a more organic, fluid urbanism, ecology itself becomes an extremely useful lens,” because of its focus on dynamism, interconnectedness, inclusivity/continuity, and complexity.67
The role of ecology in planning and design should become a fundamental priority in making decisions about land-use conversion and metropolitan sustainability, particularly as suburbia expands and the fringe is transformed.68 This can be approached from many analytical and conceptual perspectives, from ecological economics to urban metabolism to landscape urbanism. But what these movements all have in common—and, unfortunately, have working against them—is the lack of a process-based discourse that can be adopted by institutional decision makers. As the fledgling fields of landscape urbanism and so-called ecological urbanism have shown, process-driven design remains isolated from academic discussion.69
To move such a discourse into the real world of practice will require a paradigmatic shift of the way we teach and practice planning and design. Such a shift must borrow more from (dynamic) target-based environmental standards than from (static) zoning and planning codification protocols that are already deeply entrenched in governing structures, and uncritically regurgitated by academic institutions and biased groups alike.70 In his research, the landscape ecologist Sybrand Tjallingii identifies two ecological discourses about nature that structure notions of fringe landscapes: “nature as object” and “nature as process,” the former being deeply rooted in current planning practice, and the latter having promising prospects but weak institutional traction.71
Some designers and planners are making a concentrated effort to bring process-based ecological forms and performance measurement to the forefront of decision making. The landscape architect and planner Joan Nassauer has argued that we need to build new, innovative, ecological processes into forms that we already live with and recognize: “In the everyday landscape, rather than simply designing to enhance ecological quality or even to express ecological function as form, we must design to frame ecological function within a recognizable system of form.”72
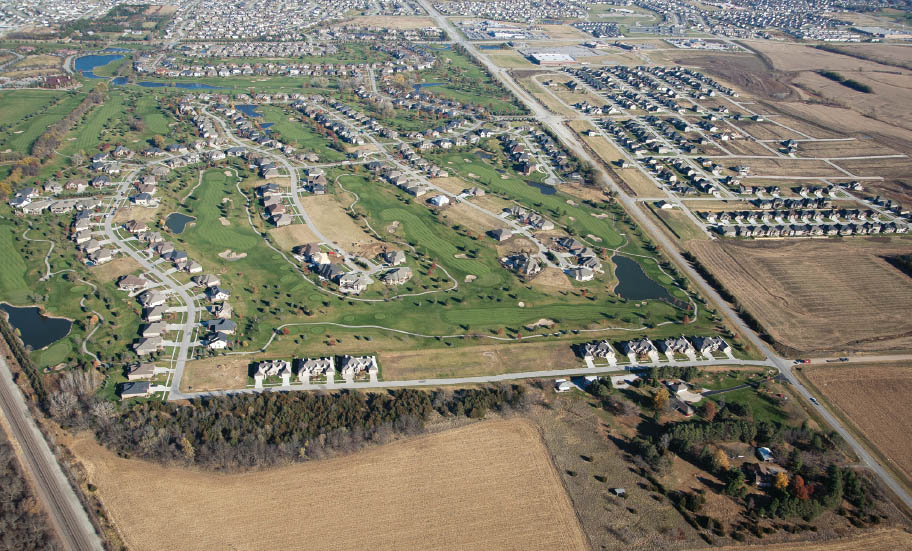
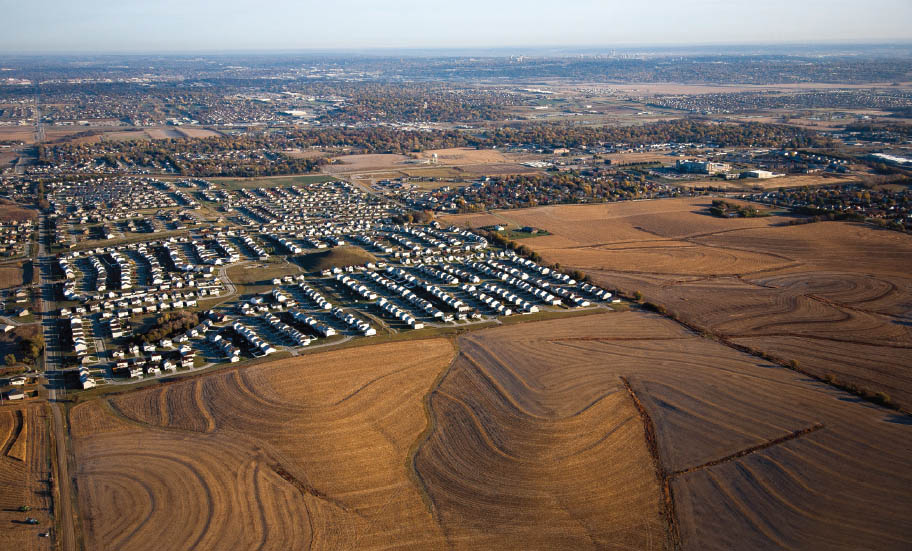
If greenbelts are to evolve they must have a new purpose. Over the past four decades, the suburban fringe has increasingly transformed from the locus of rural poverty to the burgeoning crest of middle class expansion. (figs. 4.7.15–18) New, wealthier residents at the fringe are demanding more accountability for protection of natural resources and protection from environmental risks through sustainable planning and design practices.73 An enormous opportunity has emerged in landscape innovation for these new constituents, with the role of planners and designers to orchestrate the larger systems of productive ecology, innovative sustainable technologies, and experimental suburban belting typologies.
4.7.18 Broward County, Florida, new planned unit developments surrounded by agricultural reserve land
There is a growing chorus of urbanists suggesting that cities move toward sustainability by actually supporting horizontal growth and polycentrism, all the while integrating resource exchanges between urban cores and their functional suburbs and hinterlands through systemic ecological thinking.74 The landscape ecologist Sarah Taylor Lovell even suggests that instead of just focusing on preserving and restoring small, high-quality patches and connecting corridors, planners’ designs should incorporate heterogeneity, as a way to improve the quality of the overall matrix in agricultural and urban landscapes. This heterogeneity can be achieved with multifunctional landscape features that improve ecosystem function, such as vegetative buffers, natural and constructed wetlands, edible gardens, stormwater infiltration systems, and waste treatment systems.75
Today’s suburban fringe, where metabolic urban-suburban exchanges are their greatest, is dynamically changing. Its social and environmental issues, along with its economic growth zones, have become high priorities for metropolitan areas. But for planners and designers to have agency in imagining the future of the suburban fringe, they must be prepared to engage with much more than just physical form. The anemic greenbelt typology, used ineffectually to control the fringe, can be reimagined to combine the potentials of ecology, infrastructure, and landscape.
Suburban areas can perform many of the environmental services that expanding urban metro areas need, but only if both existing form-based codes and zoning that privileges the building of objects over designing for dynamic ecological processes are diminished. Until the planning and design professions develop a process-based discourse for institutional use, the potential of the fringe as a major contributor to overall metropolitan environmental services and its other landscape opportunities will remain unfulfilled.
If, on the other hand, the greenbelt were to be opened to new interpretations, it could house full metabolic exchanges that balance the entire metropolitan resource demands, resulting in truly sustainable urban conditions.76 Beyond formal machinations and design rhetoric, this should be one of the central ambitions of urbanism itself.
Waste in myriad forms—solid, liquid, surface, and so forth—should be the foundation for a new kind of belting mechanism on the suburban fringe: the “wastebelt.” As the base for the construction of this process-based discourse, the wastebelt is where regional-scale resource management and visionary representational models begin. These models can capture the imagination of policy makers and citizens who may see the suburban edge only as a place for singular uses, speculation, and low value.
Wherever humans exist, waste exists. This is especially true in metropolitan areas where waste is concentrated by increased population density and consumption. The fringes of metro areas have historically been considered the locations of accumulated waste disposal from the city itself.77 Perhaps the best example of waste at the fringe emerged in Victorian society. Starting in the mid-eighteenth century, the United Kingdom’s major cities, including London, Manchester, Liverpool, and Glasgow, rapidly urbanized as a result of massive population growth. The population surge, combined with inadequate infrastructure, economic inequity, and industrial pollution, produced a housing shortage and unsanitary conditions, especially in relation to improper sewage treatment. The Sanitary Movement of the 1840s and 1850s included a new, strongly hostile attitude toward urban waste.78 Initially, the Victorians focused on just getting waste out of the city—dumping it on the fringe or into the sea, rather than on effectively treating it. But sanitary mapping and health-related statistical improvements led to modern sewage infrastructures that reinforced the city’s outer edges as a waste dumping ground.
In the United States, colonial towns dumped solid waste at their outskirts and fluid waste into rivers that flowed outward. In the 1850s, cities started to designate specific outer areas for disposal. There was no organized waste disposal system until the mid-nineteenth century, when urbanization generated significant new volumes of waste. The landscape architect Mira Engler contends, “In the first few decades of the twentieth century, American cities’ automated, centralized sanitation networks were pushed outside city limits, screened, or buried beneath the streets.”79 Boston dumped its waste on Columbia Point; New York discarded its trash into the ocean; Chicago used Lake Michigan.80 Moreover, Chicago built a great deal of new land from waste, with refuse used to reclaim property and expand the amount of usable terrain, either by establishing a dry base on marshland or by filling quarries and clay pits on the fringe.81 New York City has had a waste crisis since the 1960s. By the early 1990s, it had been forced to shut down ten out of eleven incinerators and six landfills. In 2001 it closed Fresh Kills on Staten Island, the world’s largest disposal facility. According to the landscape architect Pierre Bélanger, New York City’s experience shows that society “[can] no longer deal with the magnitude and complexity of urban waste streams in big cities.” He has argued that society must cope with waste by developing new strategies that offer less centralized and more diversified systems of materials recovery.82
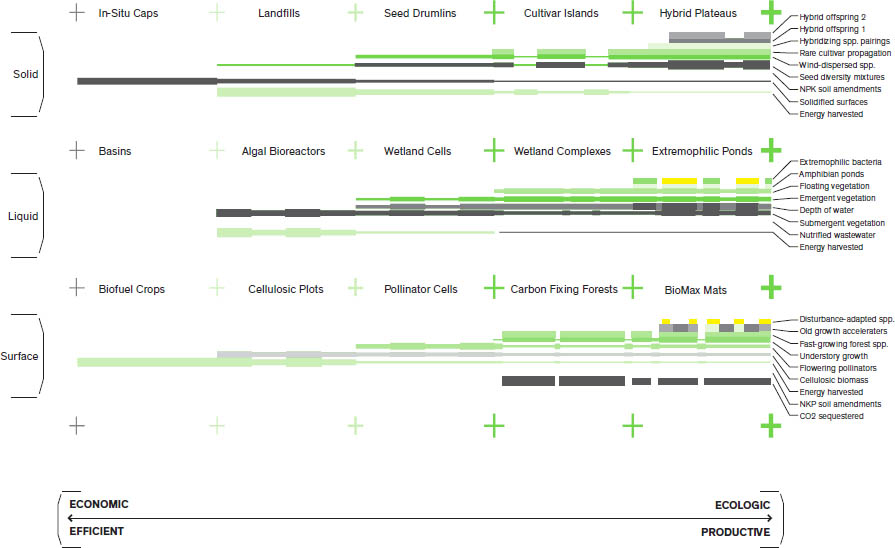
The examples that follow show how wastebelts could function, beginning with a “waste matrix” that visualizes a way to optimize trade-offs between economic and ecologic potentials of the wastebelt concept. The matrix could be accompanied by modular plug-ins, representing potential configurations of form and program on the basis of matrix decisions. New belting strategies for wastewater, energy, and “drosscape” are represented, using the matrix to guide optimization and landscape programming potential.83
When creating new types of wastebelts, trade-offs between economic and ecological benefits to a region must be considered. By distributing various design options across a gradient from the economical to the ecological, planners and designers could better communicate the trade-offs to their stakeholders, hopefully leading to more optimal mix of outcomes. The waste matrix represents a menu of solid, liquid, or surface treatments that contain or treat forms of urban waste. (fig. 4.7.19) For example, landfills generally contain energy resources such as off-gassing methane (created from the organic liquids and entombed solids). The same landfills could also contain energy infrastructure such as solar or wind farms. In addition, they have surfaces that could be programmed for social and recreational activities. Stacking and mixing these uses could greatly amplify a site’s productive outputs and efficiencies without sacrificing its ecological integrity or recreational benefits. The matrix offers an experimental view of waste landscape by agglomerating and hybridizing waste, ecological, and recreational programs.
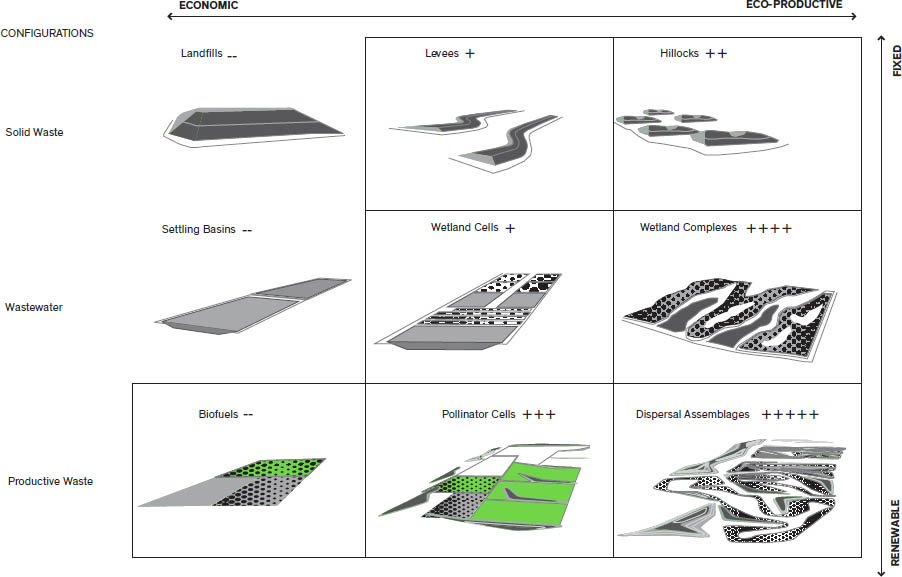
There are many ways to treat and contain solid, liquid, and surface wastes. (fig. 4.7.20) Endless new configurations can be imagined, linked, and layered in the new wastebelt system. Some formations are designed to be fixed and static (like landfills), while others evolve and mature (like vegetative colonies) as wastes are recovered and ecology flourishes. The total amount and configuration of these modular components are dependent on the needs of the urban area and the amount of waste needing containment or treatment. Different plug-ins can be added over time as the metro area grows, depending on the waste output.
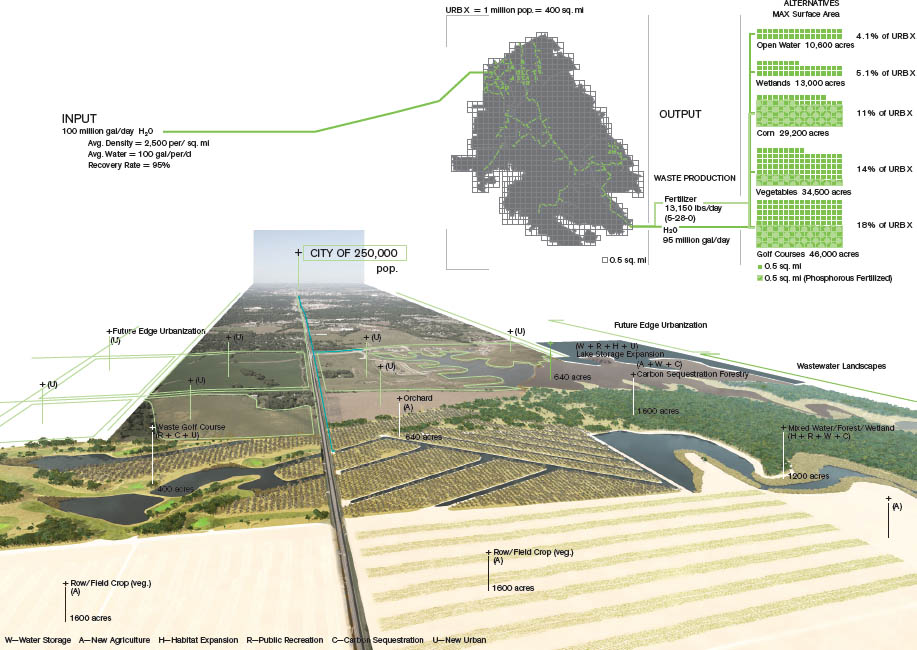
In the areas between the advancing suburban fringe and the agricultural hinterlands, new wastebelts can be supported by the wastewater flows derived from the city population and from agricultural runoff.84 (fig. 4.7.21) As an example, consider a typical city with a population of 250,000, surrounded by areas used for agriculture. The resultant waste outputs support about 6,400 acres (about 2,590 hectares) of new landscapes of types. Lake water storage could be expanded, as a way to buffer irrigation needs and as a recreational amenity. These waters could feed wetlands and support both forestry (for carbon sequestration) and extra-capacity agriculture such as orchards or more row crops. Amenity-driven locations like golf courses, running trails, leisure parks, and aquatic centers could all benefit from their adjacency and coursing water features. These new productive zones, habitat zones, and recreational zones could intermix with the encroaching housing edge. Cleansing wetlands could buffer and improve even more runoff from the new development and/or new agricultural areas. In this scenario, these land uses are mixed and hybridized to extract maximum benefit from the waste outputs of city inhabitants and the agricultural sector. The collectively produced positive feedback enhances the value and productivity of each landscape zone.
For an urban area of one million people, about 95 million gallons per day of wastewater (360 million liters per day) can be captured and treated for reuse. The wastewater generated from urban and agricultural uses would contain nitrates and phosphates that could be recycled and used as fertilizer. For example, golf courses require an average of 750,000 gallons per acre (7 million liters per hectare) for the support of turf grass (which makes up about 50 percent of total golf course area) and 65 pounds per acre (58 kilograms per hectare) of phosphate fertilizer. Given the wastes generated by the one-million-person city over the 180-day growing period, 46,000 acres (about 18,600 hectares) of golf course could be irrigated with wastewater, with about half of it fertilized. That amounts to about 18 percent of the size of the hypothetical one-million-person city itself, which is a significant economic and ecological impact.85
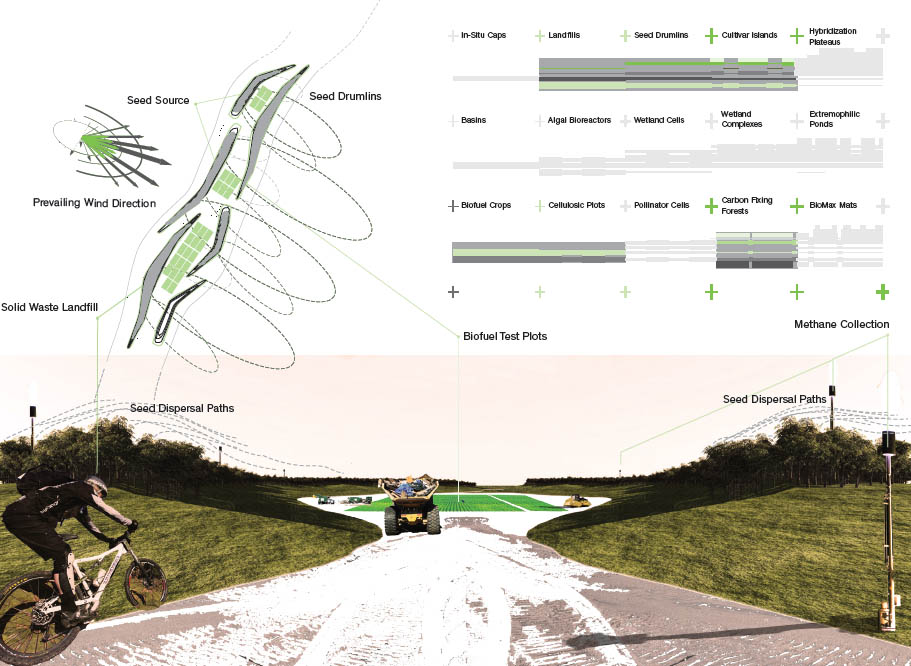
This design concept illustrates a waste-belt configuration for maximizing energy production opportunities.86 (fig 4.7.22) Landscape elements include “seed drum-lins”—long, extruded hills that accommodate incoming waste while serving as dispersal pads for wind-dispersed vegetation species to populate the surrounding lands. When these seed drumlins are added to the tops of standard municipal landfills, the landscape is no longer one mono-functional cavity. With a large enough surface area, either cellulosic or oil-based biofuel crops would provide an additional biomass for energy revenues. Over time, the “energybelt” grows by accepting regional waste for landfill expansion, thus producing more methane and biofuel production areas for the energy needs of the growing population. The energybelt would become an attractor for tech energy experimentation and innovation. Trails are interwoven throughout the complex to provide unique recreational experiences.
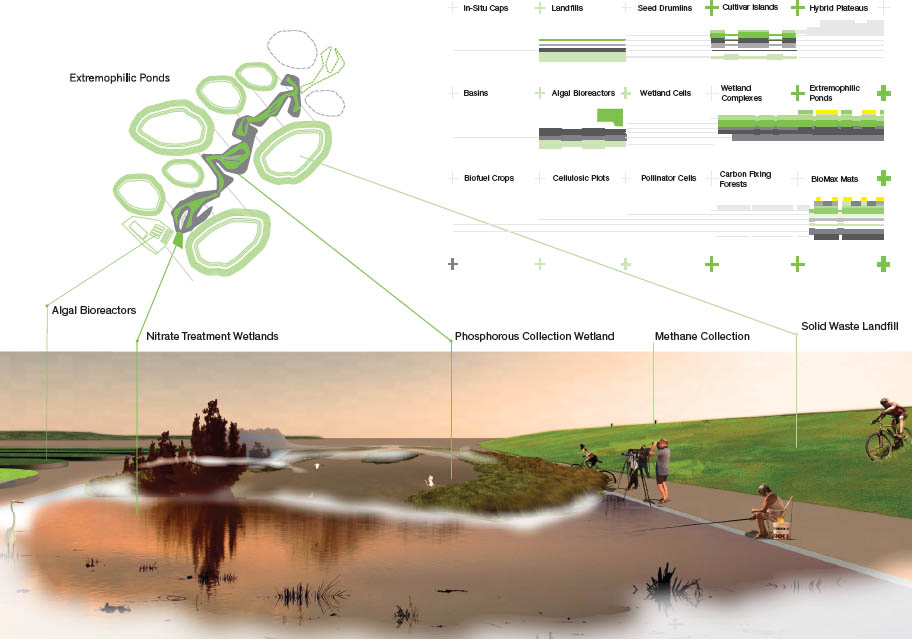
This design concept illustrates a wastebelt configuration for maximizing the potential of high rainfall regions. (fig. 4.7.23) The wetbelt takes advantage of abundant stormwater to grow algae in bioreactor ponds for biofuel production. It is designed to form complex islands that encourage microclimatic variation and ecological experimentation. As the habitat assemblages develop, targeted recreational access could be granted for particular types of fishing and birding, or for aquaculture. If the wetbelt has access to suburban or agricultural runoff, the nutrient-rich water could be mined for nitrogen and phosphorous. The collected nutrients could be repackaged as standard fertilizer or algae feed. Extreme conditions of polluted water could be tested for various cleanup methods utilizing extremophilic bacteria and algae. Novel landscape-based systems like these are needed to advance treatment technologies and reclamation methods for waste-affected lands.
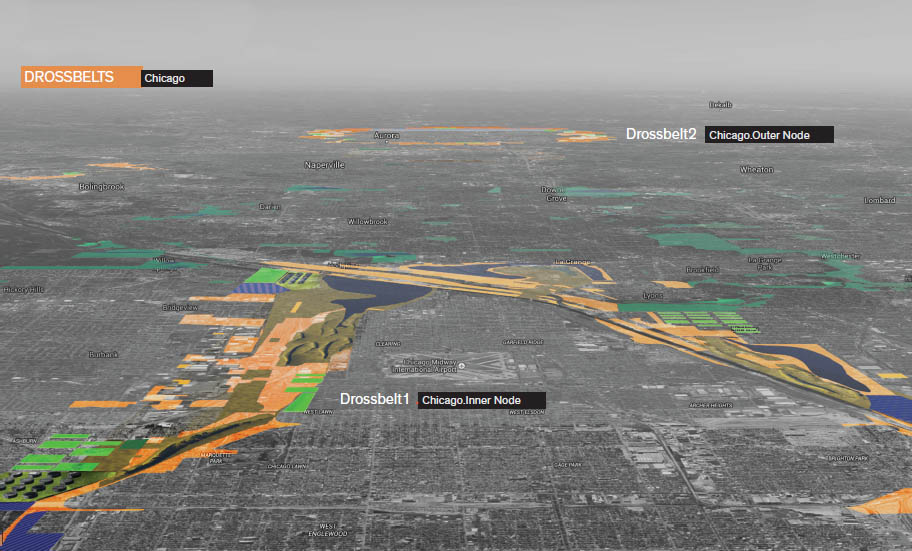
Wastebelts can also be aggregated within the deindustrialized urban fabric.87 (fig. 4.7.24) Many Rust Belt cities still contain large industrial parcels and polluted legacy sites. On the south side of Chicago, extensive abandoned tracts sit alongside railroad corridors and watercourses. The drosscape sites could be strung together and reprogrammed with new energy. The abundant space could also host the necessary landfills, staging areas, dirty soil processing sites, and seeding mounds necessary to rehabilitate the legacy sites and halt the potential pollution migration. Retention basins could capture runoff and serve as recreation zones and potential wetland filtering stations.88 Utilizing city databases to locate abandoned or inactive sites, and then matching them with unmet economic and environmental needs, could provide a potent model for rein-vigorating entire urban sectors. The system of sites may provide the space and environmental flexibility to reinvent land use in stagnating areas.
The anemic greenbelt typology, used ineffectually for decades to control the fringe, can be reimagined to combine the potentials of ecology, infrastructure, and production in a new landscape ensemble. New concepts of belting at the suburban fringe, where intense growth pressures collide with environmental and ecosystem services, can change the balance of metropolitan scale sustainability. The unique fringe location and the rapid rate of conversion that is already in effect there present a generational design challenge that opens up unlimited opportunities for innovative greenbelt solutions.
There is a growing chorus of urban-ists suggesting that cities move toward sustainability by actually supporting horizontal growth and polycentrism. As this is already naturally occurring, the role of ecology in planning and design needs to become a more fundamental priority in making decisions about land-use conversion and metropolitan sustainability, particularly as suburbia expands and the fringe is transformed. A process-based discourse needs to be articulated and adopted by institutional decision makers in order to drive such an ecological approach. Such a shift must borrow more from (dynamic) target-based environmental standards than from (static) zoning and planning codification protocols that are already deeply entrenched in governing structures. Suburban areas can perform many of the environmental services that expanding urban metro areas need, but not until mindlessly repetitive form-based codes and zoning, which privilege the superficial building of objects over designing for dynamic ecological processes, are removed from the intellectual and professional planning and design culs-desac they helped create.
Reconceiving the dynamics of metropolitan edges, where land conversion, degradation, ecosystem service losses, and social equity are perhaps at their most extreme, should be one of the central research ambitions of urbanism itself. Contemporary urbanism desperately needs a new model for imagining the outer edges of cities—the suburban fringes where the dynamics of urban expansion and resource consumption most visibly collide—and where the greenbelt could be reinvented to perform ecosystem services through innovative and intelligently designed landscape complexes.
Sara E. Brown assisted in the initial research of major elements in this essay. Casey L. Brown assisted in ideation and design of the wastebelts concept with the author.
2 Ibid. These authors also reference thirteenth-century greenbelts from the following sources: Leslie Ginsburg, “Green Belts in the Bible,” Journal of the Town Planning Institute 42 (May 1956): 129–30; Robert Freestone, “Greenbelts in City and Regional Planning,” in From Garden City to Green City: The Legacy of Ebenezer Howard, ed. Kermit C. Parsons and David Schuyler (Baltimore: Johns Hopkins University Press, 2002), 67–98; and Ebenezer Howard, Garden Cities of Tomorrow (1898; repr., London: Faber & Faber, 1946).
3 John Herington, Beyond Greenbelts: Managing Urban Growth in the Twenty-First Century (London: Jessica Kingsley Publishers and Regional Studies Association, 1990), 6–13; Marc Antrop, “Landscape Change and the Urbanization Process in Europe,” Landscape and Urban Planning 67, nos. 1–4 (March 15, 2004): 9–26.
4 Manfred Kühn, “Greenbelt and Green Heart: Separating and Integrating Landscapes in European City Regions,” Landscape and Urban Planning 64, nos. 1–2 (2003): 26.
5 Herington, Beyond Greenbelts, 28–30.
6 Kühn, “Greenbelt and Green Heart,” 20; Marco Amati, “From a Blanket to a Patchwork: The Practicalities of Reforming the London Green Belt,” Journal of Environmental Planning and Management 50, no. 5 (2007): 579–94; Carol Harrison, “Countryside Recreation and London’s Urban Fringe,” Transactions of the Institute of British Geographers 8, no. 3 (1983): 295–313.
7 David Simon, “Urban Environments: Issues on the Peri-Urban Fringe,” Annual Review of Environment and Resources 33, no. 33 (January 1, 2008): 168.
8 This is a combinatory term meant to describe areas that have characteristics of suburbs and fringes. I have used Kurtz and Eicher’s 1958 definition to create this hybridization. See Richard A. Kurtz and Joanne B. Eicher, “Fringe and Suburb: A Confusion of Concepts,” Social Forces 37 (October 1958): 32–37.
9 German Adell, “Theories and Models of the Peri-Urban Interface: A Changing Conceptual Landscape,” Development Planning Unit, University College London, March 1999, 9; another frequently used term is the “Rural-Urban Fringe.” Scott et al. describe this term as “Deconstructing the RUF,” which “is a complex undertaking and can become a self-defeating exercise.” Indeed, there is a burgeoning number of terms advanced in the pursuit of a definitional “holy grail”; ranging from landscapes at the edge; places of transition; heterogeneous mosaics; landscapes of disorder; chaotic landscapes; new geography of urban sprawl; the last frontier; ephemeral landscapes; edgelands; and forgotten landscapes. Collectively, these terms all signify an implicit “otherness,” heavily laden with negative overtones, implying that it is a “space waiting for something better to come along.” See Alister Scott et al., “Disintegrated Development at the Rural-Urban Fringe: Re-Connecting Spatial Planning Theory and Practice,” Progress in Planning 83 (July 2013): 9.
10 The peri-urban landscape is a mosaic of agricultural and urban ecosystems affected by material and energy flows demanded by urban and rural areas: Adriana Allen, “Environmental Planning and Management of the Peri-Urban Interface: Perspectives on an Emerging Field,” Environment & Urbanization 15, no. 1 (April 2003): 135–47.
11 Douglas Webster, “On the Edge—Shaping the Future of Peri-Urban East Asia” (discussion paper, Stanford University, Institute for International Studies, Asia/Pacific Research Center, Stanford, California, 2002): 32–33, accessed July 20, 2015, http://aparc.fsi.stanford.edu/sites/default/files/Webster2002.pdf.
12 Simon, “Urban Environments,” 167–85.
13 Adell, “Theories and Models of the Peri-Urban Interface,” 1.
14 Webster, “On the Edge,” 6.
15 Ibid., 6; Douglas Webster, Jianming Cai, and Larissa Muller, “The New Face of Peri-Urbanization in East Asia: Modern Production Zones, Middle-Class Lifestyles, and Rising Expectations,” Journal of Urban Affairs 36 (2014): 315–33.
16 Robert J. Mason and Liliya Nigmatullina, “Suburbanization and Sustainability in Metropolitan Moscow,” Geographical Review 101, no. 3 (July 2011): 317, 319.
17 Antrop, “Landscape Change and the Urbanization Process in Europe,” 16.
18 Steven J. Meeus and Hubert Gulinck, “Semi-Urban Areas in Landscape Research: A Review,” Living Reviews in Landscape Research 2 (January 2008): 9.
19 Adrian G. Aguilar and Peter M. Ward, “Globalization, Regional Development, and Mega-City Expansion in Latin America: Analyzing Mexico City’s Peri-Urban Hinterland,” Cities 20, no. 1 (February 2003): 7.
20 Simon, “Urban Environments: Issues on the Peri-Urban Fringe,” 169–70; Andre C. Ortega, “Desakota and Beyond: Neoliberal Production of Suburban Space in Manila’s Fringe,” Urban Geography 33, no. 8 (November-December 2012): 1119.
21 Delik Hudalah and Tommy Firman, “Beyond Property: Industrial Estates and Post-Suburban Transformation in Jakarta Metropolitan Region,” Cities 29, no. 1 (February 2012): 40–48.
22 Alan M. Berger et al., “Where Americans Live: An Environmental and Geographical Tally,” Harvard Journal of Real Estate—Navigating Investments with Ethical Risk (June 2013): 39–50. Future estimate is based on my own research projections using US Census data. Using current polycentric conditions across the United States, developed land consumes about 3.9 percent of total US land in 2015, including transportation and urban areas. Urban areas consume about 2.7 percent of total US land. It would take until 2130 to develop the nonconservation land inventory of the Bureau of Land Management, if land develops in step with current population growth. It would take an additional 120 years, until 2250, to develop the nonconservation land inventory of the Bureau of Land Management plus 50 percent of all grazing lands, if population growth remained steady. Calculation assumes land transfers do not include lands conserved for recreation or wilderness and a developed land growth rate that equals the population growth rate of the United States, from Cynthia Nickerson et al., Major Uses of Land in the United States, 2007, EIB-89, US Department of Agriculture, Economic Research Service, December 2011, accessed December 2, 2015, www.ers.usda.gov/publications/eib89.
23 Bibiana Catalan, David Sauri, and Pere Serra, “Urban Sprawl in the Mediterranean? Patterns of Growth and Change in the Barcelona Metropolitan Region 1993–2000,” Landscape and Urban Planning 85, nos. 3–4 (April 30, 2008): 176, 181–82.
24 Julio Dávila, “Falling between Stools? Policies, Strategies, and the Peri-Urban Interface,” in The Peri-Urban Interface: Approaches to Sustainable Natural and Human Resource Use, ed. Duncan McGregor, David Simon, and Donald Thompson (New York: Earthscan, 2006), 44–56.
25 Manfred Kühn, “Greenbelt and Green Heart: Separating and Integrating Landscapes in European City Regions,” Landscape and Urban Planning 64 (2003): 25–26.
26 Meinhard Breiling and Gisa Ruland, “The Vienna Green Belt: From Localised Protection to a Regional Concept,” in Urban Green Belts in the Twenty-First Century, ed. Marco Amati (Burlington, VT: Ashgate, 2008), 181.
27 Ibid., 167.
28 Allen, “Environmental Planning and Management of the Peri-Urban Interface,” 138.
29 Ibid., 135–38.
30 Scott et al., “Disintegrated Development at the Rural-Urban Fringe,” 1.
31 Robert L. Gant, Guy M. Robinson, and Shahab Fazal, “Land-Use Change in the ‘Edgelands’: Policies and Pressures in London’s Rural–Urban Fringe,” Land Use Policy 28, no. 1 (2011): 266–79.
32 Ibid., 272.
33 Ibid., 267; Marco Amati and Makoto Yokohari, “The Establishment of the London Greenbelt: Reaching Consensus over Purchasing Land,” Journal of Planning History 6, no. 4 (November 2007): 311–37.
34 Nick Gallent, “The Rural-Urban Fringe: A New Priority for Planning Policy?,” Planning Practice & Research 21, no. 3 (August 2006): 383–93.
35 Simon, “Urban Environments: Issues on the Peri-Urban Fringe,” 167–85.
36 Gant, Robinson, and Fazal, “Land-Use Change in the ‘Edgelands,’” 276.
37 Robert Booth, “Prize-Winning Designer Says Double Size of Forty English Towns,” Guardian, September 3, 2014, accessed July 17, 2015, http://www.theguardian.com/society/2014/sep/03/wolfson-winner-greenbelt-development.
38 Amati and Yokohari, “The Establishment of the London Greenbelt,” 311–37.
39 Harini Nagendra, Suparsh Nagendran, Somajita Paul, and Sajid Pareeth, “Graying, Greening, and Fragmentation in the Rapidly Expanding Indian City of Bangalore,” Landscape and Urban Planning 105, no. 4 (April 30, 2012): 400–406.
40 Bo-sin Tang, Siu-wai Wong, and Anton Kingwah Lee, “Green Belt in a Compact City: A Zone for Conservation or Transition?,” Landscape and Urban Planning 79, nos. 3–4 (March 2, 2007): 358–73.
41 Chang-Moo Lee, “An Intertemporal Efficiency Test of a Greenbelt: Assessing the Economic Impacts of Seoul’s Greenbelt,” Journal of Planning Education and Research 19, no. 1 (1999): 41–52; Chang-Hee Christine Bae, “Korea’s Greenbelts: Impacts and Options for Change,” Pacific Rim Law & Policy Journal 7, no. 3 (1998): 479–502.
42 David N. Bengston and Youn Yeo-Chang, “Seoul’s Greenbelt: An Experiment in Urban Containment,” in Policies for Managing Urban Growth and Landscape Change: A Key to Conservation in the Twenty-First Century, ed. David N. Bengston (St. Paul, MN: Department of Agriculture, Forest Service, North Central Research Station, 2005).
43 Mason and Nigmatullina, “Suburbanization and Sustainability in the Metropolitan Moscow,” 316–33.
44 Mikhail Blinnikov et al., “Gated Communities of the Moscow Green Belt: Newly Segregated Landscapes and the Suburban Russian Environment,” GeoJournal 66, nos. 1–2 (2006): 65–81.
45 Stephen Malpezzi and Susan M. Wachter, “The Role of Speculation in Real Estate Cycles,” Journal of Real Estate Literature 13, no. 2 (July 2005): 143–64, accessed December 11, 2015, http://libproxy.mit.edu/login?url=http://search.ebscohost.com/login.aspx?direct=true&db=bth&AN=17560639&site=eds-live.
46 Robert Bruegmann, “Urban Sprawl,” in International Encyclopedia of the Social & Behavioral Sciences, 2nd ed., ed. James D. Wright (Oxford: Elsevier, 2015), 934–39.
47 Peter Pollack, “Controlling Sprawl in Boulder: Benefits and Pitfalls,” Land Lines 10, no. 1 (1998), accessed December 11, 2015, http://www.lincolninst.edu/pubs/435_Controlling-Sprawl-in-Boulder---Benefits-and-Pitfalls; Joseph N. de Raismes III et al., “Growth Management in Boulder, Colorado: A Case Study” (unpublished policy paper from Boulder City Attorney’s Office), accessed December 11, 2015, http://www.bouldercolorado.gov/files/City%20Attorney/Documents/Miscellaneous%20Docs%20of%20Interest/x-bgmcs1.jbn.pdf; Katherine J. Jackson, “The Need for Regional Management of Growth: Boulder, Colorado, as a Case Study,” Urban Lawyer 37, no. 2 (2005): 299–322.
48 Myung-Jin Jun, “The Effects of Seoul’s Greenbelt on the Spatial Distribution of Population and Employment, and on the Real Estate Market,” Annals of Regional Science 49, no. 3 (December 2012): 619–42; Casey J. Dawkins and Arthur C. Nelson, “Urban Containment Policies and Housing Prices: An International Comparison with Implications for Future Research,” Land Use Policy 19 (2002): 6–7.
49 Chang-Moo Lee and Peter Linneman, “Dynamics of the Greenbelt Amenity Effect on the Land Market—the Case of Seoul’s Greenbelt,” Real Estate Economics 26, no. 1 (March 1, 1998): 107–29; Lee, “An Intertemporal Efficiency Test of a Greenbelt,” 41–52.
50 Michael Gregory Lloyd and Deborah Peel, “Green Belts in Scotland: Toward the Modernisation of a Traditional Concept?,” Journal of Environmental Planning and Management 50, no. 5 (2007): 639–56; Joel Kotkin, The Next 100 Million: America in 2050 (New York: Penguin Press, 2010).
51 Kühn, “Greenbelt and Green Heart,” 19–27; Marco Amati and Makoto Yokohari, “Temporal Changes and Local Variations in the Functions of London’s Green Belt,” Landscape and Urban Planning 75 (2006): 138; Tang, Wong, and Lee, “Green Belt in a Compact City,” 364.
52 Michael Hough, “Nature as Infrastructure: Strategies for Sustainable Regional Landscapes,” Places—a Forum of Environmental Design 19, no. 1 (Spring 2007): 54–58; Wenping Liu, Jirko Holst, and Zhenrong Yu, “Thresholds of Landscape Change: A New Tool to Manage Green Infrastructure and Social-Economic Development,” Landscape Ecology 29, no. 4 (April 2014): 729–43; Pierre Bélanger, “Landscape as Infrastructure,” Landscape Journal 28, no. 1 (March 2009): 79–95; Margaret Bryant, “Urban Landscape Conservation and the Role of Ecological Greenways at Local and Metropolitan Scales,” Landscape and Urban Planning 76, nos. 1–4 (April 30, 2006): 23–44.
53 Belgian National Focal Point to the Convention on Biological Diversity, ed., “Biodiversity 2020, Update of Belgium’s National Biodiversity Strategy” (Brussels: Royal Belgian Institute of Natural Sciences, 2013): 29, accessed December 11, 2015, https://www.cbd.int/doc/world/be/be-nbsap-v2-en.pdf.
54 “Hamburg—European Green Capital 2011,” accessed August 17, 2014, http://ec.europa.eu/environment/europeangreencapital/wp-content/uploads/2011/04/Doku-Umwelthauptstadt-engl-web.pdf.
55 “City of Portland’s Grey to Green Program: Grey to Green Accomplishments,” The City of Portland, Oregon, Environmental Services, accessed August 17, 2014, http://www.portlandoregon.gov/bes/article/321331.
56 “The London Plan—Blue Ribbon Network,” City of London, accessed August 17, 2014, https://www.london.gov.uk/what-we-do/planning/london-plan/current-london-plan/london-plan-chapter-7/blue-ribbon-network-0.
57 “Chicago Wilderness and Its Biodiversity Recovery Plan,” Chicago Wilderness, accessed August 17, 2014, http://c.ymcdn.com/sites/www.chicagowilderness.org/resource/resmgr/Publications/biodiversity_recovery_plan.pdf.
58 Dennis Dreher, “Chicago Wilderness Green Infrastructure Vision: Challenges and Opportunities for the Built Environment,” Journal of Green Building 4, no. 3 (Summer 2009): 72–88.
59 Cecilia Tacoli, “Rural-Urban Interactions: A Guide to the Literature,” Environment & Urbanization 10, no. 1 (April 1998): 147–65.
60 Herington, Beyond Greenbelts: Managing Urban Growth in the Twenty-First Century, 51–53.
61 Ward S. Rauws and Gert de Roo, “Exploring Transitions in the Peri-Urban Area,” Planning Theory & Practice 12, no. 2 (June 2011): 269–84.
62 Johan Colding, “‘Ecological Land-Use Complementation’ for Building Resilience in Urban Ecosystems,” Landscape and Urban Planning 81, nos. 1–2 (May 29, 2007): 46–55.
63 Jeremy W. R. Whitehand and Nick J. Morton, “Fringe Belts and the Recycling of Urban Land: An Academic Concept and Planning Practice,” Environment and Planning B: Planning and Design 30, no. 6 (2003): 820; Jeremy W. R. Whitehand, “Fringe Belts: A Neglected Aspect of Urban Geography,” Transactions of the Institute of British Geographers 41 (1967): 223–33.
64 Rauws and de Roo, “Exploring Transitions in the Peri-Urban Area,” 272, 280.
65 James Corner, “Terra Fluxus,” in The Landscape Urbanism Reader, ed. Charles Waldheim (New York: Princeton Architectural Press, 2006), 28.
66 Alan Berger, Systemic Design© Can Change the World (Netherlands: SUN Architecture, 2009).
67 Corner, “Terra Fluxus,” 29.
68 Alexander J. Felson, Steward T. A. Pickett, “Designed Experiments: New Approaches to Studying Urban Ecosystems,” Frontiers in Ecology and the Environment 10 (2005): 549–56.
69 Sybrand P. Tjallingii, “Ecology on the Edge: Landscape and Ecology between Town and Country,” Landscape and Urban Planning 48, nos. 3–4 (May 1, 2000): 104; Charles Waldheim, “Landscape as Urbanism,” in The Landscape Urbanism Reader, ed. Charles Waldheim (New York: Princeton Architectural Press, 2006) 35–54; Richard Weller, “Landscape (Sub) Urbanism in Theory and Practice,” in Landscape Journal 27 (2008): 2–8; Chris Reed, “The Agency of Ecology,” in Ecological Urbanism, ed. Moshen Mostafvai and Gareth Doherty (Zurich: Lars Muller Publishers and Harvard Graduate School of Design, 2010), 324–29; Robert Costanza et al., “The Value of the World’s Ecosystem Services and Natural Capital,” Nature 387 (1997): 253–60; Judith Layzer, Natural Experiments: Ecosystem-Based Management and the Environment (Cambridge, MA: MIT Press, 2008), 103–36.
70 See Congress for New Urbanism’s highly self-referential Form-Based Code Institute at http://formbasedcodes.org/organizations.
71 Tjallingii, “Ecology on the Edge,” 103–19.
72 Joan Nassauer and Paul Opdam, “Design in Science: Extending the Landscape Ecology Paradigm,” Landscape Ecology 23, no. 6 (July 2008): 633–44; Joan Nassauer, “The Appearance of Ecological-Systems as a Matter of Policy,” Landscape Ecology 6, no. 4 (March 1992): 239–50; Joan Nassauer, “Messy Ecosystems, Orderly Frames,” Landscape Journal 14, no. 2 (1995): 162.
73 Lloyd and Peel, “Green Belts in Scotland,” 641–42.
74 André Botequilha-Leitão, “Eco-Polycentric Urban Systems: An Ecological Region Perspective for Network Cities,” Challenges 3, no. 1 (June 2012): 1–42; Richard T. T. Forman and Michel Godron, Landscape Ecology (New York: John Wiley & Sons, 1986); Berger, Systemic Design© Can Change the World; Zev Naveh, “What Is Holistic Landscape Ecology? A Conceptual Introduction,” Landscape and Urban Planning 50 (2000): 7–26; Steward T. A. Pickett and Mary L. Cadenasso, “Linking Ecological and Built Components of Urban Mosaics: An Open Cycle of Ecological Design,” Journal of Ecology 96, no. 1 (2008): 8–12; Mark J. McDonnell and Steward T. Pickett, “Ecosystem Structure and Function along Urban-Rural Gradients: An Unexploited Opportunity for Ecology,” Ecology 71, no. 4 (1990): 1232–37; Michael I. W. Hopkins, “The Ecological Significance of Urban Fringe Belts,” Urban Morphology 16, no. 1 (2012): 41–54; Kevin Thomas and Steve Littlewood, “From Green Belts to Green Infrastructure? The Evolution of a New Concept in the Emerging Soft Governance of Spatial Strategies,” Planning, Practice & Research 25, no. 2 (2010): 203–22; Simon, “Urban Environments,” 170.
75 Sarah T. Lovell and Douglas M. Johnston, “Designing Landscapes for Performance Based on Emerging Principles in Landscape Ecology,” Ecology and Society 14, no. 1 (2009): 44; see also Richard T. T. Forman, “Basic Principles for Molding Land Mosaics,” in Urban Regions (Cambridge: Cambridge University Press, 2008), 223–42.
76 Susannah Hagan, “Metabolic Suburbs, or the Virtue of Low Densities,” Architectural Research Quarterly 16 (2012): 9–13.
77 Lloyd and Peel, “Green Belts in Scotland,” 641–42.
78 Michelle Elizabeth Allen, Cleansing the City: Sanitary Geographies in Victorian London (Athens: Ohio University Press, 2008).
79 Mira Engler, “Waste Landscapes: Permissible Metaphors in Landscape Architecture,” Landscape Journal 14, no. 1 (1995): 24; Mira Engler, Designing America’s Waste Landscapes (Baltimore: Johns Hopkins University Press, 2004); Alan Berger, Drosscape: Wasting Land in Urban America (New York: Princeton Architectural Press, 2006).
80 Craig E. Colten, “Chicago’s Waste Lands: Refuse Disposal and Urban Growth, 1840–1990,” Journal of Historical Geography 20, no. 2 (April 1994): 124.
81 Ibid.
82 Pierre Bélanger, “Landscapes of Disassembly,” Topos: The International Review of Landscape Architecture & Urban Design 60 (2007): 83–91.
83 Berger, Drosscape.
84 Celina Balderas-Guzmán, “Strategies for Systemic Urban Constructed Wetlands” (master’s thesis, MIT, 2013), accessed July 21, 2015, http://hdl.handle.net/1721.1/80907; Chandigarh Administration has launched initiative to recycle wastewater (treat effluent received from secondary treatment plants to tertiary levels, so it can be used to irrigate greenbelts): “Chandigarh Master Plan 2031,” Chandigarh, accessed December 15, 2015, http://chandigarh.gov.in/cmp_2031.htm.
85 Notes for wastewater nutrient recovery calculations: Ostara, a Canadian company, built technology that can turn 1 million residents’ wastewater into 2,400 tons/yr of phosphorous and ammonia-rich fertilizer (5-28-0 + 10 percent Mg).
Open Water
95 percent recovery of used water for 1 million residents would yield, on average, 95 million gal/d
10,600 acre lake at average depth of 10 feet (drought protected)
Corn
9,000 gal/acre/d—peak, high-yield corn water use (can be reduced by 70 percent due to rain input)
390,000–1,080,000 gal/acre for 1 growing season (120 days)
95 percent wastewater recovery could produce 29,200–10,600 acres of corn
140 lbs/acre for nitrate and 60 lbs/acre for phosphate
Phosphorous from wastewater nutrient recovery could fertilize 22,400 acres of corn
Vegetables
5,500–7,000 gal/acre/d—most vegetables and grain crops 330,000–840,000 gal/acre for 1 growing season (60–120 days)
95 percent wastewater recovery could produce 34,500–13,600 acres of vegetable crop
240 lbs/acre for nitrate and 170 lbs/acre for phosphate (averages for lettuce, USDA)
Phosphorous from wastewater nutrient recovery could fertilize 7,900 acres of vegetables
Wetland Habitat
Hydraulic loading rate of 7,000–70,000 gal/acre/d
95 percent recovery could support 1,300–13,000 acres of constructed wetlands
Golf Course
Typical course is 110–200 acres (including water features and out-of-play areas)
375,000 gal/acre for 1 growing season of turf or 750,000 gal/acre for 50 percent of area (Colorado)
95 percent wastewater recovery for 1 growing season (180 d) could support 230 golf courses
About as many as Colorado has (243)
Phosphorous from nutrient recovery could support 20,700 acres of golf course at 65 lb/acre
86 Diane Cardwell, “Fuel from Landfill Methane Goes on Sale,” October 2, 2013, accessed October 2, 2013, http://www.nytimes.com/2013/10/03/business/energy-environment/the-swamp-gas-station-fuel-from-landfill-methane-goes-on-sale.html; Jad Mouawad and Diane Cardwell, “Farm Waste and Animal Fats Will Help Power a United Jet,” New York Times, June 30, 2015, accessed July 21, 2015, http://www.nytimes.com/2015/06/30/business/energy-environment/farm-waste-and-animal-fats-will-help-power-a-united-jet.html?ref=topics.
87 Berger, Drosscape.
88 Base data for mapping from the “Land Use Inventory,” Chicago Metropolitan Agency for Planning (CMAP), accessed December 15, 2015, http://www.cmap.illinois.gov/data/land-use/inventory.