Chapter 2
Weighing Risks and Returns
IN THIS CHAPTER
 Surveying different types of risks
Figuring out expected returns for different investments
Determining how much you need your investments to return
A woman passes up eating a hamburger at a picnic because she heard that she could contract a deadly E. coli infection from eating improperly cooked meat. The next week, that same woman hops in the passenger seat of her friend’s old-model car that lacks airbags. This example isn’t meant to depress or frighten anyone. However, it’s trying to make an important point about risk — something everyone deals with on a daily basis. Risk is in the eye of the beholder. Many people base their perception of risk, in large part, on their experiences and what they’ve been exposed to. In doing so, they often fret about relatively small risks while overlooking much larger risks.
Sure, a risk of an E. coli infection from eating poorly cooked meat exists, so the woman who was leery of eating the hamburger at the picnic had a legitimate concern. However, that same woman got into the friend’s car without an airbag and placed herself at far greater risk of dying in that situation than if she had eaten the hamburger. In North America, some 37,000 people die in automobile accidents each year.
In the world of investing, most folks worry about certain risks — some of which may make sense and some of which may not — but at the same time they completely overlook or disregard other, more significant risks. This chapter discusses a range of investments and their risks and expected returns.
Evaluating Risks
Everywhere you turn, risks exist; some are just more apparent than others. Many people misunderstand risks. With increased knowledge, you may be able to reduce or conquer some of your fears and make more sensible decisions about reducing risks. For example, some people who fear flying don’t understand that statistically, flying is much safer than driving a car. You’re approximately 110 times more likely to die in a motor vehicle than in an airplane. But when a plane goes down, it’s big news because dozens and sometimes hundreds of people, who weren’t engaging in reckless behaviour, perish. Meanwhile, the national media seem to pay less attention to the 100 people, on average, who die on the road every day.
Then there’s the issue of control. Flying seems more dangerous to some folks because the pilots are in control of the plane, whereas in your car, you can at least be at the steering wheel. Of course, you can’t control what happens around you or mechanical problems with the mode of transportation you’re using.
This doesn’t mean that you shouldn’t drive or fly or that you shouldn’t drive to the airport. However, you may consider steps you can take to reduce the significant risks you expose yourself to in a car. For example, you can get a car with more safety features, or you can bypass riding with reckless taxi drivers.
Although some people like to live life to its fullest and take “fun” risks (how else can you explain mountain climbers, parachutists, and bungee jumpers?), most people seek to minimize risk and maximize enjoyment in their lives. The vast majority of people also understand that they’d be a lot less happy living a life in which they sought to eliminate all risks, and they likely wouldn’t be able to do so anyway.
 Likewise, if you attempt to avoid all the risks involved in investing, you likely won’t succeed, and you likely won’t be happy with your investment results and lifestyle. In the investment world, some people don’t go near stocks or any investment that they perceive to be volatile. As a result, such investors often end up with lousy long-term returns and expose themselves to some high risks that they overlooked, such as the risk of having inflation and taxes erode the purchasing power of their money.
You can’t live without taking risks. Risk-free activities or ways of living don’t exist. You can minimize but never eliminate risks. Some methods of risk reduction aren’t palatable because they reduce your quality of life. Risks are also composed of several factors. The following sections discuss the various types of investment risks and go over proven methods you can use to sensibly reduce these risks while not missing out on the upside that growth investments offer.
Market-value risk
Although the stock market can help you build wealth, most people recognize that it can also drop substantially — by 10, 20, or 30 per cent (or more) in a relatively short period of time. After peaking in 2000, Canadian and U.S. stocks, as measured by the major indexes representing the value of large companies (for Canada, the S&P/TSX Composite Index, and for the United States, the S&P 500 index), dropped about 50 per cent by 2002. Stocks on the NASDAQ, which is heavily weighted toward technology stocks, plunged more than 76 per cent from 2000 through 2002!
After a multi-year rebound, stocks peaked in 2007 and then dropped sharply during the “financial crisis” of 2008. From peak to bottom, Canadian, U.S., and global stocks dropped by some 50 — or more — per cent.
In a mere six weeks (from mid-July 1998 to early September 1998), large-company Canadian and U.S. stocks fell about 20 per cent. An index of smaller-company U.S. stocks dropped 33 per cent over a slightly longer period of two and a half months.
If you think that the stock market crash that occurred in the fall of 1987 was a big one (the market plunged by about a third in a matter of weeks), take a look at Tables 2-1 and 2-2, which list major declines over the past 100-plus years that were all worse than the 1987 crash. Note that two of these major declines happened in the 2000s: 2000 to 2002 and 2007 to 2009.
|
Period |
Size of Fall |
|---|---|
|
1929–1932 |
80% (ouch!) |
|
1937–1942 |
56% |
|
2000–2002 |
50% |
|
2007–2009 |
48% |
|
1980–1982 |
44% |
|
1973–1974 |
38% |
|
2020 |
37% |
|
1987–1987 |
31% |
|
1956–1957 |
30% |
* As measured by changes in the TSE/TSX Composite Index
|
Period |
Size of Fall |
|---|---|
|
1929–1932 |
89% (ouch!) |
|
2007–2009 |
55% |
|
1937–1942 |
52% |
|
1906–1907 |
49% |
|
1890–1896 |
47% |
|
1919–1921 |
47% |
|
1901–1903 |
46% |
|
1973–1974 |
45% |
|
1916–1917 |
40% |
|
2000–2002 |
39% |
|
2020 |
37% |
* As measured by changes in the Dow Jones Industrial Average
Real estate exhibits similar unruly, annoying tendencies. Although real estate (like stocks) has been a terrific long-term investment, various real estate markets get clobbered from time to time.
When the oil industry collapsed in Alberta in the early 1980s, real estate prices in the province dropped by 25 per cent. And after a massive run-up in prices in the mid-1980s, house prices in the Toronto area plummeted by nearly 28 per cent over the next few years. Across Canada, after a whopping 50 per cent rise from 1978 to 1981, house prices dropped by 35 per cent in just over a year. Then, after hitting a new high in 1990, the market fell by 15 per cent in just 12 months, and by 1996 was down 22 per cent.
In the United States, housing prices took a 25 per cent tumble from the late 1920s to the mid-1930s. Later, in the 1980s and early 1990s, the northeastern United States became mired in a severe recession, and real estate prices fell by 20-plus per cent in many areas. After peaking near 1990, many of the West Coast housing markets, especially those in California, experienced falling prices — dropping 20 per cent or more in most areas by the mid-1990s.
Declining U.S. housing prices in the mid- to late 2000s garnered unprecedented attention. Some folks and pundits acted like it was the worst housing market ever. Foreclosures increased in part because of buyers who financed their home purchases with risky mortgages. But note that housing market conditions also vary tremendously by area. For example, housing prices in Toronto and Vancouver have often shown double-digit increases while smaller cities and towns were experiencing down-markets. In the United States, some portions of the Pacific Northwest and South actually appreciated during the mid- to late 2000s, while other U.S. markets experienced substantial declines.
After reading this section, you may want to keep all your money in the bank — after all, you know you won’t likely lose your money, and you won’t have to be a nonstop worrier. Since the Canada Deposit Insurance Corporation (CDIC) came into existence, which protects deposits at banks and trust companies up to $100,000, people don’t lose 20, 40, 60, or 80 per cent of their bank-held savings vehicles within a few years, but major losses prior to then did happen. Just keep in mind, though, that just letting your money sit around would be a mistake.
If you pass up the stock and real estate markets simply because of the potential market-value risk, you miss out on a historic, time-tested method of building substantial wealth. Instead of seeing declines and market corrections as horrible things, view them as potential opportunities or “sales.” Try not to give in to the human emotions that often scare people away from buying something that others seem to be shunning.
Later in this chapter, you’ll discover the generous returns that stocks and real estate as well as other investments have historically provided. The following sections suggest some simple things you can do to lower your investing risk and help prevent your portfolio from suffering a huge fall (or “drawdown”).
Diversify for a gentler ride
If you worry about the health of the economy, the government, and the dollar, you can reduce your investment risk by investing outside of Canada. Most large Canadian companies do business in the United States and overseas, so when you invest in larger Canadian company stocks, you get some international investment exposure. You can also invest in international company stocks, ideally via mutual funds and exchange-traded funds (see Book 3).
Of course, investing overseas can’t totally protect you in the event of a global economic catastrophe. If you worry about the risk of such a calamity, you should probably also worry about a huge meteor crashing into Earth. Maybe there’s a way to colonize outer space.
 Diversifying your investments can involve more than just your stock portfolio. You can also hold some real estate investments to diversify your investment portfolio. Many real estate markets appreciated in the early 2000s while North American stock markets were in the doghouse. Conversely, when real estate in many regions entered a multi-year slump in the mid-2000s, stocks performed well during that period. In the late 2000s, stock prices fell sharply while real estate prices in many major centres rose, but then stocks came roaring back. See Book 7 for details on real estate investing.
Consider your time horizon
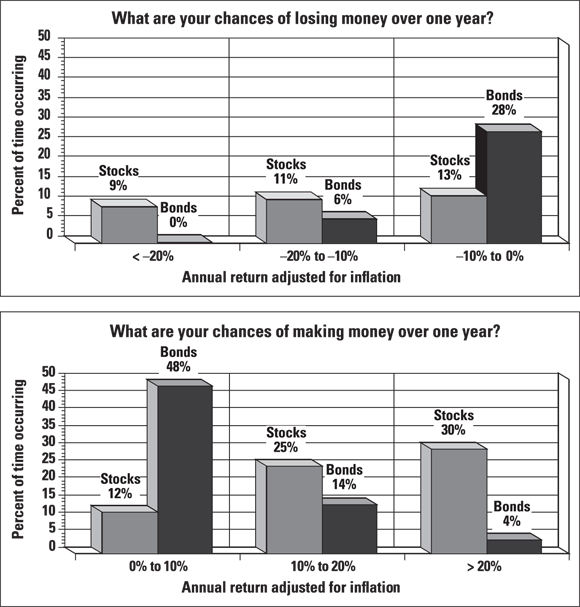
Investors who worry that the stock market may take a dive and take their money down with it need to consider the length of time that they plan to invest. In a one-year period in the stock and bond markets, a wide range of outcomes can occur (as shown in Figure 2-1). History shows that you lose money about once in every three years that you invest in the stock and bond markets. However, stock market investors have made money (sometimes substantial amounts) approximately two-thirds of the time over a one-year period. (Bond investors made money about two-thirds of the time, too, although they made a good deal less on average.)
© John Wiley & Sons, Inc.
FIGURE 2-1: What are the odds of making or losing money in the Canadian markets? In a single year, you win far more often (and bigger) with stocks than with bonds.
Although the stock market is more volatile than the bond market in the short term, stock market investors have earned far better long-term returns than bond investors have. (See the later section “Stock returns” for details.) Why? Because stock investors bear risks that bond investors don’t bear, and they can reasonably expect to be compensated for those risks. Keep in mind, however, that bonds generally outperform a boring old bank account.
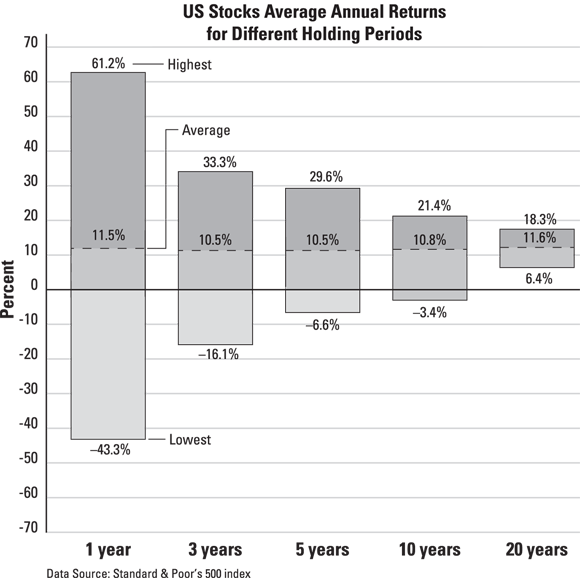
History has shown that the risk of a stock or bond market fall becomes less of a concern the longer that you plan to invest. Figure 2-2 shows that as the holding period for owning stocks increases from 1 year to 3 years to 5 years to 10 years and then to 20 years, there’s a greater likelihood of seeing stocks increase in value. In fact, over any 20-year time span, the U.S. stock market, as measured by the S&P 500 index of larger company stocks, has never lost money, even after you subtract the effects of inflation.
© John Wiley & Sons, Inc.
FIGURE 2-2: The longer you hold stocks, the more likely you are to make money.
Figure 2-2 uses U.S. data simply because several more decades of market data are available, giving a better sense of the long-term behaviour of the stock market. However, the same basic point is true for Canada. Since 1957, only one five-year period has had a negative return. In other words, if you had invested in the broad market (meaning your returns were similar to the composite index) and held on for five years, in only one period would you have had less after five years than you started with. If you had invested and stayed invested for ten years, you would always have come out ahead. To put it another way, starting in 1957, if you had invested in any year and held those investments for a minimum of ten years, you would always have ended up with a profit, assuming your returns matched those of the index.
Most stock market investors are concerned about the risk of losing money. Figure 2-2 clearly shows that the key to minimizing the probability that you’ll lose money in stocks is to hold them for the longer term. Don’t invest in stocks unless you plan to hold them for at least five years — and preferably a decade or longer. Check out Book 2 for more on using stocks as a long-term investment.
Pare down holdings in bloated markets
Perhaps you’ve heard the expression “buy low, sell high.” Although you can’t time the markets (that is, predict the most profitable time to buy and sell), spotting a greatly over-priced or under-priced market isn’t too difficult. You can use some simple yet powerful methods to measure whether a particular investment market is of fair value, of good value, or overpriced. You should avoid overpriced investments for two important reasons:
- If — and when — these over-priced investments fall, they usually fall farther and faster than more fairly priced investments.
- You should be able to find other investments that offer higher potential returns.
Ideally, you want to avoid having a lot of your money in markets that appear over-priced. Practically speaking, avoiding over-priced markets doesn’t mean that you should try to sell all your holdings in such markets with the vain hope of buying them back at a much lower price. However, you may benefit from the following strategies:
- Invest new money elsewhere. Focus your investment of new money somewhere other than the over-priced market; put it into investments that offer you better values. As a result, without selling any of your seemingly expensive investments, you make them a smaller portion of your total holdings. If you hold investments outside of tax-sheltered plans, focusing your money elsewhere also allows you to avoid incurring taxes from selling appreciated investments.
- If you have to sell, sell the expensive stuff. If you need to raise money to live on, such as for retirement or for a major purchase, sell the pricier holdings. As long as the taxes aren’t too troublesome, it’s better to sell high and lock in your profits.
Individual-investment risk
A down-draft can put an entire investment market on a roller-coaster ride, but healthy markets also have their share of individual losers. For example, from the early 1980s through the late 1990s, Canadian and U.S. stock markets had one of the greatest appreciating markets in history. You’d never know it, though, if you held one of the great losers of that period.
Consider a company now called Navistar, which has undergone enormous transformations in recent decades. This company used to be called International Harvester and manufactured farm equipment, trucks, and construction and other industrial equipment. Today, Navistar makes mostly trucks.
In late 1983, this company’s stock traded at more than US$140 per share. It then plunged more than 90 per cent over the ensuing decade (as shown in Figure 2-3). Even with a rally in recent years, Navistar stock still trades at less than US$20 per share (after dipping below US$10 per share). Lest you think that’s a big drop, this company’s stock traded as high as US$455 per share in the late 1970s! If a worker retired from this company in the late 1970s with $200,000 invested in the company stock, the retiree’s investment would be worth about $6,000 today! On the other hand, if the retiree had simply swapped his stock at retirement for a diversified portfolio of stocks, which you find out how to build in Book 2, his $200,000 nest egg would’ve instead grown to more than $5 million!

© John Wiley & Sons, Inc.
FIGURE 2-3: Even the bull market of the 1990s wasn’t kind to every company.
Like most other markets, the Canadian stock market paled by comparison with the US juggernaut in the 1990s, but this country has had its share of stocks that have plummeted in value. How about Dylex, which through its many brand-name outlets, such as Suzy Shier, at one time took in one out of every ten dollars consumers spent in retail clothing outlets? The stock, which began the 1990s at $24, ended the decade languishing beneath the $10 mark, dwindling lower and lower until the company eventually went under in 2001.
And then, of course, there’s Nortel. In the late 1990s, many investors happily recounted how well they’d done by buying Nortel. They often had made two, three, even ten times or more on their original investment. Nortel, or so people were told, just couldn’t keep up with the Internet-driven demand for its products. At its peak, Nortel employed 90,000 workers worldwide and was worth nearly $300 billion.
And the press was cheering them on. Nortel even got feature stories written about it when, due to a chronic shortage of workers, it sent a bus to travel around the United States, trying to hire folks. That turned out to be not a sign of great things to come, but a last great gasp. The stock soon peaked at over $120 in August 2000. After that?
Well, in a matter of months, the company’s cheerleaders were proven to be completely, hopelessly wrong. Nortel crumbled, and by October 2002 it had literally turned into a penny stock, trading at under a buck. Many investors were now calling Nortel one of their “worst moves.” By the end of 2008, the stock was taken off the New York Stock Exchange because it had had an average closing price below US$1 for more than 30 days. By the end of the decade, Nortel had been also delisted by the Toronto Stock Exchange, and went bankrupt.
Just as individual stock prices can plummet, so can individual real estate property prices. In California during the 1990s, for example, earthquakes rocked the prices of properties built on landfills. These quakes highlighted the dangers of building on poor soil. In the decade prior, real estate values in the communities of Times Beach, Missouri, and Love Canal, New York, plunged because of carcinogenic toxic waste contamination. (Ultimately, many property owners in these areas received compensation for their losses from the federal government as well as from some real estate agencies that didn’t disclose these known contaminants.)
Here are some simple steps you can take to lower the risk of individual investments that can upset your goals:
- Do your homework. When you purchase real estate, a whole host of inspections can save you from buying a money pit. With stocks, you can examine some measures of value and the company’s financial condition and business strategy to reduce your chances of buying into an overpriced company or one on the verge of major problems. Book 2 gives you information on researching your stock investment.
- Diversify. Investors who seek growth invest in securities such as stocks. Placing significant amounts of your capital in one or a handful of securities is risky, particularly if the stocks are in the same industry or closely related industries. To reduce this risk, purchase stocks in a variety of industries and companies within each industry. (See Book 2 for details.)
- Hire someone to invest for you. The best funds offer low-cost, professional management and oversight as well as diversification. Stock funds typically own 25 or more securities in a variety of companies in different industries.
Purchasing-power risk (aka inflation risk)
Increases in the cost of living (that is, inflation) can erode the value of your retirement resources and what you can buy with that money — also known as its purchasing power. When Teri retired at the age of 60, she was pleased with her retirement income. She was receiving an $800-per-month pension and $1,200 per month from money that she had invested in long-term bonds. Her monthly expenditures amounted to about $1,500, so she was able to save a little money for an occasional trip.
Fast-forward 15 years. Teri still receives $800 per month from her pension, but now she gets only $900 per month of investment income, which comes from some certificates of deposit. Teri bailed out of bonds after she lost sleep over the sometimes roller-coaster-like price movements in the bond market. Her monthly expenditures now amount to approximately $2,400, and she uses some of her investment principal (original investment). She’s terrified of outliving her money.
Teri has reason to worry. She has 100 per cent of her money invested without protection against increases in the cost of living. Although her income felt comfortable in the beginning of her retirement, it doesn’t at age 75, and Teri may easily live another 15 or more years.
The erosion of the purchasing power of your investment dollar can, over longer time periods, be as bad as or worse than the effect of a major market crash. Table 2-3 shows the effective loss in purchasing power of your money at various rates of inflation and over differing time periods.
TABLE 2-3 Inflation’s Corrosive Effect on Your Money’s Purchasing Power
|
Inflation Rate |
10 Years |
15 Years |
25 Years |
40 Years |
|---|---|---|---|---|
|
2% |
–18% |
–26% |
–39% |
–55% |
|
4% |
–32% |
–44% |
–62% |
–81% |
|
6% |
–44% |
–58% |
–77% |
–90% |
|
8% |
–54% |
–68% |
–85% |
–95% |
|
10% |
–61% |
–76% |
–91% |
–98% |
Skittish investors have tried to keep their money in bonds and money market accounts, thinking they were playing it safe. The risk in this strategy is that your money won’t grow enough over the years for you to accomplish your financial goals. In other words, the lower the return you earn, the more you need to save to reach a particular financial goal.
A 40-year-old wanting to accumulate $500,000 by age 65 would need to save $722 per month if she earns a 6 per cent average annual return, but she needs to save only $377 per month if she earns a 10 per cent average return per year. Younger investors need to pay the most attention to the risk of generating low returns, but so should younger senior citizens. Even by the age of 65, seniors need to recognize that a portion of their assets may not be used for a decade or more from the present.
Career risk
Your ability to earn money (also called “human capital” by economists) is most likely your single biggest asset or at least one of your biggest assets. Most people achieve what they do in the working world through education and hard work. By education, we’re not simply talking about what one learns in formal schooling. Education is a lifelong process. We’ve learned far more about business from our own front-line experiences and those of others, as well as training others, than we’ve learned in educational settings. We also read a lot.
If you don’t continually invest in your education, you risk losing your competitive edge. Your skills and perspectives can become dated and obsolete. Although that doesn’t mean you should work 80 hours a week and never do anything fun, it does mean that part of your “work” time should involve upgrading your skills.
The best organizations are those that recognize the need for continual knowledge and invest in their workforce through training and career development. Just be sure to look at your own career objectives, which may not be the same as your company’s.
Analysing Returns
When you make investments, you have the potential to make money in a variety of ways. Each type of investment has its own mix of associated risks that you take when you part with your investment dollar and, likewise, offers a different potential rate of return. The following sections cover the returns you can expect with each of the common investing avenues. But first, you go through the components of calculating the total return on an investment.
The components of total return
To figure out exactly how much money you’ve made (or lost) on your investment, you need to calculate the total return. To come up with this figure, you need to determine how much money you originally invested and then factor in the other components, such as interest, dividends, and capital appreciation (or depreciation), also known as capital gains.
If you’ve ever had money in a bank account that pays interest, you know that the bank pays you a small amount of interest when you allow it to keep your money. The bank then turns around and lends your money to some other person or organization at a much higher rate of interest. The rate of interest is also known as the yield. So, if a bank tells you that its savings account pays 2 per cent interest, the bank may also say that the account yields 2 per cent. Banks usually quote interest rates or yields on an annual basis. Interest that you receive is one component of the return you receive on your investment.
If a bank pays monthly interest, the bank also likely quotes a compounded effective annual yield. After the first month’s interest is credited to your account, that interest starts earning interest as well. So, the bank may say that the account pays 2 per cent, which then compounds to an effective annual yield of 2.04 per cent.
When you lend your money directly to a company — which is what you do when you invest in a bond that a corporation or a government issues — you also receive interest. Bonds, as well as stocks (which are shares of ownership in a company), fluctuate in value after they’re issued.
When you invest in a company’s stock, you hope that the stock increases (appreciates) in value. Of course, a stock can also decline, or depreciate, in value. This change in market value is part of your return from a stock or bond investment: (Current investment value – Original investment) ÷ Original investment = Appreciation or depreciation.
For example, if one year ago you invested $10,000 in a stock (you bought 1,000 shares at $10 per share) and the investment is now worth $11,000 (each share is worth $11), your investment’s appreciation looks like this: ($11,000 – $10,000) ÷ $10,000 = 10%.
Stocks can also pay dividends, which are the company’s sharing of some of its profits with you as a shareholder. Some companies, particularly those that are small or growing rapidly, choose to reinvest all their profits back into the company. (Of course, some companies don’t turn a profit, so they don’t have anything to pay out!) You need to factor any dividends into your return as well.
Suppose that in the previous example, in addition to your stock investment appreciating from $10,000 to $11,000, it paid you a dividend of $100 ($1 per share). Here’s how you calculate your total return: ([Current investment value – Original investment] + Dividends) ÷ Original investment = Total return.
You can apply this formula to the example like so: ([$11,000 – $10,000] + $100) ÷ $10,000 = 11%.
After-tax returns
Although you may be happy that your stock has given you an 11 per cent return on your invested dollars, note that unless you held your investment in a tax-deferred Registered Retirement Savings Plan (RRSP), registered retirement plan, Registered Education Savings Plan, or Tax-Free Savings Account (TFSA), you owe taxes on your return. Specifically, the dividends and investment appreciation that you realize upon selling are taxed, although often at relatively low rates. The tax rates on so-called long-term capital gains and stock dividends are lower than the tax rates on other income. Chapter 3 discusses the different tax rates that affect your investments and explains how to make tax-wise investment decisions that fit with your overall personal financial situation and goals.
If you’ve invested in savings accounts, money market accounts, or bonds outside of a tax-deferred registered retirement plan or a TFSA, you owe the Canada Revenue Agency taxes on the interest income.
Often, people make investing decisions without considering the tax consequences of their moves. This is a big mistake. What good is making money if the government takes away a substantial portion of it?
If you’re in a moderate tax bracket, taxes on your investment probably run in the neighborhood of 30 per cent (federal and provincial). So, if your investment returned 6 per cent before taxes, you’re left with a net return of about 4.2 per cent after taxes.
Psychological returns
Profits and tax avoidance can powerfully motivate your investment selections. However, as with other life decisions, you need to consider more than the bottom line. Some people want to have fun with their investments. Of course, they don’t want to lose money or sacrifice a lot of potential returns. Fortunately, less expensive ways to have fun do exist!
Psychological rewards compel some investors to choose particular investment vehicles such as individual stocks, real estate, or a small business. Why? Because compared with other investments, such as managed mutual and exchange-traded funds, they see these investments as more tangible and, well, more fun.
Be honest with yourself about why you choose the investments that you do. Allowing your ego to get in the way can be dangerous. Do you want to invest in individual stocks because you really believe that you can do better than the best full-time professional money managers? Chances are high that you won’t. Such questions are worth considering as you contemplate which investments you want to make.
Savings, high-interest, and money market account returns
You need to keep your extra cash that awaits investment (or an emergency) in a safe place, preferably one that doesn’t get hammered by the sea of changes in the financial markets. By default and for convenience, many people keep their extra cash in a bank savings account. Although the bank offers the backing of the Canada Deposit Insurance Corporation (CDIC), it comes at a price. Most banks pay a relatively low interest rate on their savings accounts.
A far better place to keep your liquid savings are the growing number of high-interest savings accounts (HISAs) offered by companies such as Alterna Bank, DUCA Credit Union, or Tangerine, and now most mutual fund companies and big banks as well. These accounts typically offer rates anywhere from 4 to 40 — yes, 40 — times the rate on savings accounts.
Another good place to keep your liquid savings is in a money market mutual fund. These are the safest types of mutual funds around and, for all intents and purposes, equal a bank savings account’s safety. The best money market funds generally pay higher yields than most bank savings accounts. Unlike a bank, money market mutual funds tell you how much they deduct for the service of managing your money.
If you don’t need immediate access to your money, consider using Treasury bills (T-bills) or guaranteed investment certificates (GICs; see Chapter 5 in Book 3), which are usually issued for terms of anywhere from three months to five years. Your money will generally earn more in one of these vehicles than in a bank savings account. (In recent years, the yields on T-bills have been so low that the best CDIC-insured bank savings accounts have higher yields.) Rates vary by institution, so it’s essential to shop around. The drawback to T-bills and guaranteed investment certificates is that you incur a penalty (with GICs) or a transaction fee (with T-bills) if you withdraw your investment before the term expires.
Bond returns
When you buy a bond, you lend your money to the issuer of that bond (borrower), which is generally the federal government, a provincial government, or a corporation, for a specific period of time. When you buy a bond, you expect to earn a higher yield than you can with a money market or savings account. You’re taking more risk, after all. Companies can and do go bankrupt, in which case you may lose some or all of your investment.
Generally, you can expect to earn a higher yield when you buy bonds that
- Are issued for a longer term: The bond issuer is tying up your money at a fixed rate for a longer period of time.
- Have lower credit quality: The bond issuer may not be able to repay the principal.
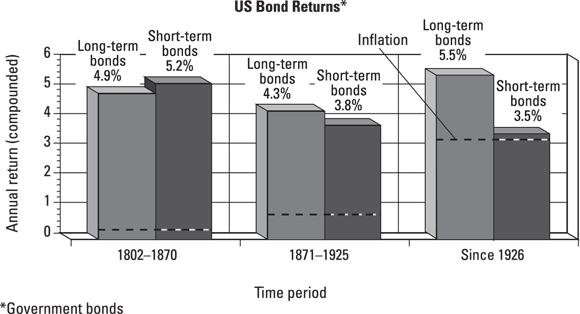
Wharton School of Business professor Jeremy Siegel has tracked the performance of bonds and stocks back to 1802. Although you may say that what happened in the 19th century has little relevance to the financial markets and economy of today, the decades since the Great Depression of the 1930s, which most other return data track, are a relatively small slice of time. Figure 2-4 presents the data, so if you’d like to give more emphasis to the recent numbers, you may.
© John Wiley & Sons, Inc.
FIGURE 2-4: A historical view of U.S. bond performance: Inflation has eroded bond returns more in recent decades.
Note that although the rate of inflation has increased since the Great Depression, bond returns haven’t increased over the decades. Long-term bonds maintained slightly higher returns in recent years than short-term bonds. The bottom line: Bond investors typically earn about 4 to 5 per cent per year. See Chapter 5 in Book 3 for more about bonds.
Stock returns
Investors expect a fair return on their investments. If one investment doesn’t offer a seemingly high enough potential rate of return, investors can choose to move their money into other investments that they believe will perform better. Instead of buying a diversified basket of stocks and holding, some investors frequently buy and sell, hoping to cash in on the latest hot investment. This tactic seldom works in the long run.
 Unfortunately, some of these investors use a rear-view mirror when they purchase their stocks, chasing after investments that have recently performed strongly on the assumption (and the hope) that those investments will continue to earn good returns. But chasing after the strongest performing investments can be dangerous if you catch the stock at its peak, ready to begin a downward spiral. You may have heard that the goal of investing is to buy low and sell high. Chasing high-flying investments can lead you to buy high, with the prospect of having to sell low if the stock runs out of steam. Even though stocks as a whole have proved to be a good long-term investment, picking individual stocks is a risky endeavour. See Book 2 for advice on making sound stock investment decisions.
A tremendous amount of data exists regarding stock market returns. In fact, in the U.S. markets, data going back more than two centuries document the fact that stocks have been a terrific long-term investment. The long-term returns from stocks that investors have enjoyed, and continue to enjoy, have been remarkably constant from one generation to the next.
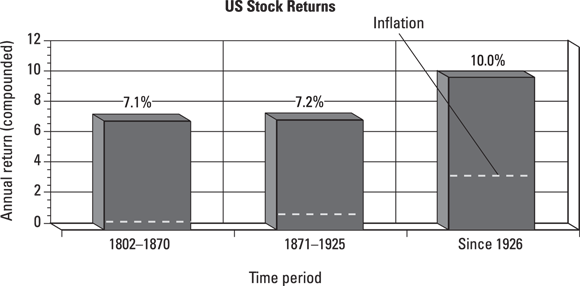
Going all the way back to 1802, the U.S. stock market has produced an annual return of 8.3 per cent, while inflation has grown at 1.4 per cent per year. Thus, after subtracting for inflation, stocks have appreciated about 6.9 per cent faster annually than the rate of inflation. The U.S. stock market returns have consistently and substantially beaten the rate of inflation over the years (see Figure 2-5).
© John Wiley & Sons, Inc.
FIGURE 2-5: History shows that stocks have been a consistent long-term winner.
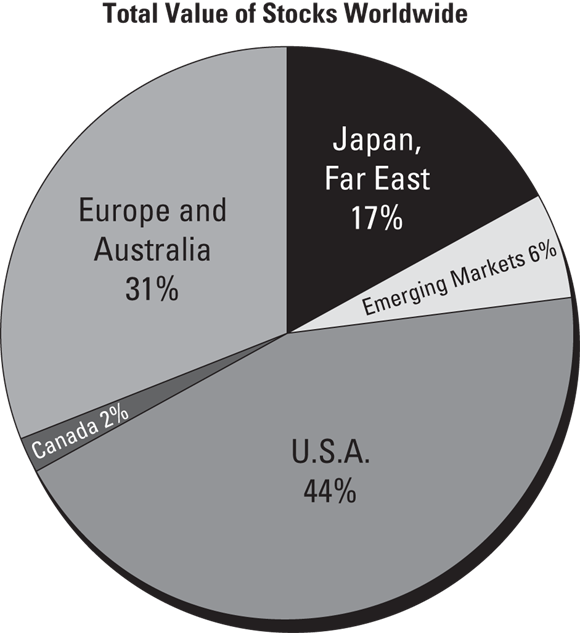
Stocks don’t exist only in Canada and the United States, of course (see Figure 2-6). More than a few investors seem to forget this fact, as they did during the sizzling performance of the Canadian and U.S. stock markets during the late 1990s. As discussed in the earlier section “Diversify for a gentler ride,” one advantage of buying and holding overseas stocks is that they don’t always move in tandem with North American stocks. As a result, overseas stocks help diversify your portfolio.
© John Wiley & Sons, Inc.
FIGURE 2-6: Canada represents just a small fraction of the world’s total stock market value.
In addition to enabling Canadian investors to diversify, investing overseas has proved to be profitable. The investment banking firm Morgan Stanley tracks the performance of stocks in both economically established countries and so-called emerging economies. As the name suggests, countries with emerging economies (for example, Brazil, China, India, Malaysia, Mexico, Russia, and Taiwan) are “behind” economically, but show high rates of growth and progress.
Stocks are the best long-term performers, but they have more volatility than bonds and Treasury bills. A balanced portfolio gets you most of the long-term returns of stocks without much of the volatility.
Real estate returns
Over the years, real estate has proved to be about as lucrative as investing in the stock market. Whenever there’s a real estate downturn, folks question this historic fact. However, just as stock prices have down periods, so, too, do real estate markets.
The fact that real estate offers solid long-term returns makes sense because growth in the economy, in jobs, and in population ultimately fuels the demand for real estate.
Consider what has happened to the Canadian population over the past two centuries. In 1867 a mere 3.5 million people lived within Canada’s borders. In 1900 that figure grew to over 5 million, and by 1929 it had doubled to over 10 million. Today it’s about 37 million. All these people need places to live, and as long as jobs exist, the income from jobs largely fuels the demand for housing.
Businesses and people have an understandable tendency to cluster in major cities and suburban towns. Although some people commute, most people and businesses locate near major highways, airports, and so on. Thus, real estate prices in and near major metropolises and suburbs generally appreciate the most. Consider the areas of the world that have the most expensive real estate prices: Hong Kong, Singapore, London, San Francisco, New York, and Boston. Here at home, the most expensive cities are Vancouver and Toronto. What these areas have in common are lots of businesses and people and limited land.
Contrast these areas with the many rural parts of Canada where the price of real estate is relatively low because of the abundant supply of buildable land and the relatively lower demand for housing.
See Book 7 for an introduction to real estate investing.
Small-business returns
You have several choices for tapping into the exciting potential of the small-business world. If you have the drive and determination, you can start your own small business. Or perhaps you have what it takes to buy an existing small business. If you obtain the necessary capital and skills to assess opportunities and risk, you can invest in someone else’s small business.
What potential returns can you get from small business? Small-business owners who do something they really enjoy will tell you that the non-financial returns can be major! But the financial rewards can be attractive as well.
Every year, Forbes magazine publishes a list of the world’s wealthiest individuals. Perusing this list shows that most of these people built their wealth by taking a significant ownership stake and starting a small business that became large. These individuals achieved extraordinarily high returns (often in excess of hundreds of per cent per year) on the amounts they invested to get their companies off the ground.
You may also achieve potentially high returns from buying and improving an existing small business. Such small-business investment returns may be a good deal lower than the returns you may gain from starting a business from scratch.
Unlike the stock market, where plenty of historic rate-of-return data exists, data on the success — or lack thereof! — that investors have had with investing in small private companies is harder to come by. Smart venture capitalist firms operate a fun and lucrative business: They identify and invest money in smaller start-up companies that they hope will grow rapidly and eventually go public. Venture capitalists allow outsiders to invest with them via limited partnerships. To gain entry, you generally need $1 million to invest, although there are some exceptions from time to time. (This isn’t an equal-opportunity investment club!)
Venture capitalists, also known as general partners, typically skim off 20 per cent of the profits and also charge limited partnership investors a hefty 2 to 3 per cent annual fee on the amount that they’ve invested. The return that’s left over for the limited partnership investors isn’t always stupendous. According to Venture Economics, a U.S. firm that tracks limited partners’ returns, venture funds have averaged comparable annual returns to what stock market investors have earned on average over this same period. The general partners that run venture capital funds make more than the limited partners do.
You can attempt to do what the general partners do in venture capital firms and invest directly in small private companies. But you’re likely to be investing in much smaller and simpler companies. Earning venture capitalist returns isn’t easy to do.
Considering Your Goals
How much do you need or want to earn? That may seem like an extraordinarily silly question to ask you. Who doesn’t want to earn a high return? However, although investing in stocks, real estate, or a small business can produce high long-term returns, investing in these vehicles comes with greater risk, especially over the short term.
Some people can’t stomach the risk. Others are at a time in their lives when they can’t afford to take great risk. If you’re near or in retirement, your portfolio and nerves may not be able to wait a decade for your riskier investments to recover after a major stumble. Perhaps you have sufficient assets to accomplish your financial goals and are concerned with preserving what you do have rather than risking it to grow more wealth.
If you work for a living, odds are that you need and want to make your investments grow at a healthy clip plus lower your income taxes. If your investments grow slowly, you may fall short of your goal of owning a home or retiring or changing careers.