11. Cyclicals And Turnarounds
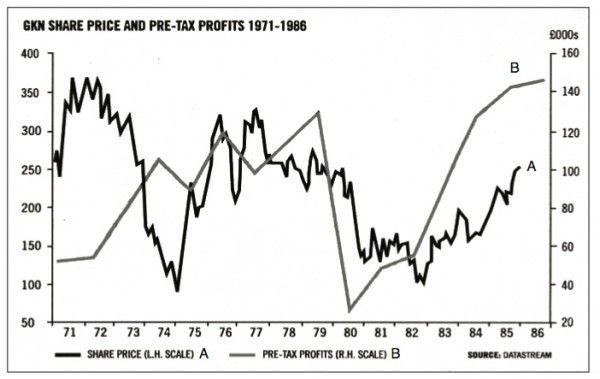
Most companies benefit from an upturn in the economy and suffer if the economy turns down. However, a really great growth stock will usually manage to produce increased earnings even in the depths of a recession. Some companies with strong business franchises seem to be amazingly unaffected by the gloom and despondency around them. Cyclical stocks suffer much more than most – building and construction companies, steel companies and automobile manufacturers and distributors cannot buck the trend. The most they can hope to achieve is that at the top of the next cycle, they will be ahead of their previous peak, and at the bottom be better placed than last time around.
Hair-raising stuff, but there is plenty of money to be made if you can get your timing right. To do this you have to understand the anatomy of business cycles. Let us take house building for example. At the bottom of the cycle a few survivors in the business will benefit from reduced competition and begin to turn the corner. They would be finding that prime land and labour were far easier to acquire and, therefore, much cheaper than during the boom. Fewer houses would be under construction, so the prices of those being sold would be more favourable to the builder, providing healthier margins and better profits. Other entrepreneurs aware of the growing opportunity would set up as builders or expand their existing building businesses and would compete for both labour and land. Cost pressures begin to increase. Some of the builders borrow to stock-pile land which is becoming more difficult to acquire and therefore more expensive. Very soon, there is over-capacity in the business, so some house builders slash prices to maintain market share. Margins erode due to lower prices and increased costs. The banks, fearing their loans are in jeopardy, foreclose on the more marginal businesses, which become bankrupt. Some of the more entrepreneurial builders decide that there may be better opportunities elsewhere. Competition falls away, pricing pressures ease and profits begin to improve. The cycle starts all over again.
Clearly, the time to buy is before profits rise and the time to sell is when conditions are obviously improving. The important point to grasp is that a cyclical stock should
never
command a very high multiple and a low dividend yield near to the top of the cycle. Let us look at GKN, a typical cyclical stock, to see how its profits and share price were affected by the last two business cycles.
Obviously, you want to time your purchases so that you buy near the bottom of the cycle, but you also want to make sure that your selection is going to survive. Of course, you would enjoy a far bigger gain if you invested in an unlikely candidate for survival which surprised everyone by coming through the recession unharmed. The greater the risk the greater the potential reward. The riskier companies usually have very high borrowings at the bottom of a cycle. When they run out of money, much may depend upon the attitude of their bankers and loan stockholders.
Here are some guidelines that should help you with your selections:
-
- Companies with well-known, national names have a better chance of survival, if only because there seems to be greater reluctance to let them fail. They are an important part of the fabric of our society, so the bankers, loan stockholders and other creditors involved may stretch a few points to be helpful. In some cases, this may be to avoid the undesirable publicity of being accused of pulling the plug, and in others a genuine desire to help the company.
-
- Usually, a company with a well-known name will have already attracted a stockbroker of high calibre and some strong institutional shareholders, who are more likely to help place stock to finance a reconstruction. You must make sure that the company stockbroker is a leading one.
-
- Seek out companies with familiar brand names and other kinds of strong business franchises. Look particularly for those companies which usually have a high return on capital employed.
-
- The calibre of management is obviously crucial. If the old guard remains totally in charge you should be more cautious. A change of management with someone able becoming Chairman or Chief Executive, obviously bodes well for the future and makes your investment a better bet.
-
- Keep an eye open for major competitors going out of business. This is always a very good sign. Your selection should, as a result, be able to secure a larger and more profitable piece of the eventual pie.
-
- Seek out companies with asset backing in excess of market price. These assets should help to generate earnings when the economy recovers. Meanwhile, they may catch the eye of a predator. With the hope of a takeover in mind, you should give preference to companies with a widely based shareholding and no control blocks.
-
- As usual, there is no escape from a little arithmetic. What is the brokers’ consensus forecast in the event of a recovery? What was the P/E ratio at the top of the last cycle? With these two figures in mind, you can easily calculate your potential upside, which for a company with containable borrowings (see 8. below) should be at least 100% and possibly much more.
-
- The magic word ‘borrowings’ brings me to another important point. You should draw the limit at total indebtedness exceeding the net asset value. In other words, gearing should not be more than 100%. In the rare cases when you find that the rest of your criteria are overwhelmingly satisfied, you could stretch the 100% limit, but in that event you should be looking for upside potential in excess of 100%. The extra risk must be balanced by the promise of extra reward.
-
- It is absolutely essential that the forecast for the year ahead shows rising profits or a return to profits. Losses could produce the kind of fatality you are seeking to avoid.
-
- Timing is of the utmost importance. If someone throws a safe out of a window from the penthouse of a skyscraper, you will be severely damaged if you lean out of a window on the third floor and try to catch it. Wait until you are really sure that the cycle has hit bottom. You are looking for the first glimmer of a change – the first hint of good news after the gloom. You will pay a little more this way but look upon the extra cost as an insurance premium.
-
- You want your selection to benefit massively from the upturn. Therefore, you need to ensure, as far as you possibly can, that the company’s main infrastructure has remained intact throughout the recession. The brokers’ consensus profit forecast reflects this in arithmetical terms, but here are a few further specific pointers:
-
a) Ensure that the company has maintained capacity and that major factories have not been sold off.
b) Look for turnover being largely upheld with only margins suffering. This is an excellent indicator as margins can recover quickly.
c) Check if there has been substantial cost cutting. You want your company to be lean and mean in the upturn.
d) Look for companies that are usually good cash generators. If tax losses are allowable for set-off against future profits, short-term debts could be repaid very speedily.
-
- Directors’ share dealings are very important when considering cyclical situations. Seeing a number of Directors buying shares near the low point of the cycle is obviously a very encouraging sign. They might be wrong, but they ought to know.
-
- Buying at the time of a rights issue can be a very attractive way of participating in a recovery. You have the great advantage of being able to study an up-to-date circular to shareholders in which you can see what the Directors are doing with their entitlement, see how much debt remains, and obtain an instant fix on the outlook for future profits.
-
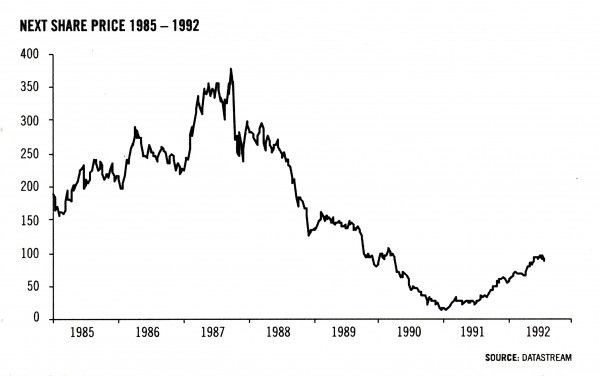
- Above all, you are looking for a company that under normal conditions is a substantial force in its chosen field. One of the best measures of this is sales in relation to market capitalisation. Anything over five times is relatively cheap. Next is a good example. In 1985, sales were £146m and the market capitalisation was £195m. A sales to market capitalisation ratio of 0.75. By December 1990, the market capitalisation had slumped to £24m, although sales were forecast at £800m. The ratio of sales to market capitalisation had become a very attractive 33 times. In the event, the shares subsequently rose from 6.5p in December 1990, to 95p in June 1992.
-
When should you sell a cyclical? With a growth share you might stay to enjoy a long ride, but with a cyclical your target price tends to be more limited. You certainly sell immediately when you see press or broker comment suggesting that the company in question is a growth share. You also sell when the multiple on the forecast profit in the second year of recovery has risen to 75% of the highest multiple the company has ever achieved. In essence, you sell on general recognition that the company has survived the downturn and is now enjoying far better trading conditions. Do not wait until there is an inevitable increase in competition, costs are beginning to rise again and demand is on the brink of flagging. You are trying to operate with a substantial safety margin, so sell well before the top of the cycle.
Although I dislike arithmetical formulae for selling, I would also suggest that for anything other than a very highly geared situation (in which you took a substantial risk with the hope of a disproportionate reward) you should at least consider selling when the shares have doubled.
Now comes the more difficult question of how to cut losses. Remember you were only buying when you thought the cycle was turning up. If this has not happened and the cycle is still going down or you are disappointed in some other major way, you must obviously re-appraise the situation. As with all my other systems of investment, if the story has changed substantially for the worse, sell immediately. Inexplicable falls in price have to be assessed on their merits and become more a question of judgement and feel. I have covered this particular problem more fully in Chapter Seventeen on Portfolio Management.
I rarely invest in cyclicals as the upside seems to me to be limited to a one-off gain. There are, however, large profits to be made if you are expert in both timing and selection.
This is well illustrated by Next, which is worth studying in more detail. Although it was easy to miss investing at the low of 6.5p, there were several further opportunities a little later on in the saga. Along with most of the retail sector, Next over-expanded during the latter part of the eighties, adding to its chain of shops at a phenomenal rate and branching out into credit finance and mail order.
By December 1988, the group warned of a coming ‘significant drop in profits’ and George Davies, previously a star in retailing, was asked to resign. By December 1990, investors were close to despair, with the company moving into heavy losses and with the prospect of two convertibles being near to redemption for £150m. By March 1991, Next had sold Grattan for £167m which, together with a few other minor sales, took the company out of debt. At that date, Next measured up to most of our criteria reasonably well:
-
- Next is a well-known company and would have been a very high profile failure had it been allowed to go under.
-
- Next had a well-known and influential stockbroker.
-
- Next is an excellent brand name.
-
- George Davies had been replaced by David Jones and Lord Wolfson of Sunningdale, both of whom are very able, financially-orientated men, who were determined to restore Next’s balance sheet to health.
-
- Major competitors such as Burton were also under considerable pressure.
-
- After the Grattan deal, debt was no longer a problem.
-
- Losses stopped and improving profit forecasts became the vogue with brokers.
-
- The intention was to restore the core business. Shops were being closed, stock controls improved, and product lines overhauled. Turnover was reduced in the process and margins improved dramatically.
-
- The sales to market capitalisation ratio was still high. Even after the disposal of Grattan, sales were forecast at £450m. At 30p, the ratio was more than four times the market capitalisation of £110m.
-
The most obvious time to buy Next was after the sale of Grattan, when the fear of bankruptcy was removed. You could have bought the shares then for between 25p and 30p for several months, and by June 1992 you would have at least trebled your money.
Turnarounds are not far removed from cyclicals and asset situations. An asset situation that has been neglected for years and allowed to deteriorate to the brink of failure becomes a turnaround. A badly-managed cyclical often becomes a turnaround at the bottom of the cycle. A badly-managed growth company that experiences an unexpected disaster might also become a candidate.
There is no precise definition of a turnaround. I use the expression to describe a company that I hope is going to come back almost from the dead. A company that has been bewitched, battered and bewildered to such an extent that its capacity to survive is in real doubt. The market often exaggerates hopes on the way up and exaggerates fears on the way down. Frequently, a fall in share price can be overdone as institutions and other shareholders rush for the exit.
Most of the criteria for selecting a turnaround are the same as those I have suggested for a cyclical. Many turnarounds at their lows are suffering from a downturn in their own circumstances, sometimes less to do with their basic business than changes in management and direction. Really bad management can bring any company to its knees, and really good management can quickly put things right. You do not want to waste valuable time and risk precious money waiting for new management to arrive on the scene. A major change in management (for the better you hope) is usually an excellent buying signal, although sometimes things have to get worse before they can get better.
For example, let us examine that well-known company English China Clays, which for some inexplicable reason diversified away from a wonderful core business and decided to change its attractive name to the horrible acronym – ECC. A new chief executive, Andrew Teare, who had successfully run Rugby Group for several years, took charge on 1 July 1990. The acquisition of Georgia Kaolin in the US had already been announced in May, and Teare decided to use this purchase to build up the core business and dispose of all the previous diversifications. In September 1991, the company announced its gradual withdrawal from the UK house building sector and a rationalisation programme in the core kaolin operation. Other changes included moving head office, introducing a wide-ranging management incentive scheme, selling ten businesses within eighteen months and cutting the workforce from 13,800 to 10,800. In February 1992, the company had a rights issue to redeem some fancy debt financing in the USA. A month later, the board announced pre-tax profits up more than 50% and proposed that the company’s name should be changed back to the much more popular English China Clays.
In July 1990, the shares were 414p, on a historic P/E of 9.2 and a prospective P/E of about 18. Towards the end of 1990, the shares were very weak at 275p as the company bore the brunt of worries about the recession in construction work. However, by June 1992 the shares reached 555p when the benefits of the reorganisation came through.
Another kind of turnaround can arise from unexpectedly horrific financial results or a disaster like the Union Carbide plant blowing up in Bhopal. I recommend against investing in turnarounds which arise from happenings that are impossible to quantify and may be a bottomless pit. The Bhopal incident has no doubt given rise to claims of unimaginable proportions from relatives of disaster victims. I am not sure about the present state of play, but I suspect that years may go by before the full financial effects will be known.
Similarly, if there is ever a case of a successful claim against a major tobacco company for damage to health of third parties from passive smoking (such as being in the same office as other people who are smoking and dying from cancer as a result) the effects would be immeasurable. With happenings like these, I suggest that you allow plenty of time for the dust to settle before you risk your money. Do not go bottom-fishing – you can drown that way.
As you can see from the examples of Next and English China Clays, there are very large gains to be made by identifying a promising cyclical or turnaround, especially when new management has taken charge. There is of course a risk, so you should never put more than 10% of your portfolio in any one situation of this kind. The safety criteria I have outlined should also help to protect you.
The time to sell a turnaround is delightfully obvious – when the company has turned around and is making good profits. Institutions are no longer ashamed to own the stock and are beginning to invest cautiously: the brokers’ consensus profits forecast is well up on last year and there are perhaps a few comments about the company becoming recognised as a growth stock. Do not be greedy – let the market have your shares. You may well have made at least 100% on your money and possibly much more.
12. Shells
I once compared a very large company with an elephant by making the comment that ‘Elephants don’t gallop’. The main reasons are obvious – to double the size of a very large company capitalised at say £10bn takes years of hard work. A small and obscure company finds doubling much easier, and a shell company, with a market capitalisation of a few million, has an even easier task. I have searched for an analogy for shells to contrast with my elephant ambling along most of the time and just occasionally charging. The best suggestion I can offer so far is a flea, which can jump over two hundred times its own height – equivalent to a man jumping over St. Paul’s Cathedral. Let us have a look at our flea in action and see how shells work and how you can benefit from the process.
A shell is a very small company that usually owns a small and nondescript business of little account and which, above all, has a stock market quotation. The idea of the incoming entrepreneur is simply to obtain a backdoor quotation for his own company, which usually has too short a record or some other shortcoming that precludes obtaining a stock market quotation by a more conventional route. Often, the previous management makes a quick exit shortly afterwards and the original business is sold off as it becomes less relevant to the main activity of the new group. The incoming entrepreneur then has effective board control of the business together with the quotation he was seeking. The shares often rise sharply in price in the hope that there will be plenty of activity. Using the high-flying shares, the company then makes some acquisitions. The share price goes up again in anticipation of more action, and the process is repeated. That is the shell game at its best. The private investor benefits by being in the shell in the first instance, or shortly afterwards, by participating in one of the early placings of stock or by buying in the market.
To find out about companies that are likely to be used as shells or have just started their career as a shell, I recommend to you two newsletters that specialise in shell operations –
The Penny Share Guide
and
Penny Share Focus
. Both are helpful publications and review each month the progress being made by most shells. They also feature potential shells together with a wide range of other very small companies, often called penny stocks. Their comments will keep you abreast of the main developments on the shell scene. Another possible source of information is the
Fleet Street Letter
, which often mentions shells in its Portfolio C section, but concentrates in the main upon medium-sized to larger companies.
Your broker may also know of some interesting shells. Ask for his views – he will be anxious to help you. Newspapers, especially the Sundays and the
Daily Mail
, frequently comment on shells. Michael Walters, who is Deputy City Editor of the
Daily Mail
, has written a comprehensive book,
How To Make A Killing From Penny Shares
, which gives valuable advice and outlines the pitfalls. If you intend to concentrate upon shells, you should read this.
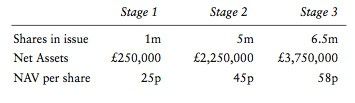
It is important to understand how an acquisitive shell can be such a good investment for early shareholders. Take the example of a property company (when they were all the rage) with one million shares in issue priced on the Unlisted Securities Market (USM) at 50p each, having a market capitalisation of £500,000. The net asset value might be only £250,000, and the 100% premium of £250,000 would be the hope factor – hope that the company will be used as a shell.
The incoming entrepreneur injects his own property business worth say £2m for 4 million shares. The result is a quoted property company with assets of £2.25m and 5 million shares in issue, so by strict arithmetic, if the share price remained at 50p the market capitalisation would by then be £2.5m. However, the accompanying publicity would probably boost the share price to say 100p, capitalising the company at £5m. This is a very small jump for our flea, as there are only one million shares from the original shell that form the market float, and many of these will be in the firm hands of believers and supporters. There might be only 200,000-300,000 shares that are available to the market, and these will usually be sold quickly at higher levels to new converts. The key to a successful shell operation is for there to be more demand for the shares than can be satisfied by the relatively limited supply. That is why very small companies make the best shells.
At this point, our shell makes a substantial acquisition with net assets of say £2.5m. The purchase consideration is satisfied by £1m in a deferred loan secured on the property, and the rest is funded by an issue of 1.5 million ordinary shares which are placed by the company’s brokers with friends, business associates and institutions. The extra 1.5 million shares that are being issued will add to the float, but this problem will be restricted as in the early stages many of the places will be friends and business associates who will hold the shares as a long-term investment.
The effect of all this is to increase net assets per share. There have been three distinct stages:
In the column for Stage 3 I have increased the net assets by £1.5m, which is the £2.5m of assets acquired less the £1m deferred loan. The sense of progress from the net asset growth from 25p to 58p per share will usually be accompanied by the feeling that the new £2.5m acquisition is very astute and that the property in question is really worth very much more, especially if planning permission can be obtained for an exciting new development.
I have given first the example of a property shell because the arithmetic with net assets is easier to follow than with earnings. In fact, earnings situations lend themselves to shell operations much more readily, as future earnings estimates are essentially hopes that may or may not be realised. Taking a similar example with an industrial company, shares would be issued on a high P/E ratio for profits valued on a lower multiple. Let us assume that the same initial shell company had £250,000 worth of assets which could be converted into cash yielding £25,000 per annum. The incoming entrepreneur reverses in his business for the same 4 million shares, but instead of his business having assets of £2m, there are profits of £300,000 per annum before tax. In anticipation of deals to come and hopes for the future of the underlying business, the shares again double to a pound. Then another business is purchased for the same £2.5m, but in this case the profits before tax are £400,000 per annum. Again the vendor agrees to £1m of deferred consideration, and the balance is satisfied by the issue of 1.5 million new shares of £1 each. Our three stages look like this:
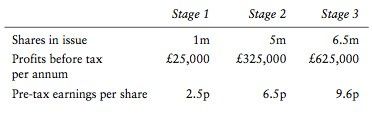
Tax has been ignored, as rates vary for companies at lower levels and I do not want to complicate the issue. I have deducted £100,000 per annum from profits to allow for interest on the deferred consideration. The £625,000 pre-tax profits per annum figure is the sum of £25,000 plus £300,000 plus £400,000 less £100,000. You will readily appreciate that as a result of the takeover of the shell and the first acquisition, the earnings per share on a pre-tax basis rose dramatically from 2.5p to 6.5p and finally to 9.6p. Shareholders’ pre-tax earnings per share almost quadrupled. In addition, as more acquisitions in the same industry are made, there will be scope for rationalisation and, in some cases, for radical improvement by re-organisation. Plenty of new hope – the raw material of a high multiple.
You should be aware that, with a highly acquisitive company, there is also the likelihood of profit enhancement by creative accounting. For example, by writing down the cost of acquisitions, capital can be transmuted into future revenue profit. Another simple ploy would be for the shell company to pay a little more for the business it is acquiring and arrange for the deferred loan to be interest-free. This would add £100,000 per annum to pre-tax profits. Very acquisitive companies frequently do this kind of thing, so bear in mind that often their profits are not all they seem to be at first sight. Not many people read the small print. Investing in shells is more of an art than a science. To decide whether a company is a shell or simply a very small business with a quotation is very much a matter of opinion. The key point is that whoever is reversing their business into the company invariably takes board control, and their underlying motive is to obtain a backdoor quotation. In some cases the original business may be retained and developed. To find a worthwhile asset inside a shell is a bonus for the incoming entrepreneur, rarely his reason for doing the deal.
One of the Oxford dictionary definitions of the word shell is:
‘Unimportant firm made the subject of a takeover bid because of its status on the Stock Exchange’.
Another more pertinent meaning is
‘outward show, mere semblance’
.
To give you a better idea of both the attractions and the dangers of shells in the last twenty years, let us look at four well-known examples and see how they have fared in the market.
You can invest in shell companies at four distinct stages of their development, when:
-
- They are waiting for a deal but there is nothing in sight.
- A deal is rumoured and speculation is beginning.
- A deal is announced and the company returns to the market.
- The new managers have been operating for a few months or even longer and are beginning to show their paces.
The first two stages are too nebulous and dangerous for most investors. You are quite likely to invest inadvertently in a genuine company in distress which will soon become insolvent. Alternatively, you might have a very long wait for new management to arrive and take control. Therefore, I recommend that you concentrate upon the last two methods so that, when you invest, you will know for certain that the company is being used as a shell. You will know the name and background of the incoming entrepreneur and have a firm idea of his objectives and the fundamentals of the company. A number of uncertainties will have been removed.
After the successful reversal of the new business into a shell company, the shares are invariably suspended for about six weeks. During this time a prospectus is prepared setting out details of the deal, which also often includes a placing of more shares for cash. When the shell returns to the market, the fundamentals tend to be ignored and the opening market price is usually related to the pre-suspension price. For example, if a company’s shares have an underlying value of 5p and are suspended at 8p, you might well hear that the shares “have a 10p look about them”. With a shell, fundamentals like assets and earnings per share are frequently of lesser importance. Much more attention is rightly focused upon the new man at the helm, his track record, his backers and what he is likely to achieve by acquisition, rationalisation and the occasional spectacular deal.
Another way for an entrepreneur to move into a shell is simply by invitation. A substantial shareholder with effective board control might invite a well-known personality to become chief executive. Shortly afterwards, there would be a rights issue and placing to give the new man a chance to acquire a significant shareholding. He would also be rewarded and incentivised with share options.
To give you the full flavour of the different methods of acquiring control of a shell, let me show you details of three recent shell operations:
1. Clarke Foods
An American businessman, Henry Clarke, together with his family, acquired effective control of Yelverton Investments – a small investment company which he turned into a cash shell. In 1991, he acquired the ice cream businesses of Hillsdown Holdings and Lyons Maid from Allied Lyons. Although trading profits are still awaited, overnight the company became a leading UK manufacturer and distributor of quality ice cream. Before the venture into ice cream was announced, the shares were 39p; by June 1992, they had risen to about 150p.
2. Maddox Group
In February 1992, Hugo Biermann and Julian Askin alighted upon Pathfinders and injected two telephone cable businesses for cash and shares, acquiring in the process a 26% stake in the company, which was re-named Maddox Group. The two men had previously turned Thomson T-line from a £900,000 company into a group they sold to Ladbroke for over £180m. Shares in Pathfinders/Maddox rose after the announcement to 12.5p, though they have slipped back to 8p in June 1992 as the market waits for another deal.
3. Wharfedale
In December 1991, Wharfedale announced that a new management team was moving in headed by Sir Gordon Brunton, who had sixteen years as Chief Executive of the International Thomson Organisation, during which time annual operating profits increased from next to nothing to over $500m. Other members of the team were Pieter Totte and Gordon Owen, who was Group Managing Director of Cable & Wireless.
At the same time, the company indicated that there would be a £2.25m placing of shares at 12.5p to repay some of Wharfedale’s excessive debt. At the annual meeting in March 1992, the management outlined their plans for reorganising the business and gave details of their progress on cost-cutting and rationalisation. The market price has been as high as 24p but by June 1992 had dropped back to 16p to await further developments.
As you can see, all three of these companies are priced on expectations of things to come. In contrast, a new issue of a straightforward business might be valued strictly on fundamentals like the growth rate, current earnings per share, the forecast, the P/E ratio, asset backing, dividend yield and liquidity. You will readily appreciate that giving you guidelines for judging the value of a shell and selecting a suitable one to add to your portfolio is almost impossible. I say almost because I am going to try:
1. First, second and third is the provenance of the incoming management. Look for quality. Look for a heavyweight board joining a lightweight company. Look for previous positive achievement upon which to build your future hopes. Full details of the incoming management should be contained in the prospectus, and there will usually be plenty of press and newsletter comment about any well-known personality.
Your new chief executive may not have run a company of his own before – he could have been working for another well-known group for many years. An excellent stable is one of the best auguries.
Before Greg Hutchings joined F.H. Tomkins he worked as head of UK corporate development at Hanson Trust. When he first became Chief Executive of Tomkins the shares were 12p with a capitalisation of £6m. In June 1992, the shares stand at just under 500p with a market capitalisation for the company of £1.4bn. After making allowance for rights and scrip issues, Tomkins’ shareholders have enjoyed an enormous capital gain so far, and Greg is still going strong.
Bernard Taylor was chief executive of Glaxo before he joined Medeva. The shares were 80p at the time and in June 1992 less than three years later stood at 220p, a gain of 175%. Hanson and Glaxo are obviously top class stables, but there are other similar shell situations in which you can tell that the odds are very much in your favour.
I have dwelt at length upon the desirability of top quality management for a shell because that criterion is far more important than all of the others. If the incoming entrepreneur is absolutely first class, the rest of the criteria should be given much less weight.
2. As an important adjunct to my first criterion, I like to make sure that the new management is buying a substantial stake in the company. This is almost always the case, but keep a close eye on Directors’ buying and selling and regard substantial selling as a clear signal to do the same, almost irrespective of any accompanying explanations.
3. As the future progress of the shell will depend to a large extent upon share placings, the calibre of the company’s stockbroker, merchant banker and investing institutions is a material consideration. A first class incoming executive team will usually attract substantial support.
4. The record of the business being reversed into the shell has to be one of increasing profits and earnings per share, unless of course it is a property company, when different considerations apply. If the new Chief Executive is relatively unknown, the record of the business he has been managing is often the only way for you to judge past achievements.
5. Make sure that, following the merger, the shell has resultant earnings per share sufficient to provide a reasonable starting base for the company. You cannot use the PEG factor to measure the price you are paying. You have to take a broader view with shells, but at your entry price try to avoid paying too much for hope.
It is the absolute amount of the premium over real value that should worry you, not the percentage. This is of course another argument in favour of small shells. For example, if a shell company has profits after tax of £200,000 and the multiple for that type of business would normally be 15, the company would be capitalised at £3m. However, with the hope factor for a really good new Chief Executive, the multiple might be as high as 25, capitalising the company at £5m. The extra £2m is a premium of 66.7%, but really you should not focus on the percentage but on the £2m which is the ‘hot air gap’ that has to be replaced with value. With a high P/E ratio and good backing it would not be too difficult. Now let us contrast this with a company capitalised at £50m with true worth of only £30m. Closing a hot air gap of £20m, with the same percentage premium, would be a far more onerous task for the incoming management, especially as they would also have to worry about a much larger market float of shares.
6. From the above comparison, you will readily appreciate that a little shell, capitalised at £1m and with an underlying business worth £500,000, might be a gem. A 100% premium, but a hot air gap of only £500,000. I very much prefer small companies. I like a shell with a starting market capitalisation of under £10m. The smaller the better – remember our flea.
It is very instructive to note the history of WassaIl. Christopher Miller and Philip Turner, who had been key executives of Hanson, joined the board of Wassall plc together with a business associate David Roper from Dillon Read. There was an immediate rights issue, and institutions came in heavily, together with Hanson, which bought 20%, and the three executives, who each purchased a £1m stake. The market capitalisation at the rights issue price of 125p was over £18m.
Most of the ingredients for a successful shell were in place: above all, three very able entrepreneurs with superb track records and wonderful backing. The shares soared and several acquisitions were made, most of which were very successfully reorganised and rationalised afterwards. The share price of 180p (after a one for two scrip issue) in June 1992 is now well backed by earnings and compares with 125p for the rights in September 1988. A gain of 116% in just under four years – very good for a conventional industrial company but modest for a successful shell. The management, which is excellent (and will, I am sure, do very well in the future), did not put a foot wrong except for their very first one – starting with much too large a vehicle, at too heavy a price for a shell. Take my advice and avoid big shells. Stick to fleas – elephants don’t gallop.
7. I much prefer low-priced shares. Companies often lose their shell-like quality as their share prices rise over £1. We all know that the price of a share makes no difference really and that owning four shares with a nominal value of 25p is the same as owning one share at £1. Nevertheless, when a share becomes ‘heavier’ and the price rises over £1, the press and brokers are more likely to have a serious look at the company and analyse the fundamentals. Shells thrive on future hope and a hint of mystery. Shells are about travelling, not arriving, so from the investment point of view arrival should be postponed as long as possible. My favourite price for a shell is between 5p and 10p. My second choice would be under 15p, then 20p and then 25p. The smaller and more like a flea the better.
A problem with shells priced at very low levels is the spread in the market, and that is one reason for not going below 5p. A 3p share, for example, would, probably, be priced at 2.75p-3.25p, giving the market makers a colossal turn of 0.5p – equivalent to 16.7%. In spite of this drawback, I prefer low-priced shares for a shell. An 8p share could easily rise to 10p in a few hours and 12p by the following day – that would be an increase of 50%. Very few shares of 80p could rise to 120p in the same 48 hours and certainly an £8 share would find it very hard going to reach £12 in six months, never mind a couple of days. For a shell, any price from 5p to 50p is highly attractive, as the first major psychological barrier of £1 is still some distance away. The moment of truth can sometimes be postponed, even with the shares trading at much higher levels of £2 to £3, but as the share price becomes heavier, so the share begins to lose one of the essential characteristics of a shell. At £3, they are in grave danger of someone deciding that they are a serious company and should be valued accordingly.
8. Avoid any shell unless it has a full listing or is on the USM. Bulletin Board quotations and shares that trade by matched bargains are not good enough for your purposes. Institutions avoid them like the plague and it is almost impossible to deal either way if you are in a hurry.
9. My last criterion is the liquidity of the company. Shells are obviously a much riskier kind of investment than leading companies. They find it more difficult to borrow in recessionary times – they are more likely to run out of money. Make sure that yours at least start off with a net cash balance or containable borrowings.
The high risk of investment in shells can be reduced by good portfolio management. Do not be fooled by remarks like ‘5p is only option money’ and ‘all you can lose is 5p.’ If you have invested 5p and you lose 5p, you have lost all your money on that investment. It can happen very easily and must be expected more frequently with shells than with more established companies.
The first rule of shell portfolio management is to spread your investments over at least ten shares, preferably in equal amounts. A few more if you like, but never less than ten.
The second rule is to cut losses when shares drop by 40% from your cost. This may seem to be a very high limit but the market maker’s turn can account for 10%-15% and shells are very narrow market, volatile stocks. You do not want to be taken out of your carefully selected investments by a minor and temporary blip. When your 40% limit is reached, simply cut your loss. The new managing director might have dropped dead or moved on to another company, or there could be some other major adverse development. Needless to say, when you know for certain that the story has changed for the worse, you should always sell immediately.
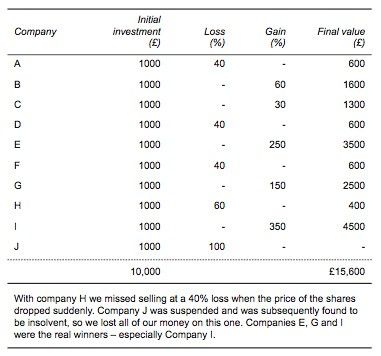
The third and most difficult rule is to run profits. Before we decide how far to run them, let us look at the arithmetic of the performance of a notional shell portfolio containing ten shares over a period of one year:
With ten well-selected shares I would normally expect three big winners, four moderate winners and three losers. To be conservative, I assumed that we had five losers, one of which cost us more than might have been expected. On the plus side, I assumed that we had five winners, three of which had an average gain of 250%. We only enjoyed these large gains because we ran the profits. Most of the losses were contained because we cut them before they became more serious.
Our average gain over the year was 56% – a very worthwhile performance. Even if we had lost everything on the five losing shares, the average gain would still have been a satisfactory 34%. The credit for these above average gains must be attributed to the policy of running profits. There is no other explanation. Imagine the horrific performance if we had followed the much more natural policy of clinging to losses in the hope that the shares would recover, and snatching profits, nervously and prematurely, because we were frightened that they would disappear. We would almost certainly have lost money.
There is no easy guide for when to take a profit. Frequently, I add to my profit-makers when they have done well for me and are on all time highs, but you might find this very difficult psychologically. My simple suggestion to you is to allow your profits to run for a year, unless of course the story changes. The most important consideration is to let your little flea jump as high as it can. Give your flea a year to show how well it can perform. You will be very happily surprised sometimes.
After the year is up, check the fundamentals and assess each share for what it is really worth. What are the press, brokers and investment newsletters saying about the shares? Would you buy the shares now? What are the prospective earnings, the P/E ratio and the asset backing? Is there a large float of shares, and have any of the directors been selling? These are the kind of questions to ask yourself. If it has been a successful investment, the company is almost certainly no longer a shell, and should be reviewed like any other investment, strictly on its merits, in comparison with other shares in the same sector of the market.
Bear in mind that there is an extra advantage of running profits and cutting losses – you will keep your tax bill at a minimum. In a way, the Government is giving you an interest-free loan of the tax that will be due when your profits are realised. With shell investment, in particular, this can be a factor to take into account, but tax considerations should never over-ride a strong feeling that shares should be sold.
When in doubt, you can always sell half your holding in a big profitmaker. I do not like being half right and half wrong, but some people find this makes it easier to have the courage to run the residual profit. What are they so worried about anyway? Whether or not to take a very large profit is a great luxury to be enjoyed, so never agonise too much over the decision. Investing in fleas should be fun.
13. Asset Situations And Value Investing
Investors who concentrate upon asset situations are not so interested in immediate earnings. They reason that if a company holds the right kind of assets, earnings will flow from them eventually. If the existing management fails to deliver, new management or a predator will arrive on the scene to put the assets to work.
Determining the real asset value of a company is not an easy task, especially nowadays. At one time, you could rely upon substantial assets like major properties being understated in the balance sheet. In a very recessionary climate the reverse is often the case. In June 1992, Speyhawk has just announced a write-down of its assets of a massive £205m. The shares were 140p at their 1991 peak and were 2.5p after the news. Before the collapse, the shares were already trading at an 87% discount to their last published net asset value. Investors were obviously aware that the previous set of accounts were not to be relied upon.
How could this kind of over-valuation have occurred? There are a number of ways. Individual properties might have been valued based on the rents being received by other landlords of comparable buildings. However, in some cases there might have been substantial inducements to incoming tenants, such as a couple of years rent-free occupation and payment of the tenants’ costs for fitting out offices. Meanwhile, the disadvantages of high gearing were becoming more apparent as property values tumbled during the year.
Another asset that is difficult to value is plant and machinery. On a going concern basis the valuation might be substantial, but if a factory is closed down and machinery has to be sold, the proceeds can be derisory, especially in a difficult trading climate. Even Warren Buffett had a few problems on this score, when he decided to close the New Bedford textiles plant that was one of his earliest acquisitions. The management was hoping for a good figure for the sale of the machinery, which had a book value of $866,000. They were due for a surprise – at a public auction the proceeds were only $163,000.
Brand names are difficult if not impossible to value. In some balance sheets they are included almost for nothing but in others they are valued at hundreds of millions of pounds. Most companies do not value brands in their balance sheets. The few that do usually have a specific reason – RHM, for example, was prompted by the threat of being taken over.
The recommended treatment of goodwill and intangibles on acquisition is that they be written off against reserves in the first year. However, accounting guidelines are due on this difficult subject shortly, and meanwhile, from the investor’s viewpoint, the key is to be certain that the brand names you are examining are very strong in their own right and will continue to provide an independent earnings stream for the company in the future.
Goodwill is another thorny issue. I recommend writing it off when you calculate the net asset value of a company in which you are interested. At the very least your valuations will be consistent and understated.
There is a new accounting proposal, which attempts to make the balance sheet show current or market values rather than the present mix of historic and ad hoc re-valuations. At the moment, the rule for fixed assets, such as properties, is that they should not be included at values in excess of market price. However, we have already seen that valuers interpret marketprice in many different ways.
When investing in an asset situation, look for net assets to be at least 50% more than the present share price. Do your best to double-check that the net assets are accurately stated, but remember this is not an easy task.
There are also a number of further protective criteria, which have to be satisfied:
-
- Total debt must not be more than 50% of net asset value.
- There must be moderate earnings. Do not buy into substantial loss makers, however strong the asset position.
- The basic business of the company must be reasonably attractive and there must be obvious scope for recovery. Avoid shipbuilders for example.
A great additional inducement is to see executive directors buying some shares. Not a mandatory criterion, but an excellent pointer.
Companies of particular attraction to predators are those that have several disparate parts. The ideal is one with a substantial loss-maker that almost cancels out the other profit making activities of the group. A predator would not take long to find a buyer for the loss-maker, even if he had to almost give away the offending subsidiary. The resultant swing in profitability is often spectacular.
I am not over-keen on asset situations and prefer to concentrate upon growth stocks, shells and turnarounds. At Slater Walker, I could usually arrange for an asset situation to be activated. Nowadays, like other investors, I have a long and boring wait, whereas growth stocks and turnarounds usually give much more immediate satisfaction.
Ben Graham, who wrote
The Intelligent Investor
, is the American archdeacon of ‘Value Investing’, which is not to be confused with investing in asset situations. Graham’s most famous investment formula is to buy shares at a price that represented not more than two-thirds of a company’s net current assets
deducting all prior charges and giving no credit for any of the fixed assets of the company
such as property, plant and machinery, brand names and goodwill. In other words, buying the assets that are convertible into cash at a discount, with the rest of the business thrown in for nothing! Graham recommended selling when the share price advanced to a price equal to the net current assets less all prior charges. When the formula worked the gain would therefore be 50%. Between 1946 and 1976 Graham found that this method produced a compound annual rate of return in excess of 19%.
Many people believe that the term ‘Value Investing’ only refers to buying assets at a discount. In fact, value investing is broader than that – the essential concept is to look for values with a significant margin of safety relative to share prices.
Graham worked on several different approaches to investment, but buying value in one form or another was always his underlying principle. Before we examine his other ideas, it is important for you to realise that following the other systems I have outlined is also a form of value investing.
When you buy shares in a dynamic growth company on a low P/E ratio, with a consequently low PEG factor, you are buying growth prospects at a discount. You are obtaining better value for money than by buying the market as a whole. Similarly, when you invest in a turnaround just as the action starts or in a cyclical before the cycle turns up, you are buying into a company at a substantial discount to its full potential.
The market price of a share and the underlying value of that share are two very distinct animals. The value is always subjective – what are the assets worth, always open to many different interpretations – what are the future earnings going to be, again very much a matter of opinion. That is why Graham concentrated his first system around net current assets, which could be converted into cash, the one asset that has an indisputable value. Graham believed that the market price would fluctuate without rhyme or reason around the real value, often for a considerable period of time, but in the end value would win through. In the long run share prices move in sympathy with earnings per share, dividends, cash flow and net assets. This is the essential back-cloth for understanding Graham’s other approaches to investment.
Graham’s second most well-known system was to buy shares which had an earnings yield (the reciprocal of the P/E ratio – for example a share on a P/E of 8 has an earnings yield of 12.5%) of not less than double the yield on a triple A bond. If the yield on such a bond was 10% that would mean buying shares on a multiple of only 5. In addition, Graham used an extra protective caveat insisting that the total debt of the company should not exceed its tangible net worth. Analysing the previous thirty years, Graham concluded that this method would also have produced a compound annual rate of return of 19% – far more than the market as a whole over the same period.
Graham’s third approach was to buy shares with a dividend yield of not less than two-thirds of the triple A bond yield. Again he insisted that the companies in question should not owe more than they were worth. The compound annual rate of return was almost the same at 18.5%.
An important feature of Graham’s method was that every qualifying stock had to be bought. Personal likes and dislikes were not allowed. In all three cases, Graham sold stocks either if they had risen 50% or a two year period had elapsed, whichever came first. He also sold if dividends were passed and, with earnings-based shares, if earnings declined to such an extent that the current market price was 50% higher than the hypothetical purchase price.
Graham was a most systematic and ingenious fellow who liked to buy assets at a discount and shares with a low P/E ratio. He then put a protective net under his selections with the safety criterion of limiting debt to tangible net worth. In my system for buying dynamic growth shares I am prepared to buy on a higher P/E ratio than Graham, but I link this with the estimated growth rate and find my value from a low PEG factor. I then erect a far more comprehensive safety net with my other criteria.
Warren Buffett was a disciple of Ben Graham, but modified his approach. It is important to understand that Graham gives no credit in his figures for intangibles like goodwill and brand names. In contrast, Buffett looks for shares that offer good general value and have a strong business franchise, preferably backed by very strong brand names. Essentially, Buffett is seeking a growth share to have and to hold. Graham was looking for immediate and obvious value to be sold as soon as the shares had risen by 50%. Buffett prefers to wait for a decade or so for a gain of a few thousand per cent.
The difficulty of operating Ben Graham’s most famous system (the market price of a share being no more than two-thirds of net current assets, after deducting all prior charges and bringing in nothing for other assets) is that for long stretches of time very few, if any, shares measure up to that incredibly high standard. If Graham was alive today, he might argue that you should simply withdraw from the market for a few years until conditions arise which offer you the value for money that you are seeking. Graham may be right, but my problem is that I would get so bored waiting.
14. Leading Shares
Major companies are no different from smaller companies. You will not find any shells amongst them, but you will find plenty of growth stocks, cyclicals, turnarounds and asset situations. One advantage of dealing in leading stocks is that there is undoubtedly a greater degree of safety. Large stocks are more established, more a part of the fabric of society, and therefore less likely to fail from lack of funds or unexpected disasters. Furthermore, the market in the shares of larger companies is far more liquid. With a small company, you will quite often find that the market has suddenly contracted to only 1000 shares with a very wide spread. With leading shares, you should always be able to deal when you come to take your profits or cut your losses.
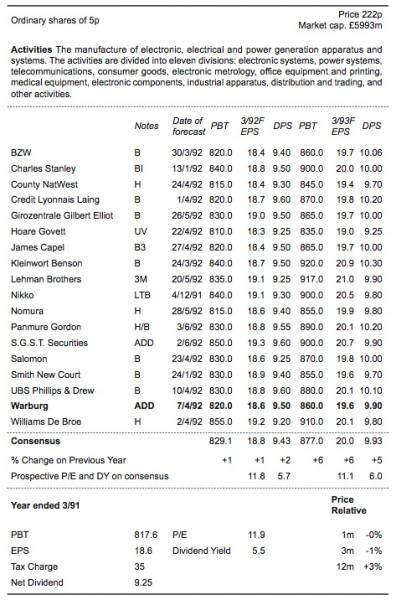
A disadvantage of leading shares is that they are usually more expensive as they have invariably been heavily researched. Overleaf, you will see two extracts from the June 1992
Estimate Directory
– one for MTL Instruments and the other for GEC. Eighteen brokers have researched and written about GEC against only two who have bothered with MTL. The extensive coverage of GEC should give you a more reliable consensus forecast, but the over-exposure, coupled with the attractions of better marketability, tends to result in higher PEGs for blue chips.
A further disadvantage of leading shares is, of course, that elephants don’t gallop, although they do charge occasionally. If you intend to invest in them, you should be looking for one that is about to break away from the herd. You might well ask how you can tell. The answer is simple – apply exactly the same principles to investing in leading companies as you would to small companies. In PEG terms you will have to stretch your limit a little as you will find very few with a PEG of under 0.66, or for that matter 0.75. To keep the formula simple, I suggest a limit of one – the prospective multiple should not be more than the estimated growth rate.
The MTL Instruments Group PLC
The General Electric Company PLC
As you know, I prefer growth shares with market capitalisations of under £100m. Most of the shares in the FT-A 500 Share Index are well over this figure. For the purposes of illustrating my approach to leading shares, I am, however, going to concentrate for the moment upon the FT-SE 100 Index in June 1992. The formidable list shown overleaf needs to be broken down and analysed in detail. Let us first of all identify the super-growth shares – not from their reputation, but from their actual performance in recent years. A Datastream analysis can easily do this for us by applying a few selective criteria:
-
- 15% compound growth in EPS over the last five years.
- At least four years of positive growth.
- EPS up at least 15% last year.
- Dividends paid in each year and not cut at any time during the last five years.
Out of the 100 shares in the Index, there were only seven survivors – Rentokil, Rothmans, Sainsbury, Tate & Lyle, Tesco, Inchcape and Wellcome.
A few well-known growth shares are missing because the 15% EPS growth target is too harsh for the last recessionary year. If we drop the limit to 12% growth for that year only, one more share, Glaxo, scrapes through. If the limit for compound growth over the last five years is reduced to 12% per annum then four more shares make the grade – Argyll Group, Associated British Foods, British Telecom and Scottish & Newcastle. Reuters, with compound growth of 23%, and Guinness with 19.5%, were unlucky to just fail at the last post, with 1991 EPS growth of 9% and 11% respectively. We will admit them, together with Vodafone and SmithKline Beecham, which had strong growth but short records.
Many well-known names failed to measure up to our criteria. For example, Marks and Spencer and Tomkins, because last year earnings were up only fractionally, and Hanson, as last year’s earnings were down a little.
FT-SE 100 Index on 18th June 1992
|
Company
|
Latest Year End
|
Growth in EPS1987
|
Growth in EPS1988
|
Growth in EPS1989
|
Growth in EPS1990
|
Growth in EPS1991
|
Growth in EPS1992
|
|
ABBEY NATIONAL
|
12/91
|
-
|
-
|
-
|
+16.7%
|
+9.3%
|
-
|
|
ALLIED-LYONS
|
2/92
|
+34
|
+17
|
+14
|
+4
|
+8
|
-
|
|
ANGLICAN WATER
|
3/91
|
-
|
-
|
-
|
-
|
+7
|
-
|
|
ARGYLL GROUP
|
3/92
|
+7
|
-1
|
+17
|
+25
|
+27
|
-
|
|
ARJO WIGGINS APL
|
12/91
|
-
|
-
|
-
|
-
|
-25
|
-
|
|
ASSD.BRIT.FOODS
|
9/91
|
+20
|
+2
|
+14
|
+21
|
+13
|
-
|
|
BAA
|
3/92
|
-
|
-
|
+30
|
+36
|
+21
|
-
|
|
BANK OF SCOTLAND
|
2/92
|
+21
|
+15
|
+29
|
+13
|
-44
|
-23
|
|
BARCLAYS
|
12/91
|
-71
|
+296
|
-54
|
-13
|
-39
|
-
|
|
BASS
|
9/91
|
+22
|
+12
|
+22
|
+9
|
-1
|
-
|
|
BAT INDS.
|
12/91
|
+1
|
+20
|
+21
|
-64
|
+34
|
-
|
|
BET
|
3/92
|
+19
|
+13
|
+16
|
+11
|
-35
|
-
|
|
BLUE CIRCLE IND.
|
12/91
|
+22
|
+19
|
+5
|
-23
|
-36
|
-
|
|
BOC GROUP
|
9/91
|
+39
|
+22
|
+11
|
+4
|
-15
|
-
|
|
BOOTS
|
3/92
|
+9
|
+7
|
+18
|
+20
|
-3
|
-
|
|
BOWATER
|
12/91
|
+34
|
+26
|
+26
|
-8
|
-2
|
-
|
|
BRIT. AEROSPACE
|
12/91
|
-100
|
-
|
-9
|
+63
|
-56
|
-
|
|
BRIT. PETROLEUM
|
12/91
|
+139
|
-20
|
+60
|
-1
|
-76
|
-
|
|
BRITISH AIRWAYS
|
3/91
|
|
+7
|
+22
|
+42
|
-43
|
-
|
|
BRITISH GAS
|
12/91
|
-
|
-3
|
+8
|
-4
|
+34
|
-
|
|
BRITISH STEEL
|
3/92
|
-
|
-
|
-
|
+1
|
-47
|
-
|
|
BRITISH TELECOM
|
3/92
|
+25
|
+10
|
+10
|
+10
|
+13
|
-
|
|
BTR
|
12/91
|
+11
|
+23
|
+27
|
-11
|
-10
|
-
|
|
CABLE & WIRELESS
|
3/92
|
+9
|
-5
|
+35
|
+20
|
-3
|
-
|
|
CADBURY SCHWEPPES
|
12/91
|
+30
|
+23
|
+8
|
+2
|
+7
|
-
|
|
CARLTON COMMS.
|
9/91
|
+35
|
+49
|
+34
|
-16
|
-33
|
-
|
|
COATS VIYELLA
|
12/91
|
+26
|
-41
|
-7
|
-20
|
-6
|
-
|
|
COMMERCIAL UNION
|
12/91
|
+7
|
+3
|
+9
|
-91
|
-100
|
-
|
|
COURTALDS
|
3/92
|
+28
|
+6
|
-12
|
+16
|
+6
|
-
|
|
ENG. CHINA CLAYS
|
12/91
|
+22
|
+27
|
+5
|
-46
|
+24
|
-
|
|
ENTERPRISE OIL
|
12/91
|
+74
|
+5
|
+61
|
+14
|
-19
|
-
|
|
FISONS
|
12/91
|
+14
|
+21
|
+22
|
+18
|
-21
|
-
|
|
FORTE
|
1/92
|
+22
|
+16
|
-
|
-
|
+3
|
-
|
|
GENERAL ACCIDENT
|
12/91
|
+7
|
+25
|
-43
|
-100
|
-
|
-
|
|
GENERAL ELEC.
|
3/91
|
+5
|
+9
|
+14
|
+5
|
-7
|
-
|
|
GLAXO HDG.
|
6/91
|
+42
|
+15
|
+14
|
+21
|
+12
|
-
|
|
GRANADA GROUP
|
9/91
|
+21
|
+2
|
+23
|
-28
|
-47
|
-
|
|
GRAND MET.
|
9/91
|
+18
|
+24
|
+15
|
+16
|
+7
|
-
|
|
GT.UNVL.STORES
|
3/91
|
+24
|
+11
|
+4
|
+5
|
+4
|
-
|
|
GUARDIAN RYL.EX.
|
12/91
|
+6
|
+44
|
-41
|
-100
|
-
|
-
|
|
GUINNESS
|
12/91
|
+6
|
+25
|
+33
|
+24
|
+11
|
-
|
|
HANSON
|
9/91
|
+34
|
+11
|
+18
|
-2
|
-11
|
-
|
|
HILLSDOWN HDG.
|
12/91
|
+38
|
+22
|
+17
|
-19
|
-24
|
-
|
|
IMP.CHM.INDS.
|
12/91
|
+24
|
+13
|
-1
|
-33
|
-16
|
-
|
|
INCHCAPE
|
12/91
|
+48
|
+31
|
+6
|
-15
|
+21
|
-
|
|
KINGFISHER
|
1/92
|
+25
|
+9
|
+17
|
+11
|
+1
|
+0
|
|
LADBROKE GROUP
|
12/91
|
+28
|
+34
|
+24
|
+14
|
-40
|
-
|
|
LAND SECURITIES
|
3/92
|
+14
|
+11
|
+10
|
+16
|
+22
|
-
|
|
LASMO
|
12/90
|
-
|
-42
|
+176
|
+35
|
-
|
-
|
|
LEGAL & GENERAL
|
12/91
|
+6
|
+86
|
+3
|
-43
|
-44
|
-
|
FT-SE 100 Index continued
|
Company
|
Latest Year End
|
Growth in EPS1987
|
Growth in EPS1988
|
Growth in EPS1989
|
Growth in EPS1990
|
Growth in EPS1991
|
Growth in EPS1992
|
|
LLOYDS BANK
|
12/91
|
-100
|
-
|
-100
|
-
|
+5
|
-
|
|
MARKS & SPENCER
|
3/92
|
+22
|
+19
|
+7
|
+12
|
+4
|
-
|
|
MB-CARADON
|
12/91
|
+30
|
+16
|
+12
|
-25
|
-4
|
-
|
|
NAT.WSTM.BANK
|
12/91
|
-39
|
+116
|
-71
|
-25
|
-41
|
-
|
|
NATIONAL POWER
|
3/92
|
-
|
-
|
-
|
-
|
-
|
-
|
|
NFC
|
9/91
|
-
|
-
|
-
|
+4
|
+7
|
-
|
|
NORTH WEST WATER
|
3/92
|
-
|
-
|
-
|
-
|
+207
|
-
|
|
NORTHERN FOODS
|
3/92
|
+13
|
+10
|
+10
|
+7
|
+16
|
-
|
|
PEARSON
|
12/91
|
+25
|
+7
|
+25
|
-13
|
-24
|
-
|
|
PEN.&ORNTL.DFD
|
12/91
|
+11
|
+21
|
+21
|
-35
|
-22
|
-
|
|
PILKINGTON
|
3/92
|
+288
|
+7
|
+2
|
-7
|
-61
|
-
|
|
POWERGEN
|
3/92
|
-
|
-
|
-
|
-
|
-
|
-
|
|
PRUDENTIAL CORP.
|
12/91
|
+35
|
+31
|
+19
|
-53
|
+0
|
-
|
|
RANK ORG.
|
10/91
|
+25
|
+28
|
+2
|
-4
|
-41
|
-
|
|
RECKITT & COLMAN
|
12/91
|
+20
|
+23
|
+10
|
+12
|
+1
|
-
|
|
REDLAND
|
12/91
|
+29
|
+20
|
+38
|
-12
|
-41
|
-
|
|
REED INTL.
|
3/92
|
+18
|
+15
|
+1
|
+9
|
-16
|
-
|
|
RENTOKIL GROUP
|
12/91
|
+24
|
+38
|
+24
|
+21
|
+27
|
-
|
|
REUTERS HOLDINGS
|
12/91
|
+34
|
+23
|
+36
|
+14
|
+9
|
-
|
|
RMC GROUP
|
12/91
|
+38
|
+39
|
+17
|
-18
|
-36
|
-
|
|
ROLLS-ROYCE
|
12/91
|
-
|
+20
|
-0
|
-20
|
-51
|
-
|
|
ROTHMANS INTL.'B
|
3/92
|
+30
|
+16
|
+19
|
+23
|
+22
|
-
|
|
RYL.BK.OF SCTL.
|
9/91
|
-17
|
+132
|
-31
|
+5
|
-71
|
-
|
|
ROYAL IN.HDG.
|
12/91
|
-33
|
-15
|
-40
|
-100
|
-
|
-
|
|
RTZ CORP
|
12/91
|
-
|
-
|
+18
|
-19
|
-25
|
-
|
|
SAINSBURY J
|
3/92
|
+21
|
+23
|
+17
|
+24
|
+20
|
-
|
|
SCOT.& NEWCASTLE
|
4/91
|
+11
|
+11
|
+14
|
+20
|
+17
|
-
|
|
SCOTTISH POWER
|
3/92
|
-
|
-
|
-
|
-
|
-
|
-
|
|
SEARS
|
1/92
|
+12
|
+9
|
+12
|
-18
|
-27
|
-
|
|
SEVERN TRENT
|
3/91
|
-
|
-
|
-
|
-
|
+2
|
-
|
|
SHELL TRANSPORT
|
12/91
|
+13
|
+3
|
+46
|
-7
|
-43
|
-
|
|
SIEBE
|
3/91
|
+13
|
+36
|
+16
|
+15
|
-19
|
-
|
|
SMITH & NEPHEW
|
12/91
|
+14
|
+11
|
+11
|
-10
|
-7
|
-
|
|
SMITH,WH GP.'A'
|
5/91
|
+20
|
+18
|
+13
|
+10
|
-2
|
-
|
|
SMITHKLINE BHM.A
|
12/91
|
-
|
-
|
-
|
+14
|
+21
|
-
|
|
SUN ALL.GP.
|
12/91
|
-
|
-
|
-15
|
-100
|
-
|
-
|
|
TATE & LYLE
|
9/91
|
+35
|
+23
|
+29
|
+11
|
+16
|
-
|
|
TESCO
|
2/92
|
+40
|
+19
|
+13
|
+21
|
+27
|
+14
|
|
THAMES WATER
|
3/91
|
-
|
-
|
-
|
-
|
+24
|
-
|
|
THORN EMI
|
3/92
|
+50
|
+40
|
+17
|
+11
|
-19
|
-
|
|
TOMKINS
|
4/91
|
+71
|
+42
|
+35
|
+21
|
+0
|
-
|
|
TSB GROUP
|
10/91
|
+62
|
+45
|
+13
|
-34
|
-100
|
-
|
|
UNILEVER
|
12/91
|
+15
|
+3
|
+30
|
+8
|
+7
|
-
|
|
UNITED BISCUITS
|
12/91
|
+14
|
+15
|
+5
|
+2
|
+5
|
-
|
|
VODAFONE GP.
|
3/92
|
-
|
-
|
-
|
+91
|
+42
|
-
|
|
WELLCOME
|
8/91
|
+33
|
+38
|
+29
|
+18
|
+25
|
-
|
|
WHITBREAD'A'
|
2/92
|
+9
|
+14
|
+13
|
+18
|
+11
|
-
|
|
WILLIAMS HDG.
|
12/91
|
+31
|
+32
|
+10
|
-24
|
+1
|
-
|
|
WILLIS CORROON
|
12/91
|
-26
|
-37
|
+33
|
+17
|
-18
|
-
|
Our final list is only sixteen shares – about one in every six from the FT-SE 100 Index. Remember Chapter Seven on Competitive Advantage and notice the common characteristics of the sixteen shares. Five are in food retailing and manufacture, two are brewers and distillers and three are drug businesses with well-patented products. Rothmans has excellent international brand names and Rentokil has a very strong business franchise.
We will use the June 1992
Estimate Directory
prices and future forecasts to see how the prospective PEGs of these fine companies measure up to our increased limit of one:
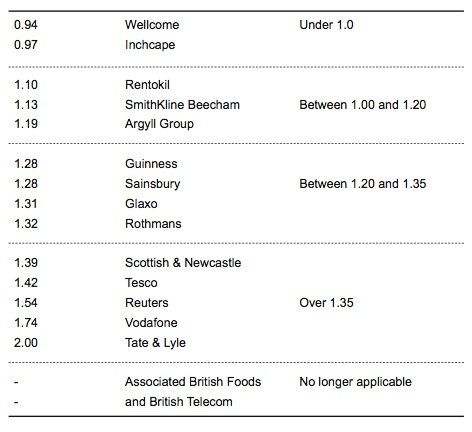
1. Argyll Group
Consensus forecast for the year ending 3/93 of EPS growth of 11%. Prospective P/E ratio at 350p equals 13.1, giving a PEG of 1.19.
2. Guinness
Consensus forecast for year to 12/92 of EPS growth of 11% and 13% in the following year. At 608p the average prospective P/E ratio for 1992/3 is 15.4 against average growth of 12%, giving a PEG of 1.28.
3. Rentokil
Consensus forecast of year to 12/92 of 21% growth and 19% in following year. Prospective P/E ratio for 1992 at 179p is 23.9 and 19.9 for 1993. The average prospective P/E for the year ahead is therefore 21.9 against average growth of 20%, giving a PEG of 1.10.
4. Rothmans
Consensus forecast growth for year to 3/93 of 9%. Prospective P/E ratio at 1100p about 11.9, giving a prospective PEG of 1.32.
5. Sainsbury
Consensus forecast growth for year to 3/93 of 13%, giving a prospective P/E ratio of 16.6 at a price of 475p. The PEG is therefore 1.28.
6. Tate & Lyle
Consensus forecast for year to 9/92 of 1%, and for year to 9/93 of 10% – say 5.5% on average. At 392p, on a prospective P/E ratio of 11 with a very high PEG of 2.
7. Tesco
Consensus forecast for year to 2/93 of 9% growth with a prospective P/E ratio at 281p of 12.8, giving a prospective PEG of 1.42.
8. Wellcome
Consensus forecast for year to 8/92 of a further 24% growth with 23% forecast for following year. Prospective P/E ratio at 971 p of 21.8 for 1993, giving a prospective PEG of 0.94. A clear system buy.
9. Glaxo
Consensus forecast for 1993 of 15% growth with a prospective P/E ratio at 771p of 19.7, giving a prospective PEG of 1.31.
10. Associated British Foods
Negative forecast of minus 31% in EPS for year ending 9/92. Forget it.
11. British Telecom
Fall in earnings forecast for year to 3/93. Forget it.
12. Scottish & Newcastle
Consensus 4/93 forecast of 9%, giving a prospective P/E ratio at 467p of 12.5 and a PEG of 1.39.
13. Reuters
Consensus forecast for year to 12/92 of 11% growth and 13% for year to 12/93. Prospective P/E ratio at 1190p of 18.5, giving a PEG of 1.54, based on the average growth rate.
14. Vodafone
Consensus forecast for year to 3/93 of 11% growth in EPS of a prospective P/E ratio at 383p of 19.1, giving a high prospective PEG of 1.74.
15. SmithKline Beecham
Consensus forecast for 1992 of 13% growth and 15% for 1993. Average prospective P/E ratio at 924p of 15.8, giving a PEG of 1.13.
16. Inchcape
Consensus forecast for year to 12/92 of EPS growth of 17% and 14% in the following year. At 505p the average prospective P/E ratio for 1992/3 is 15 against average growth of 15.5%, giving a PEG of 0.97.
Most of the sixteen shares were fully priced. Let us look at the range of PEGs again:
We have only managed to find two shares, Wellcome and Inchcape, that appear to be bargains in terms of the price to be paid for future growth. One reason for Wellcome’s inclusion is probably the proposed sale of £3bn worth of shares by the Wellcome Foundation. Some market makers might have depressed the price a little by selling shares, hoping to reload at a lower figure. By dropping our limit to a prospective PEG of 1.20 we expanded the portfolio to five shares. I was delighted to see that Rentokil was the first amongst them, as this has always been one of my favourite shares in the Index. By reducing the limit to 1.35, we admitted another four shares, giving a total of nine.
I am sure you will have noticed that the top nine selections, except Inchcape, have a strong competitive advantage and are in preferred industries. As you would expect their rate of return on capital employed is also startlingly above average.
Let us look at the details:
Average rate of return on capital employed 1987-91
Source: Datastream
Before we continue, there are four important points to be made:
-
- Prices, company results, forecasts and markets are constantly changing. I can only give you a snapshot of the position in June 1992.
- The arithmetic used is very rough and ready, without examining in great detail company debt, interim results and the like. My intention is simply to explain the basic idea.
- We are currently in a very deep recession, which is adversely affecting last year’s results and next year’s forecasts of many fine companies that would otherwise have been included. However, testing times like these separate the super-growth stocks from the herd.
- The Datastream screening was designed to select consistent growth shares and undoubtedly will have missed many recovery situations and turnarounds that offer very good value for money.
The average estimated growth rate of the top nine shares is 14.8% next year, and the average prospective P/E ratio is about 17. The average prospective P/E ratio of the FT-SE 100 Index depends upon your view of the prospective growth rate. The historic P/E ratio for the FT-SE 100 Index was 16.5 in mid-June 1992 and I estimate (especially after Fisons’ disappointing results and the June CBI review) that 5% is the
maximum
likely average growth rate for earnings next year. This view is currently shared by a number of leading brokers and if right will give a prospective P/E ratio for the index as a whole of about 15.7. You can readily see that to buy our top nine shares with proven records on an average prospective P/E ratio of 17, budgeting for a much more reliable 14.8% average earnings growth in the year ahead, is an obvious bargain when compared with buying the average FT-SE 100 share on a prospective 15.7 multiple, budgeting for much lower and
much less reliable
growth of only 5% in 1992/3. In other words, there is a negligible premium for established super-growth.
I was so surprised to reach this conclusion that I double-checked the FT-SE 100 Index to eliminate the large number of finance companies and recovery situations on very high multiples and the utilities on very low ones. The final result was the same – the super-growth shares still seem to be a
relative
bargain. In spite of this, the prices of our nine shares seem very expensive to me. This is almost certainly due to the market, in June 1992, being within 10% of its all-time high whereas the economic outlook remains bleak. If you deal in the top one hundred stocks, you need to become used to paying up for much higher PEGs in exchange for better marketability and extra security. With
patient
money I would much prefer to buy shares in smaller companies with PEGs of under 0.66. There will be times when you cannot deal, but provided the money invested is not needed for other purposes, the risk/reward ratio of investing in smaller companies with much lower PEGs seems to me to be a better proposition.
The first one hundred shares in the index are rather special, so let us analyse the second hundred (Tootsie) in a similar way to see if we can find any attractive bargains. The only shares that qualify with a 15% five year compound growth rate and with growth of 15% last year are Iceland Frozen Foods, Dunhill, W. Morrison, Spring Ram, Kwik-Save and The Body Shop. Iceland has a prospective PEG of 0.85, Spring Ram of 0.87 and The Body Shop of 0.90. All three companies enjoy a very high rate of return on capital employed.
I have only analysed the first two hundred shares from the perspective of seeking out growth shares that are relatively attractive. Needless to say, there are also a large number of turnarounds, cyclicals and asset situations in the Index. An excellent example of a recent turnaround now in the FT-SE 100 Index is English China Clays, which I have already mentioned in Chapter Eleven. Another less well-known example in the first five hundred shares is Amersham International, which caught my eye a month or so before the results were announced in June 1992. At 483p, the price after the announcement of earnings per share up a dazzling 44%, the market capitalisation was about £250m. The company’s activities include life science research, health care and industrial quality and safety assurance. Amersham has only a trivial £700,000 of debt and the brokers’ consensus forecast for 1992/3 was profits before tax of £24.7m to give growth of 20% next year. However, the brokers’ forecasts were made before the better than expected results, and I noticed in the
Evening Standard
that one broker was already considering upgrading its 1992/3 forecast to £26.5m before tax, putting the shares on a prospective multiple of 16.5. The growth from £20.7m to £26.5m is £5.8m which would be 28%. To be conservative, let us say 25%, giving a PEG of 0.66 (25 divided into 16.5), just qualifying for my system for small companies.
Amersham International, a wonder stock of the eighties, is making a recovery from a period of four years of declining profits as a result of the more cost-conscious and commercial approach of a new management team headed by Bill Castell. Some of the earnings growth may therefore come from one-off improvements, but, nevertheless, the shares seem to me to be attractive for a business of this size and quality.
The further down the scale you are prepared to invest, the better the bargains in terms of the prospective PEG. Amongst the top one hundred shares we could only find two shares that fulfilled our criteria and had a prospective PEG of under one. In the second hundred, we found three shares with more attractive PEGs. Further down the scale, we identified Amersham International as a bargain on a prospective PEG of 0.66. Moving on further into the second thousand shares, you can find companies like British Data Management on a prospective PEG of 0.45 and Industrial Control Services on 0.60. In some ways, you can compare the spectrum of differing PEGs with bargain hunting for antiques – if you buy an antique table in a Bond Street shop you have to pay a price that makes a contribution to their London high street rental. However, if the collector’s item you purchased had a major fault, you would be more likely to be able to get your money back from the Bond Street shop than from a small, out-of-the-way antique shop in a side street near Euston Station. The shares in smaller companies are undoubtedly riskier and less marketable, and that is reflected in the PEG you pay. My argument is that frequently the bargain value becomes irresistible.
If you are interested in recovery stocks you should read the book by Michael O’Higgins –
Beating the Dow
. His basic system is to take the ten highest yielding Dow thirty share stocks at the beginning of each year and then select the five with the lowest dollar prices. (He observes that lower priced stocks usually have smaller market capitalisations and that smaller companies tend to register greater percentage gains than larger ones. He does not go on to say that elephants don’t gallop but we know where he is coming from). O’Higgins argues that by following his simple system over the last twenty years, you would have enjoyed an average annual rate of return of over 20%, compared with 10.92% on the Dow. Philip Coggan ran a similar test on UK stocks in the
Financial Times
, and found that, since 1979, £10,000
with dividends reinvested
would have grown into more than £130,000 by early 1992. The same sum invested in the FT-A All-Share Index, also with dividends reinvested, would have grown to £81,540. The qualification of dividends being reinvested is an important one, as the shares selected under the system are high yielding.
If you decide that you want to concentrate your investments in larger companies, I recommend that you confine your activity to the top five hundred shares. The next step would be to determine your investment criteria for the kind of share you are trying to identify. For example, with asset situations, a discount to book value without excessive debt or current losses; for cyclicals, sales of over five times market capitalisation, asset backing of 80% or more of the share price and gearing not in excess of 100% of net asset value. You should then arrange, with your by-now-startled broker, for a Datastream analysis. When you have a small list of shares that have successfully run the gauntlet, you should read the press cuttings and study the annual reports and
The Estimate Directory
forecasts for the companies in question, to make sure that your other safety criteria are all in place.
You will find this approach much better than buying a share just because it takes your fancy. There could easily be a gem hidden amongst the five hundred top shares, and the one thing you know for certain is that you are unlikely to find something hidden without a search.
15. Overseas Markets
My system for investment in dynamic growth stocks works exceptionally well for American shares and will also work well in many other overseas markets. The important differences between America and the UK are that American accounting standards are far higher, results are quarterly, there are more growth companies and the degree of sophistication in investment management is in a different dimension.
Before you begin to invest in America, your reading habits will have to be expanded.
The Wall Street Journal
, a wonderful newspaper on a par with the
Financial Times
, is a daily must.
Value Line
, a truly exceptional weekly publication that would be hugely successful in the UK, is also mandatory. Each week about 200 companies are analysed in depth and rated by a
Value Line
analyst as to Timeliness and Safety. Very detailed statistics are given for each share showing quarterly earnings growth, balance sheets, book value, a chart of the share price, relative strength and an analyst’s detailed review.
Value Line’s
top recommendations for timeliness have substantially out-performed the market year after year.
In addition to reviews on individual shares,
Value Line
has further statistics on all the shares under review, highlighting high yielding stocks, high cash flow generators, widest discounts from book value, lowest P/E ratios, highest percentage returns on capital and high growth stocks. Paradise for the investment analyst.
A few years ago, I remember finding Celanese shares at $68 amongst the list of those at a discount to asset value and amongst the shares on a particularly low P/E ratio. Celanese also had $28 per share in cash. A real gem – a year or so later the company was taken over for $245 per share by Hoechst of Germany.
Barron’s
is a fine weekly paper that is broadly the equivalent of the
Investors Chronicle
, albeit that
Barron’s
is written in a racier style with a much more overt sense of humour. In addition to guiding you on your American investments,
Barron’s
will also help to give you a far better global perspective. Another important contribution to this end is
the Bank Credit Analyst
from Toronto, a superb monthly publication giving detailed statistics and views on the trend of world markets and currencies, with particular reference to Wall Street and the dollar.
Armed with my system, you can easily work from
Value Line’s
weekly reviews. You should ignore what their analysts say about timeliness and safety and simply calculate the PEG factor yourself and apply my other criteria. Once you have reached your own conclusions, double check your final view with the
Value Line
rating. You will be surprised how often your selections will be rated highly for timeliness. If the
Value Line
safety rating is very low be on guard and double-check your figures. You will probably find that the borrowings are very high or there is some other major problem. Always remember that you do not have to invest. You can wait until the following week or month and continue your search for an absolute gem. Never invest for the sake of it.
Needless to say, you will need a broker who is well versed in American shares. Your English broker may well be able to handle purchases and sales for you, but you must ensure that you also receive some kind of feedback and are kept abreast of major developments. Although you cannot expect too much help, you must try to avoid dealing with a Post Office. You will need some guidance. For example, when checking the value of a share you must pay careful attention to three peculiarities of the American market:
1. Post-retirement medical liabilities
In days gone by, American managements, when negotiating with the unions, could be very generous with shareholders’ funds by increasing post-retirement medical benefits for their employees and themselves.
Prior to 1992, you would have found no trace in the accounts of the liabilities arising from these benefits. Now, they have to be charged against profits. To catch up with the past, some major companies will be writing off billions in their next set of accounts.
2. Pension fund deficits
As a result of new regulations, from now on Pension Fund deficits have to be written off against profits over a period of years. For some companies the charge could be massive.
3. Environmental protection agency
In the USA, there has been a considerable reaction against businesses causing environmental damage. Recently, new legislation was passed, and the Environmental Protection Agency was formed to set standards and apply the new regulations. Anybody who has suffered a loss as a result of previous environmental damage can sue the company that caused the damage and even go beyond the corporate veil to attack shareholders. As members of Lloyds will know, American juries tend to be anti-business and are awarding vast sums in damages.
The cumulative effect of these three relatively recent developments means that many American companies, thought to be in good shape, have very substantial potential financial liabilities hanging over them, which could in some instances affect their future viability.
Emerging markets such as Indonesia, Thailand and Mexico are often shunned by investors because of illiquidity, very high volatility and the currency risk. It is worth noting that even on a risk-adjusted basis, emerging markets have substantially out-performed both the USA and Europe. One reason is that the growth in Gross Domestic Product of developing countries is much faster than more mature economies like the USA, Germany, Japan and the UK. A high growth rate in GDP is a wonderful back-cloth for investment in an economy, usually leading to higher earnings for individual companies. Another reason for the better performance of emerging market shares is that they tend to be under-researched by the investment community, in the same way that smaller companies are sometimes neglected in mature markets. Each market has to be examined on its merits, with particular reference to political stability, the economic background, fundamental values, currency risk and the investment opportunities that are available.
Dr. Marc Faber in
The Gloom, Boom & Doom Report
gives a very interesting summary of the life cycle of emerging markets. As he says, ‘First, stocks are in an embryonic stage. Then, when they reach adolescence, they grow very rapidly (bullish phase). During this stage, they are accident-prone (crashes). Later, markets mature, lose some of their energy and volatility, then become tired and finally die (bear markets)... Fortunately for stock markets, there is usually life after death. A new cycle begins which, like life after reincarnation, is very different in nature from the previous cycle.’
His six phases are depicted in the following graph.
Now let us look at what he says about each of the phases. His thoughts are well worth reading because they also give an excellent insight into the bull and bear cycle of all markets, which essentially move from no interest in stocks to a kind of mania, before going back to a phase in which investors give up on stocks again. Dr. Faber summarises his fascinating survey by making it clear that the objective is of course to enter the emerging market in question in Phase Zero or Phase One. He points out that during Phases One and Two, an individual stock can easily rise twenty to fifty times in value. In the next phase you enter a high risk zone.
Phase zero
|
Events
|
|
• Long-lasting economic stagnation or slow contraction in real terms.
|
|
• Real per capita incomes are flat or have been falling for some years.
|
|
• Little capital spending, and international competitive position is deteriorating.
|
|
• Unstable political and social conditions (strikes, high inflation, continuous devaluations, terrorism, border conflicts, etc.)
|
|
• Corporate profits are depressed.
|
|
• No foreign direct or portfolio investments.
|
|
• Capital flight.
|
|
Symptons
|
|
• Little tourism (unsafe).
|
|
• Hotel occupancy is only 30%, and no new hotels have been built for 30 years. Hotels are run-down.
|
|
• Curfews at night.
|
|
• Little volume on the stock exchange.
|
|
• Stock market has been moving sideways or moderately down for several years.
|
|
• In real terms, stocks have become ridiculously under-valued.
|
|
• No foreign fund managers visit the country.
|
|
• Headlines in the press are negative. No foreign brokers have established an office, no country funds are launched, and no brokerage research reports have been published for a long time.
|
|
Examples
|
|
• Argentina in the eighties.
|
|
• Middle East prior to the seventies.
|
|
• Communist countries after world war 2 until recently.
|
|
• Sri Lanka prior to 1990.
|
|
• Philippines between 1980 and 1985.
|
Phase one
|
Events
|
|
• The social, political and economic conditions begin to improve (new government, new economic policies, external factors, discoveries, the rise in price of an important commodity.)
|
|
• Improvement in liquidity because of an increase in exports, the repatriation of capital, and increasing foreign direct and indirect investments.
|
|
• The outlook for future profit opportunities improves significantly.
|
|
• Increase in cash balances and wealth.
|
|
• Consumption, capital spending, corporate profits and stocks begin to rise sharply.
|
|
Symptons
|
|
• Stocks suddenly begin to pick up.
|
|
• Tourism improves.
|
|
• Foreign businessman become interested in joint ventures and other direct investments.
|
|
• Hotel occupancy rises to 70%.
|
|
• A few foreign fund managers begin to invest.
|
|
• Curfews are lifted.
|
|
• Tax laws are changed to encourage capital formation and to attract foreign investors.
|
|
Examples
|
|
• Argentina after 1990.
|
|
• Thailand after 1985.
|
|
• Middle East after 1973.
|
|
• Mexico after 1984.
|
|
• China after 1978.
|
|
• Indonesia after 1988.
|
Phase two
|
Events
|
|
• Unemployment falls and wages rise.
|
|
• Capital spending in order to expand capacity soars, as the improvement in economic conditions is perceived to last forever (error of optimism).
|
|
• Large inflows of foreign funds propel stocks to overvaluation.
|
|
• Credit expands rapidly, leading to a sharp rise in real and financial assets.
|
|
• Real estate prices rise several fold.
|
|
• New issues of stocks and bonds reach peak levels.
|
|
• Inflation accelerates and interest rates begin to rise.
|
|
Symptoms
|
|
• The business capital resembles an enormous construction site.
|
|
• Hotels are full of foreign businessmen and portfolio managers. Many new hotels are under construction.
|
|
• Headlines in the international press are now very positive.
|
|
• An avalanche of thick, bullish country research reports are published by foreign brokers. Foreign brokerage offices are opened up. Country funds are launched.
|
|
• The thicker the reports, the more offices that have opened up, and the more funds that are launched, the later it is within phase two.
|
|
• Countries in phase two tend to become favourite travel destinations.
|
|
Examples
|
|
• Thailand between 1987 and 1990.
|
|
• Japan between 1987 and 1990.
|
|
• Kuwait between 1978 and 1980.
|
Phase three
|
Events
|
|
• Other investments lead to excess capacity in several sectors of the economy.
|
|
• Infrastructural problems and an excessive credit expansion lead, via rising wages and real estate prices, to strong inflationary pressures.
|
|
• The rate of corporate profit growth slows down, and in some industries, corporate profits begin to fall.
|
|
• A shock (a sharp rise in interest rates, a massive fraud, a business failure, or some external shock) leads to a sudden and totally unexpected decline in stock prices.
|
|
Symptoms
|
|
• Many condominium and housing projects, and new hotels, office buildings and shopping centres are completed.
|
|
• The business capital resembles a "boom town" – lively nightlife and heavy traffic congestion.
|
|
• Frequently a new airport is inaugurated and a second one is in the planning stages.
|
|
• New Cities are planned and developed.
|
|
• Real estate and stock market speculators flourish, make the headlines with their rags-to-riches tales, and fill the nightclubs.
|
|
• The stock and real estate markets become a topic of discussion. There is active retail and speculative activity, much of it on borrowed money.
|
|
• The locals begin to invest actively overseas in things that they have no understanding of (art, real estate, stocks, golf-courses, etc).
|
|
Examples
|
|
• Thailand after 1990.
|
|
• Singapore in 1980 and 1981.
|
|
• Japan in 1990.
|
|
• Indonesia in 1990.
|
Phase four
|
Events
|
|
• Credit growth slows down.
|
|
• Corporate profits deteriorate.
|
|
• Excess capacity becomes a problem in a few industries, but overall the economy continues to do well and the slowdown is perceived to be only temporary.
|
|
• After an initial sharp fall, stocks recover as foreign investors who missed the stock market's rise in phases one and two pour money into the market and as interest rates begin to fall.
|
|
• Stocks fail to reach a new high because a large number of new issues meet demand (the sellers are locals who know better or are strapped for cash).
|
|
Symptoms
|
|
• Condominiums have reached prices which exceed the purchasing power of the locals.
|
|
• Office capital values and rentals begin to level off or fall.
|
|
• Tourist arrivals begin to slow down and are below expectations. Hotel vacancy rates rise and discounts are offered.
|
|
• Brokers continue to publish bullish reports.
|
|
• Political and social conditions deteriorate (a coup, a strong opposition leader, strikes, social discontent, increase in crime, etc).
|
|
Examples
|
|
• Japan in the first half of 1991.
|
|
• Thailand in 1991.
|
|
• US investors in early 1930 and in the fall of 1973.
|
Phase five
|
Events
|
|
• Credit deflation.
|
|
• Economic, but even more so social and political, conditions now deteriorate badly.
|
|
• Consumption slows down noticeably or falls (car sales, and housing and appliance sales are down).
|
|
• Corporate profits collapse.
|
|
• Stocks enter a prolonged and severe downtrend as foreigners begin to exit the market.
|
|
• Real estate prices fall sharply.
|
|
• A big player goes bankrupt (one who made the headlines in phase three).
|
|
• Companies are strapped for cash.
|
|
Symptoms
|
|
• Empty office buildings, high vacancy in hotels, discontinued and unfinished construction sites are now common.
|
|
• Stockbrokers lay off staff or are closed down.
|
|
• Research reports become thinner. Country funds which sold at a premium during phase two and three now sell at a discount.
|
|
• The country is no longer a favourite tourist destination.
|
|
Examples
|
|
• Thailand in 1992.
|
|
• Singapore in 1982 and 1983.
|
|
• United States in 1931 and in late 1973.
|
|
• Japan in early 1992.
|
Phase six
|
EVENTS
|
|
• Investors give up on stocks. Volume is down significantly from the peak levels reached in phase three.
|
|
• Capital spending falls (error of pessimism).
|
|
• Interest rates decline further.
|
|
• Foreign investors lose their appetite for any new investments.
|
|
• The currency is weakening or devalued.
|
|
SYMPTOMS
|
|
• Headlines turn very negative.
|
|
• Foreign brokers finally turn bearish.
|
|
• Flights, hotels and nightclubs are empty.
|
|
• Taxi drivers, shopkeepers and nightclub hostesses tell you how much they have lost by investing in stocks.
|
|
EXAMPLES
|
|
• United States in 1932 and at the end of 1974.
|
|
• Hong Kong in 1974.
|
|
• Japan??
|
|
• Thailand??
|
|
• Indonesia??
|
The Fountain of Wealth shown in Dr. Faber’s newsletter attempts to categorise emerging markets according to their level of economic development and prosperity in June 1992. The analogy of a fountain is excellent, as water flows down from a higher level just as money flows down from rich countries with high price levels to poor countries with low price levels. The countries at the bottom of the fountain are still in Phase Zero but could move into Phase One at any time, provided the economic and legal infrastructure needed to attract foreign direct investors is put in place.
Countries like Argentina can move very quickly from one phase to another. Eighteen months ago Argentina might have been below the fountain, six months ago in the first water basin and in June 1992 in a higher basin still. Dr. Faber argues that today there are very few emerging countries with established stock markets which are still in Phase One. A few, like Brazil, Colombia and Argentina, might still be in Phase Two, but as they approach Phase Three the risk of a crash increases. Many countries have already reached Phase Four or Five; there is no rush to get back into them.
There is a great deal of money to be made by investing in an emerging market at precisely the right time, and remember that your choice of country can be more important than your choice of share.
The Bank Credit Analyst
has a new service,
Emerging Markets Analyst
, which should help you to make the right selection, and Marc Faber’s newsletter also highlights attractive opportunities from time to time. However, as a potential follower of The Zulu Principle, you would probably be better advised to first become expert on one method of investment in your own back yard.
16. Your Broker And You
You must find a good stockbroker to help you with your investments. Most of the larger brokers naturally concentrate their efforts upon servicing the institutions, investment trusts, unit trusts and other major investors. Some brokers will not take on small private accounts unless the initial portfolio totals £100,000 or more. However, there are others who do not have a minimum limit and would be pleased to help private investors with a starting portfolio of as little as £10,000. Bernard Gray, in the
Beginners’ Guide to Investment
, gives a list of private client brokers in Appendix C, together with their telephone numbers. Another source is the
Directory of Private Client Stockbrokers
, which is available free of charge from ProShare (Tel 071 600 0984).
Brokers’ commission on purchases and sales of stock can range from 1.65% to less than 0.5% according to the size of the transaction and the importance of the client. You should not begrudge your broker a top of the range commission on each transaction, provided he gives you good service. You want a broker who is switched on and really anxious to help you. Quality of service is far more important than the rate of commission.
You have to bear in mind that your broker would be unnatural if he was not to some extent commission orientated. The more you turn over your portfolio, the more commission your broker will earn in the short run. However, I hasten to reassure you that most brokers have the long-term interests of their clients at heart and will not try to persuade them to deal simply to earn a commission. You should try to find a broker who is value-minded, not quotation-minded.
You also have to be on guard against brokers who have a favourite share that they keep tipping. Let me tell you the story of an American broker we will name Dan. He was very keen on the shares of a small company, Widgets Inc., which was quoted on NASDAQ in a very narrow market. He recommended a new client to buy 5000 for $2 each. The shares duly doubled in price. When the client telephoned to sell, Dan replied, ‘You must be mad. The company has a new product that is far better than the original widgets and it has just signed a royalty agreement with a leading manufacturer. You should buy some more.’ The client obliged and bought 2500 more shares for $4 each.
Within a few weeks, the shares had doubled again. ‘Thanks a lot,’ said the client. ‘You’ve made me a great deal of money. Please sell all my shares now.’
‘You must be mad,’ said Dan. ‘You know that manufacturer I told you about, it’s going to take over Widgets. There should be an announcement during the next couple of weeks. I would buy some more.’
‘Buy me another 1000,’ replied the client.
A few weeks later, although there was no takeover, the shares had reached $16 each. The ecstatic client phoned his broker. Before Dan could say a word, he gave his instructions. ‘I want you to sell all my shares now,’ he said.
‘To whom?’ replied Dan.
The problem for many small investors is that they feel their initial account is so tiny and unimportant to the broker, that they cannot be too demanding. This is of course true, but there is an absolute minimum of information that the private investor, however small, can and should request. As the account grows there is another, higher level of service that can be progressively demanded. Let me outline for you the minimum standard you can reasonably expect as a small private investor:
-
- Any verbal or written recommendation from your broker should be accompanied by details of the current P/E ratio of the share in question, the dividend yield, the NAV per share, the market capitalisation, the past record of earnings growth, the brokers’ consensus of estimated future growth, the prospective P/E ratio, borrowings and your broker’s reasons for buying. A copy of the
Extel
card should also be available on request, together with information on the share’s relative strength and details of any recent Directors’ share dealings.
- Any execution should be carried out efficiently, at the price limit mutually agreed with the broker.
- Subsequently, you should be kept informed of any major new developments, such as Directors’ share dealings, any announcements made by the company and details of any very sharp price movements.
As your relationship develops and you become a major client, you should expect your broker to provide a copy of the Datastream relative strength chart for any share in which you are interested, and if necessary obtain a copy of the annual and interim accounts for you. Also, your broker should be able to supply the last six months’ press cuttings and a copy of any recent circulars by other major brokers. You cannot expect this kind of service until you are paying your broker sufficient commissions to justify special treatment. You should restrict your requests for the fullest information to those companies in which you are very likely to invest. Obviously you do not want to wear your broker’s patience too thin with hundreds of spurious enquiries.
I have in the past dealt with brokers who ring me up to say, ‘English China Clays looks very good. There is a rumour that Hanson are going to bid.’ Or ‘Tesco’s results are coming out on Wednesday. They will be better than expected. The shares look very cheap.’ I hate these kind of share tips. They are worse than useless – they are a definite drawback to good money management. When brokers tell me a share looks good, I immediately ask for details of the price earnings ratio, the asset value, the record over the last five years, the growth rate and the brokers’ consensus forecast. I want facts and try to limit fancy. If you do the same, your broker will quickly get the message that you are one of those strange people who actually wants to concentrate upon the known facts first, second and last. Once you have established a modus vivendi with your broker, he or she can and should become an invaluable ally and aid to the successful management of your investments. It is important to start off as you mean to continue.
Your other aid to investment is your daily, weekly and monthly reading. You should not underestimate the importance of technical and trade magazines in the areas in which you specialise or have an interest. On occasions, you might notice a new brand or a new invention that is selling particularly well, and be in a position to take advantage of this information well before the general market. For financial news the bare minimum you require is the
Financial Times
every day, another good daily paper, a leading Sunday paper and the
Investors Chronicle
every week. The
Financial Times
is one of the finest newspapers in the world and an absolutely indispensable investment tool for investing in the UK stock market. Even if you do not have time to read the
FT
thoroughly every day, be sure to read the weekend edition, which summarises the week’s movements in major markets and contains many excellent articles of a more general nature.
I take several daily papers and read most of the Sundays. In addition I subscribe to the
Fleet Street Letter
, which is published fortnightly, and to
The Investors Stock market Letter
, which is weekly. I also take
The Penny Share Guide
and
Penny Share Focus
, which are monthly publications concentrating upon smaller companies.
The Economist
, which is published weekly, is an excellent magazine for keeping in touch with world economic and financial developments. I particularly recommend to you the last couple of pages, which highlight Economic and Financial Indicators, showing the performance of world stock markets, money supply statistics, world interest rates, trade balances, reserves, exchange rates, industrial production, GNP, GDP, retail sales, unemployment, consumer and wholesale price movements and wage increases on a week by week basis.
During the last two years, I have also subscribed to
Analyst
, which has many interesting in-depth articles each month on investment systems and approaches as well as excellent company profiles and very detailed commentaries on smaller growth companies.
In the chapter on American shares, I mention
The Wall Street Journal
,
Barron’s
and
The Bank Credit Analyst
, all of which help to give a global picture of the investment scene. In particular, I have found
The Bank Credit Analyst
excellent at determining major market trends, especially on Wall Street.
Value Line
is also an indispensable tool for investing in American shares.
I find extensive reading is essential to keep in tune with markets. To this end, another interesting newsletter is
The Gloom, Boom & Doom Report
which is edited by Dr. Marc Faber. He is often extremely bearish, which helps to cool me down when I begin to feel uppity.
I also subscribe to
The Estimate Directory
, which gives brokers’ consensus estimates of future earnings and details of the brokers who have written circulars on the companies in question. There are also publications like
Directus
, which highlight Directors’ share dealings, but, unless you transact a large volume of investment business yourself, you should be able to obtain these details through your broker, at least as far as they affect the shares in which you are particularly interested.
Before leaving the subject of reading about investment, I would like to recommend to you ten excellent American books which have influenced my investment thinking:
-
-
The Intelligent Investor
by Benjamin Graham (Harper and Row USA). An investment classic which Warren Buffett believes is the ‘best book on investing ever written.’ The main subjects are the virtues of ‘value investing’ and a systematic approach. Not a quick and easy read, but full of revelationary and intriguing ideas.
-
Security Analysis
by Graham and Dodd (McGraw-Hill Book Co. USA). The fifth edition brings this investment classic up to date. The book, which is very hard going, outlines in great detail the principles and techniques for measuring asset values, cash flow and earnings.
-
Extraordinary Popular Delusions and the Madness of Crowds
by Charles Mackay (Farrar Strauss and Giroux USA). First published in 1841 – a classic on crowd psychology. Fun to read and one of my favourites.
-
The Midas Touch
by John Train (Harper and Row USA). A detailed exposition on the strategies that have made Warren Buffett America’s pre-eminent investor. An easy and entertaining read.
-
Market Wizards
by Jack Schwager (Simon and Schuster Inc. USA). Interviews with top traders in commodities and stock markets, concentrating upon their individual approaches and attitudes.
-
One Up on Wall Street
by Peter Lynch (Penguin). An excellent and very readable book by one of America’s most successful mutual fund managers.
-
Technical Analysis of Stock Trends
by Robert Edwards and John Magee (John Magee Inc USA). An authoritative book on technical analysis, but a very hard read. Only for the dedicated.
-
The New Money Masters
by John Train (Harper and Row USA). A very readable account of the highly successful investment strategies of investment giants like Soros, Lynch and Rogers. Train’s previous book,
The Money Masters
, is also good value.
-
Reminiscences of a Stock Market
Operator by Edwin Lefevre (Fraser Publishing Company USA). An amusing account of Jessie Livermore’s early life, showing how important it is not to fight the market but to go with the force.
-
Beating the Dow
by Michael O’Higgins and John Downes (Harper-Collins USA). A detailed exposition on Dow stocks and a method of buying those that are out of favour to produce returns that dwarf the market averages.
To obtain copies of some of these books is often difficult. You may find them stocked by the main highstreet bookshops such as Waterstones, WHSmith or Foyles, but you are more likely to find them at a specialist in books on business and investment such as Global Investor Bookshop, www.global-investor.com
, 3A Penns Road, Petersfield, Hampshire GU32 2EW (Tel +44 (0)1730 233870).
If you are not full time in the investment business, you might find some of the recommended books very hard going. I suggest, therefore, that you begin with those that are an easy read and entertaining as well as instructive. To get you in the mood, try
One Up on Wall Street first
, followed by
The Midas Touch
and
Beating the Dow
. If you are going to apply The Zulu Principle and master the subject of investment, there is no escape from further homework.
17. Portfolio Management
Aprivate investor with a relatively small portfolio has a considerable advantage over institutions with massive funds to invest. The institutions have to spread their investments over as many as two hundred stocks, and in some cases even more. The private investor probably holds a maximum of ten to twelve shares in his portfolio. I work on twelve to fifteen, but on occasions as few as eight.
Why is investing in ten stocks an advantage over investing in a hundred? Your first choice is obviously far better than your tenth, which in turn should be considerably better than your hundredth. Secondly, the fewer stocks in your portfolio, the easier it is for you to keep a really keen eye on them all. The Zulu Principle again.
After my initial due diligence, I always try to keep a watching brief over the few stocks that constitute my portfolio. Needless to say, I read about all major developments and keep an eye on Directors’ share dealings. I also keep an eye on retail sales. Let me give you a recent example – after Psion introduced their new palm-top computer, they had some teething troubles, and a batch had to be withdrawn. While I was interested in the shares, whenever out shopping, I took the opportunity of dropping into a Dixons store and, under the guise of being a prospective customer, asked an assistant how Psion sales were progressing, if they were recommending anything better and whether or not they had had any trouble with the product.
More recently, Psion had some further technical problems, which caused the computer, in a few instances, to lose track of time. One of my broker’s clients is a computer buff who acquired a more up-to-date version. He is now well satisfied and has had no further trouble. I also asked a friend who is a computer consultant to buy for me the most up-to-date version of the Series 3, together with the appropriate software, and test it rigorously. He gave me a favourable review.
My anxiety was to establish if the teething troubles were part of normal product enhancement appropriate to break-through technology, or if the product was giving exceptional trouble that was likely to be on-going and costly. I was reassured by the results. If my portfolio had contained one hundred different shares, I would have found it impossible to maintain such a hands-on approach.
You may feel that I have a special advantage in being able to check up on a company in my portfolio. You will in fact be surprised to find that you are probably not more than one or two people away from someone who can give the answers you require. I remember my Chairman at Leyland, Lord Black, saying that when he had his photograph taken for The National Photographic Gallery, he commented to the photographer that he was surprised to find that he knew personally all the famous people in the many photographs hanging on every wall of the studio. The photographer smiled and remarked ‘They all say that’. The world is a small place – with just one telephone call, most of those people would have been able to check up on a major new development in many different fields. If you really want to verify something about a company, you will soon find someone who knows someone who can answer your questions. You can also try telephoning the Company Secretary, explain that you are a shareholder, and ask for clarification of any points that may be worrying you. Some Secretaries are very helpful indeed, but they will naturally avoid giving you any ‘inside information’.
There is another obvious way of acquiring information about a company in which you have invested – attend the Annual General Meeting. You will find this an interesting experience that will help you to get the feel of the company. Is the meeting well organised? Are the Chairman and the Chief Executive impressive and do they answer questions well? Is the mood of the meeting upbeat or downbeat? These are the kinds of general questions you should ask yourself. If you have any specific ones, that remain unanswered, you can always stand up and fire them at the Chairman.
I mentioned earlier the dreaded words ‘inside information’. A grey area that is constantly changing. From the investor’s viewpoint, the main thing to avoid is using unpublished and price-sensitive information about a company’s future results or a major development such as an impending takeover. Acting upon certain knowledge of a coming unexpected rise or fall in a company’s profits is illegal – tips based on this kind of information are therefore obviously best avoided. Takeover tips have an even more inside flavour as the parties involved are under an obligation to make an announcement as soon as they have agreed a deal subject to shareholders’ approval (or the predator has unilaterally formed an intention to bid on specific terms).
There is a profound difference between thinking that a company might not be doing so well, after studying the generally available brokers’ consensus forecast or national retail sales, and
knowing
from a member of the board that profits are suffering. There is also an obvious difference between concluding that a company might be taken over one day because its assets are grossly under-valued and
knowing
that an acquisitive conglomerate is about to take it over. Acting upon unpublished price-sensitive information is illegal. Acting upon your own judgement based upon generally available facts about a company is fair game and permissible.
There is an old adage on the management of a portfolio – cut losses and run profits. Easy to say but much harder to do. Warren Buffett had a wonderful way of illustrating why you should follow this practice. He took the hypothetical case of being offered the future earnings for life of each and every member of his graduation class. Adapted for the UK, let us take a class of twenty and say that you could have bought all your classmates’ life earnings for a fixed sum. Fifteen years elapse before you review the position. Two have died, two are drug addicts, one has A.I.D.S., one is in prison and three are unemployed. Amongst the rest there is a priest, three accountants, two lawyers, a detective sergeant in the police and an actor. The remaining three are really in the money. Of the high-flyers, one is already a captain of industry, another a leading financier and the last one is in line to be Chief Executive of a leading company. If you had to make a few sales at differing prices, would you keep the drop-outs, those who had performed reasonably well or the high-flyers? I know your answer.
Another analogy is of a racehorse owner who has bought ten yearlings for £25,000 each. Seven soon prove hopeless, two quite promising and the last one an absolute star. A successful racehorse of great class can earn good prize money and massive stud fees. Our owner needs to cut down on training costs and stabling expenses and raise a little capital. Which horses should he sell? The hopeless seven followed if necessary by the promising two. He should run his profit on the star.
Pursuing the two analogies of the classmates and the racehorses, it is easy to see when losses should be cut. The reason for selling the dropouts and the hopeless horses is that
their story has changed
. When you bought the classmates and the yearlings, you may have fancied the prospects of some of them more than others, but you hoped all would succeed. The obvious failures extinguished that hope.
You will remember that in Chapter Six, on ‘Something New’, I made the point that the story of a stock is an important cross-check to which you must continually refer back and check against each new development. Taking a growth stock, for example, if you see that the dividend is only being maintained instead of a more traditional increase you must be alert to a possible slow-down in growth. If several of the executive Directors are selling large parcels of new shares, if the Chairman’s statement becomes more cautious, if the relative strength of the stock is very poor, if the Chief Executive you admired suddenly leaves, if the Balance Sheet shows an alarming growth in debt, if you hear of major troubles with the product, if you notice that creative accounting has been at work in a big way – any of these factors might be sufficient to persuade you that the story has changed.
The reasons you bought no longer apply
. The share has become a sell.
The only one of these possible adverse developments that is slightly suspect is the worry about poor relative strength of the share price. Sometimes this happens in isolation for no apparent reason. If the share price falls, arguably, you could buy more stock with exactly the same story that first appealed to you at a substantial discount to your initial purchase price. However, my advice is never to average down.
When shares are performing poorly, I always try to check if there is a big institutional seller. If I can rationalise the fall in price I hold on, but if not I become jittery. As you have probably gathered by now, l am a nervous investor who is very easily frightened. I hate to lose money and on occasions have simply sold because the price action of the shares alarmed me.
There is no formula – you will have to make up your own mind. If you are going to set a cut-off limit for apparently inexplicable losses, I suggest 25% for growth shares, turnarounds and cyclicals and 40% for shells. A formula is not really the answer though. Each share has to be considered on its merits, and both judgement and feel come into play in a big way.
In contrast, if a company’s story changes for the worse to a material extent, I
immediately
sell. Speed is of the essence – you want to be first in the queue of disappointed enthusiasts. The share may already have fallen substantially below your purchase price, but that is irrelevant. Cut your loss. You will enjoy a great sense of relief and your portfolio will make for much better viewing.
To my mind, cutting losses is easy and obvious. By far the most difficult task is to decide when to take a profit. At different times in their lives, shares are either a buy, a hold or a sell. You buy a share because it fulfills the criteria of whatever system of investment you are following. As the price increases the share becomes a hold – no longer a buy but not sufficiently matured to become a sell. Turnarounds, cyclicals and asset situations mature more quickly than growth shares. The reason is simple – there is usually a one-off gain to be enjoyed.
As soon as the turnaround has been recognised by one and all, the cyclical has benefited substantially from an up-turn in the economy or shares in the asset situation have appreciated to a level more in line with the underlying worth, the shares should be sold. The status change that you were buying for has been achieved. Now you should look for another share with the same initial potential and try to repeat the process.
Growth shares (and for similar reasons shells) can be very different. If, after a long period of trial and error, you have managed to identify a few excellent growth shares that are churning out earnings per share growth at an exceptional rate of say 20% per annum, you must not let go of them lightly. They might be your ticket to an extraordinary profit. You may have found another Glaxo or Hanson in its infancy.
There are two additional reasons for extending the ‘hold’ area when the price of a growth share is beginning to mature. The first is the expense of switching. Stamp duty, brokerage and the market makers’ turn, both on the share you are selling and the new ones you are buying, might cost you in total as much as 5%-10%, according to the marketability of the shares.
The second factor is capital gains tax. As I have explained, when you take a large profit you crystallise the capital gains tax liability of up to 40% of the gain (less indexation), which is the equivalent of repaying an interest-free loan of that amount to the Government. While you continue to run the profit, the Government is in effect lending you up to 40% of the gain to finance the shares interest-free. Savour this. The more you run the profit the more the Government lends to you.
While on the subject of capital gains tax, I should draw your attention to personal equity plans (PEPs), which were introduced to encourage the general public to invest in quoted companies. They offer a simple way of investing a limited amount of money each year on a tax-free basis – tax can be reclaimed on all dividends and capital gains are free of capital gains tax.
PEPs fall into two categories – general and single company. An individual can invest in each fiscal year up to £6,000 in a general PEP and £3,000 in a single company PEP.
Many investment management companies offer general PEPs through direct mail or advertisements in the national press. The success of these schemes does, of course, depend on the skill of the investment managers, as the investor has no say in the choice of stocks. However, most stockbrokers offer a service to enable investors to run their own schemes and choose their own quoted investments. PEPs are, therefore, an essential tool for anyone using my system of investment, especially for growth shares. A man and his wife can use the full annual limits of £9,000 each. Children cannot be included, unless over eighteen, and all participants must be resident in the UK for tax purposes.
There are very few rules. Your broker will do everything for you – keep the records, look after the share certificates, collect the dividends, advise about rights issues and takeovers and provide you with regular statements. PEP transactions need not be included in your tax returns. There is no limit to the length of time your PEPs need stay in existence. PEPs can be closed at will and all the funds withdrawn, without incurring any tax liability on profits and without the benefit of being able to offset any losses against taxable gains.
Brokers do, of course, charge for their services; typically – £30 for start up, usual dealing commissions, valuation fees of £3 per stock and cancellation fees if you close the account or transfer your PEPs elsewhere.
If you buy a growth share on a PEG factor of 0.75 or less, earnings increase over a year by say 20% and the PEG rises from 0.75 to 1.00, you will enjoy a capital gain of 60%. If the company continues to perform well and looks like a long-term winner, I would, however, hang in there for a little longer and wait until the PEG rises to 1.2. Put in terms of P/E ratios, this would be the equivalent of buying a share growing at 20% per annum on a multiple of 15 and selling when the multiple had risen to 24. After a year, the 20% growth plus the status change in the PEG factor would have almost doubled your money, and you could say to the shares a reluctant
adieu
. Perhaps, on reflection, I should say
au revoir
because having identified a quality share like this, you should keep your eye on the company while you wait for a better moment to repurchase.
You have to bear in mind that with super-growth companies the market often overdoes the hope factor. Really great companies can stand the strain of a very high multiple – they continue to churn out their 20%-25% earnings growth each year so that eventually the fundamentals catch up with the price. Other companies disappoint (perhaps only a little), and their share prices come tumbling down. Erstwhile enthusiasts scramble to find the exit.
You have to try to strike a nice balance between running the profit on a super-growth share and operating within a reasonable safety factor. Perhaps the best way of expressing this is to say that cyclicals, turnarounds and asset situations should be sold on recognition, but with super-growth shares you should wait for adulation.
With shells, as I suggested in Chapter 12, you should run the profit for one year before reviewing the position. There will frequently be very few fundamentals to evaluate. Usually, you have to take a view on the new management team and give them sufficient time to do their job.
The constitution of your portfolio will depend upon the system or systems you have elected to follow. I tend to concentrate upon growth shares and shells. The other major decision you have to make is the amount of cash you intend to hold when you begin to feel bearish. Provided your portfolio is funded with
patient
money, you can afford to remain fully invested. Bull markets climb a wall of worry, and your bearish view might well be wrong. You could easily decide to go liquid and subsequently become fully invested again at just the wrong moment. You may, however, feel more comfortable if you become more liquid at times. In that event, I would recommend a maximum of 50% cash.
Another way of protecting your portfolio is to sell the market as a whole by shorting the FT-SE 100 Index through the futures market or by buying put options. I could write another chapter on this subject alone. The FT-SE 100 Index includes many cyclicals and utilities, so these techniques do not necessarily provide protection for growth stocks, which may perform badly as a sector. On the other hand, the FT-SE 100 Index can usually be sold with the benefit of the contango (imputed interest to the future date of sale). Futures markets can sometimes be very unnerving and frequently move out of kilter with the shares you are trying to hedge. I recommend leaving options and other derivatives to very experienced investors.
Traded options are another growing medium of investment, which by June 1992 applied to 66 top companies. If you are investing in leading stocks, traded options frequently provide a way of obtaining substantial leverage and limiting risk to a few per cent. This is a specialised subject, covered very well in Geoffrey Chamberlain’s book
Trading in Options
.
There is a safety factor in each of the methods of investment I have outlined. This should help to protect you from extreme losses. In a very sharp bear market almost all shares go down, but shares bought in a systematic way will fare better than most. In fact, one of the most reliable tests of an impending bear market is that you will find it extremely difficult to identify shares that fit your highly selective criteria. Many of the shares that were in your portfolio will have been sold because they have fulfilled your objective and are now over the top.
At the risk of over-reminding you about the safety factor, let me reiterate how it applies to all the systems we have examined. Growth shares are being bought on low multiples and low PEG factors – an obvious cushion compared with the market as a whole. In addition, they have to fulfill other rigorous criteria that taken together form a safety net.
Turnarounds and cyclicals should be bought near the bottom, when there is good reason to hope for a recovery or an upturn in the cycle. Another obvious cushion. Turnarounds should be sold when the companies have been turned around and are making good profits. Cyclicals should be sold when there is general recognition that the company has survived the downturn and is enjoying far better trading conditions.
Asset situations should be bought at a substantial discount to realisable values, and should be sold when these values are understood and fully appreciated by other investors. In this case your cushion is the discount on assets and the additional safety net criteria. Of course, the shares can fall in price, but at least you start at a relatively low level with less downside.
Shells are more difficult. Your main safety factor is the selection of a company with top class management, coupled with a small hot air gap and reasonable liquidity. If you are investing mainly in shells and you begin to feel very bearish, I would recommend moving into 50% cash, even if your money is relatively patient. Shells tend to fare very badly in bear markets because a large part of their price is anticipation and hopes for the future. Also, the market in these kinds of shares can suddenly become very narrow and illiquid.
Let me summarise for you the important points that have been made in this chapter:
-
- Your portfolio should be no more than twelve shares funded by patient money. Ten is the recommended minimum, with a maximum of 15% invested in any one share.
- Maintain a really hands-on approach after buying. People who can help to answer your questions about your investments know people who know people within your acquaintance. You can also be very active yourself.
- Run profits and cut losses.
- Additional factors that make it desirable to run profits are the expenses of switching and the crystallisation of capital gains tax liability if you make a sale. The Government is in effect lending to you the capital gains tax liability interest-free while you run the profit on your shares.
- Profits should be taken on turnarounds, cyclicals and asset situations when the turnaround is generally acknowledged, the cycle is well advanced, or the share price has appreciated nearer to asset value.
- Profits on growth shares should be taken more reluctantly. A real gem with earnings continuing to increase at the rate of 20% per annum should be held until the PEG factor is 1.2. You will probably regret selling even then, so keep an eye on the company while you wait for a better moment to repurchase.
- Profits on shells should be run for a year to give the new management an opportunity to show their paces.
- Losses should be cut on all shares when the story changes for the worse to such an extent that you would no longer consider buying.
- If the relative strength of a share is poor, with an apparently inexplicable fall in price, check the market position with your broker. If you cannot find an explanation, you have to use your judgement and feel to decide whether or not to cut the loss. If you are going to adopt a formula for automatically cutting losses, I recommend a 25% limit for turnarounds, cyclicals and growth shares. With shells I suggest losses should be cut if the share price falls by 40%.
- Your portfolio can be a mixture of the different systems outlined in earlier chapters, but you would probably be better advised to apply The Zulu Principle to one of them.
- To save capital gains tax, take advantage of self-managed PEPs, especially when investing in dynamic growth companies which you hope to hold as long-term investments.
- If you feel a bear market is imminent move into up to 50% cash unless your portfolio is easily spared, patient money which you can afford to leave invested through thick and thin. With shell portfolios, you should definitely move into 50% cash if markets are looking dangerous.
- Leave options, short selling and other derivatives to very experienced investors.
- There are safety factors in all of the systems I have outlined which should help your portfolio to perform relatively well in both good and bad markets.