![]()
Farewell to Increasingly Cheaper Capital?
MUMBAI’S IMPOSSIBLY PACKED COMMUTER TRAINS ARE THE STUFF of legend. Each day, more than 7.5 million passengers perform dangerous acrobatics to latch onto one of the 2,300 train departures, which are often the only viable means of transport during the monsoon season.1 Every year, an estimated 3,500 people—nearly 10 people every day—die in rail-related accidents in Mumbai alone.2 Even beyond the tragic human cost, this kind of overcrowding, and the deficit in infrastructure spending it represents, has the potential to derail India’s impressive growth story.
And what a story it has been. Since 1991, India’s GDP per capita has increased nearly fivefold, the nation’s foreign exchange reserves have increased nearly fiftyfold, and annual foreign direct investment inflows have surged by a factor of 200.3 Future prospects look no less bright. Estimates are that India will rise from the tenth-largest economy in the world in 2013 to the third largest by 2030.4 India’s young and rapidly urbanizing population could become the country’s “demographic dividend,” fueling growth and prosperity over the decades to come. By 2030, India could have an urban population of approximately six hundred million, nearly twice that of the entire United States as of this writing. India will be home to two of the world’s five most populous cities, along with sixty-eight other cities of more than one million inhabitants each.5
But unless India significantly steps up investment in its cities, the infrastructure deficit may wipe out urbanization’s productivity dividend. Before the financial crisis, India’s annual capital spending per capita was only 14 percent of China’s and 4 percent of the United Kingdom.6 Decades of chronic underinvestment are evident in the country’s strained infrastructure and the lack of basic services in its cities. The ranks of commuters in Mumbai are rising at three times the rate at which rail capacity is growing.7 Power cuts are frequent, and electricity generation routinely falls about 15 to 20 percent short of peak demand. Waste and water infrastructure is sorely lacking, with over 30 percent of city sewage going untreated and one in four people living without access to piped water.8
Vibrant cities are an absolute necessity if India is to live up to its potential as a global economic powerhouse. But the country is suffering from a longstanding shortfall in capital investment. Just to meet urban demand, India needs to build between 700 million and 900 million square meters of residential and commercial space a year, construct between 350 and 400 kilometers of metros and subways every year, and pave 2.5 billon square meters of roads—twenty times what it has paved in the last decade. To do so, India would need to invest $1.2 trillion in capital expenditure—eight times the current per capita level—in its cities by 2030.9
India is by no means an isolated case. Amid a growth boom, the global investment rate as a percentage of GDP has paradoxically declined, falling from 25.2 percent in 1970s to 21.8 percent in 2009.10 In large measure, the decline reflects the ebbing of the post–World War II investment in Japan and Western Europe. But looking ahead, weak global demand for capital is unlikely to continue. The world’s major emerging economies—Brazil, China, and India—all need to increase infrastructure investment to keep up with demand being driven by urbanization and population growth. The world’s low- and middle-income economies need to increase their rate of investment to meet economic and human development goals. Advanced economies need to address years of pent-up underinvestment if they are to improve the capacity and service levels of existing infrastructure. The global level of infrastructure investment needed to simply keep up with the pace of economic growth over the next two decades will rise to between $57 trillion and $67 trillion, or 60 percent more than the historical amount over the same period.11 And rising demand for investment is but one of the factors that may conspire to push the price of capital higher.
TREND BREAK
Warning of more expensive capital in today’s environment may seem like warning against drought as a monsoon rages. A simple look out the metaphorical financial window would suggest that there isn’t much of a problem. Thirty years of declining interest rates have created an expectation that capital is cheap and will remain so. Our intuition also includes this expectation: most of us believed that asset prices, which are fueled in part by the ability to borrow, can only rise in the long term, volatility in the short term notwithstanding. Indeed, US home prices rose an average of 6.4 percent per year between 1968 and the mid-2000s, without a single year of decline.12 In Brazil’s two most populous cities, São Paulo and Rio de Janeiro, prices have more than doubled since 2008.13 London home prices almost doubled in each of the last three decades.14 Between 1980 and 2013, real house prices increased by 55 percent in Sweden, 85 percent in France, and 130 percent in Canada.15 The combination of the weak demand for capital (driven by decades of low infrastructure investment rates) and an abundant supply of capital (driven by several years of unconventional monetary policy) have made capital today cheaper than it has ever been, a development that has underpinned rising asset prices.
But a big shift is underway, and it will require us to reset our intuition—along with our expectations about the future of capital costs and asset prices. However, while it is clear that a trend break is occurring, the direction is anything but clear. Will it be driven by the traditional view of supply and demand, in which interest rates rise? Or will it be driven by the central banks’ unprecedented actions in the aftermath of the 2008 financial crisis, which have created an enduring new reality of suppressed rates? We have come through an era in which there was great certainty about interest rates—both their level (low) and general direction (down)—and about the level (high) and direction (higher) of asset prices. That trend is breaking, as experts such as Harvard economist Martin Feldstein have noted: “Long-term interest rates are now unsustainably low, implying bubbles in the prices of bonds and other securities. When interest rates rise, as they surely will, the bubbles will burst, the prices of those securities will fall, and anyone holding them will be hurt.”16
As the emerging world continues to industrialize and urbanize, its need for investment is surging. From Kumasi to Mumbai, from Porto Alegre to Kuala Lumpur, capital-intensive building projects are being planned. As countries invest in infrastructure, the additional demand will be amplified by companies seeking to invest in new capacity, equipment, and upgrades in order to keep up with disruptive technologies. These demands on capital will coincide with an aging global population and long-term government deficits—which will put pressure on the world’s pool of savings just as demand picks up. Based on the traditional view of macroeconomic fundamentals, the combination of rising demand and pressure on supply spells one outcome: a world with tighter, more expensive capital.
Central bank actions have come at the end of a thirty-year period of declining interest
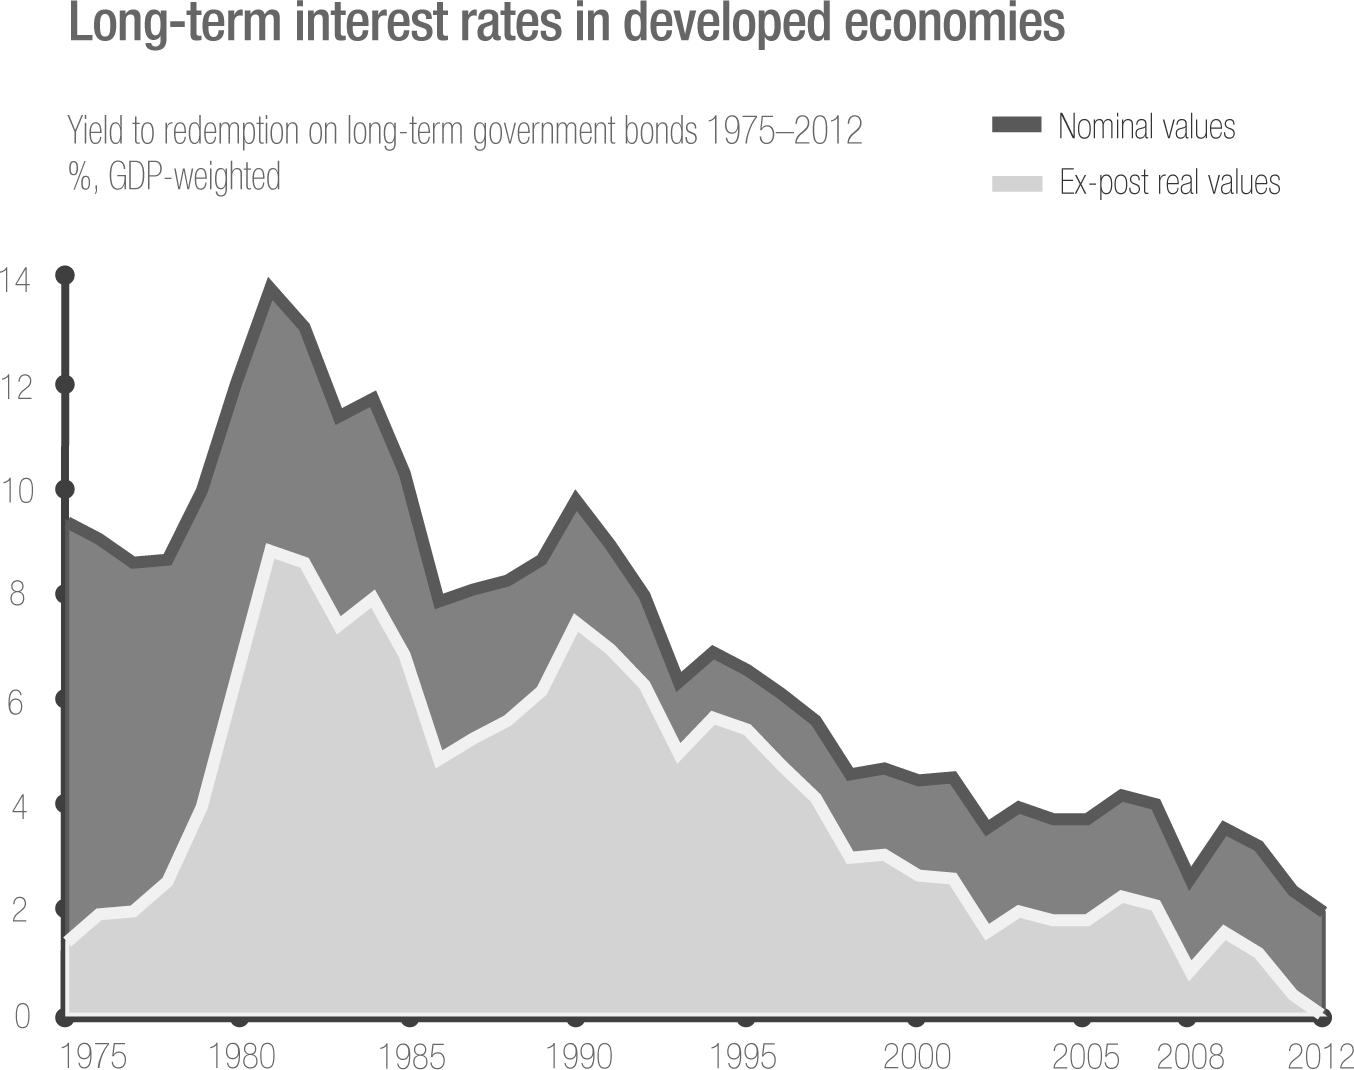
NOTE: Select advanced economies.
SOURCE: International Monetary Fund, McKinsey Global Institute analysis
However, the unconventional monetary policy of recent years has taken us into uncharted territory and may have laid the foundations for a different, less easily comprehended world. It is one in which central banks and governments are always ready to step in and inject sufficient liquidity into the economy to keep it growing and keep interest rates low. Governments, of course, have been among the chief beneficiaries of these low rates. It is a world of fragile equilibriums, where periods of aggressive expansion of money supply may be followed by asset bubbles, inflationary challenges, and booms and busts of currencies. An increasing number of countries are exploring this new territory. In fact, we may be on the brink of transition into a world where expansive monetary policy and debt monetization—once considered taboo—become normal components of the central banks’ repertoire. This version of the future could change the capital markets as we know them today and present us with a new set of challenges.
The power and fickleness of financial flows adds a further complicating factor. Global capital may be liquid, but it isn’t distributed evenly. Some areas wither and suffer from a lack of capital, while others are flooded by it—with the same strange results. Consider two postmodern ghost towns. Detroit, the once-mighty industrial motor of the American Midwest, filed for municipal bankruptcy in 2012 and now finds it difficult to get financing for infrastructure on any terms. And so the vast city depopulates, with buildings falling into disrepair and weeds growing on residential blocks. Meanwhile, on the other side of the planet, Ordos, in Inner Mongolia, has attracted a surfeit of capital. The city, in the heart of a wealthy coalmining region, has seen explosive growth in construction in the Kangbashi district—massive apartment blocks, parks, architecturally bold public edifices, two statues of humongous horses rearing up against each other. All that’s missing are the projected one million people who would occupy this area. We can’t always rely on the market to deliver capital precisely where and when it is needed in precisely the right amount.
SCENARIO 1: HIGHER COST OF CAPITAL
The demand-side fundamentals paint a clear long-term picture. The global investment rate—global investment as a percentage of total global GDP—currently stands at just under 22 percent, up from the trough of 20.9 percent in 2009, at the depth of the global recession.17 There is every reason to think that the rate of investment will continue to rise, with industrialization and urbanization of emerging economies fueling the boom.
Brazil, Indonesia, India, and China need a lot of bricks and mortar. The world’s growing cities will need to double their stock of physical capital investment from nearly $10 trillion in 2013 to more than $20 trillion by 2025.18 All the people moving to cities will need apartments to live in, roads to drive on, and schools to attend. Take Brazil’s infrastructure as an example. Overall investment fell from 5.4 percent of GDP per year in the 1970s to only 2.1 percent in the 2000s. The limits of the country’s infrastructure were on stark display during the 2014 World Cup, when rains flooded the sewers and streets of Recife. Brazil’s transport infrastructure is decrepit—86 percent of roads remain unpaved. Compared to the United States, Brazil’s rail network is less than 13 percent of the size, with about 90 percent of its landmass.19 Even though it crashed out of the 2014 World Cup, losing to Germany in the semifinals, Brazil’s soccer team retains a top ten FIFA ranking. But when it comes to quality of infrastructure, the World Economic Forum ranked Brazil 114th out of 148 countries.20 To achieve its full economic growth potential, Brazil clearly needs to start investing in its roads, ports, and airports.21
Meanwhile, advanced economies around the world have pent-up demand for new infrastructure after decades of underinvestment. In developed countries, investment as a share of GDP has declined sharply since the 1970s. Between 1980 and 2008, total investment was $20 trillion less than it would have been if countries had maintained historical rates of investment.22 That’s roughly equivalent to the combined GDP of Japan and the United States.23 The Acela, a high-speed train that connects Boston with Washington, is often slow, unreliable, and plagued by pokey Internet access. To eliminate current service deficiencies and expand capacity to keep pace with the growing demand, the American Society of Civil Engineers estimates that the United States needs to invest $1.6 trillion in infrastructure by 2020, on top of current levels.24 The US Department of Transportation has estimated that spending on public transit will have to increase by approximately 40 percent per year to bring it to a state of “good repair” by 2028.
Overall, we calculate that through 2030, the world needs to spend an estimated $57 trillion to $67 trillion on roads, buildings, rails, telecoms, ports, and water just to enable expected economic growth.25 That’s more than the entire worldwide stock of infrastructure on the ground today—and nearly 60 percent more than the world invested between 1994 and 2012.26 These investments, combined with the need to replace depreciated or outdated capital, will drive global total investment to $25 trillion by 2030 from $13 trillion in 2008, the peak before the financial crisis.27
Clearly, demand for capital is rising. What about the supply? Here, too, the potential exists for famine after years of strong harvests. In the absence of unconventional monetary policies, the long-term supply outlook is unlikely to mirror the reality of the past two decades. As the world continues to age, household savings will decline, causing a de-accumulation of assets. Age-related government spending is forecasted to increase by 4 to 5 percentage points as a percentage of GDP by 2030, further straining budget deficits and national saving levels.28 Finally, emerging economies like China and India, the first- and sixth-ranked savers by total volume, may see savings rates decline as their economies rebalance toward consumption.29
Global investment will likely reach new postwar highs over the next decade, driven by emerging markets
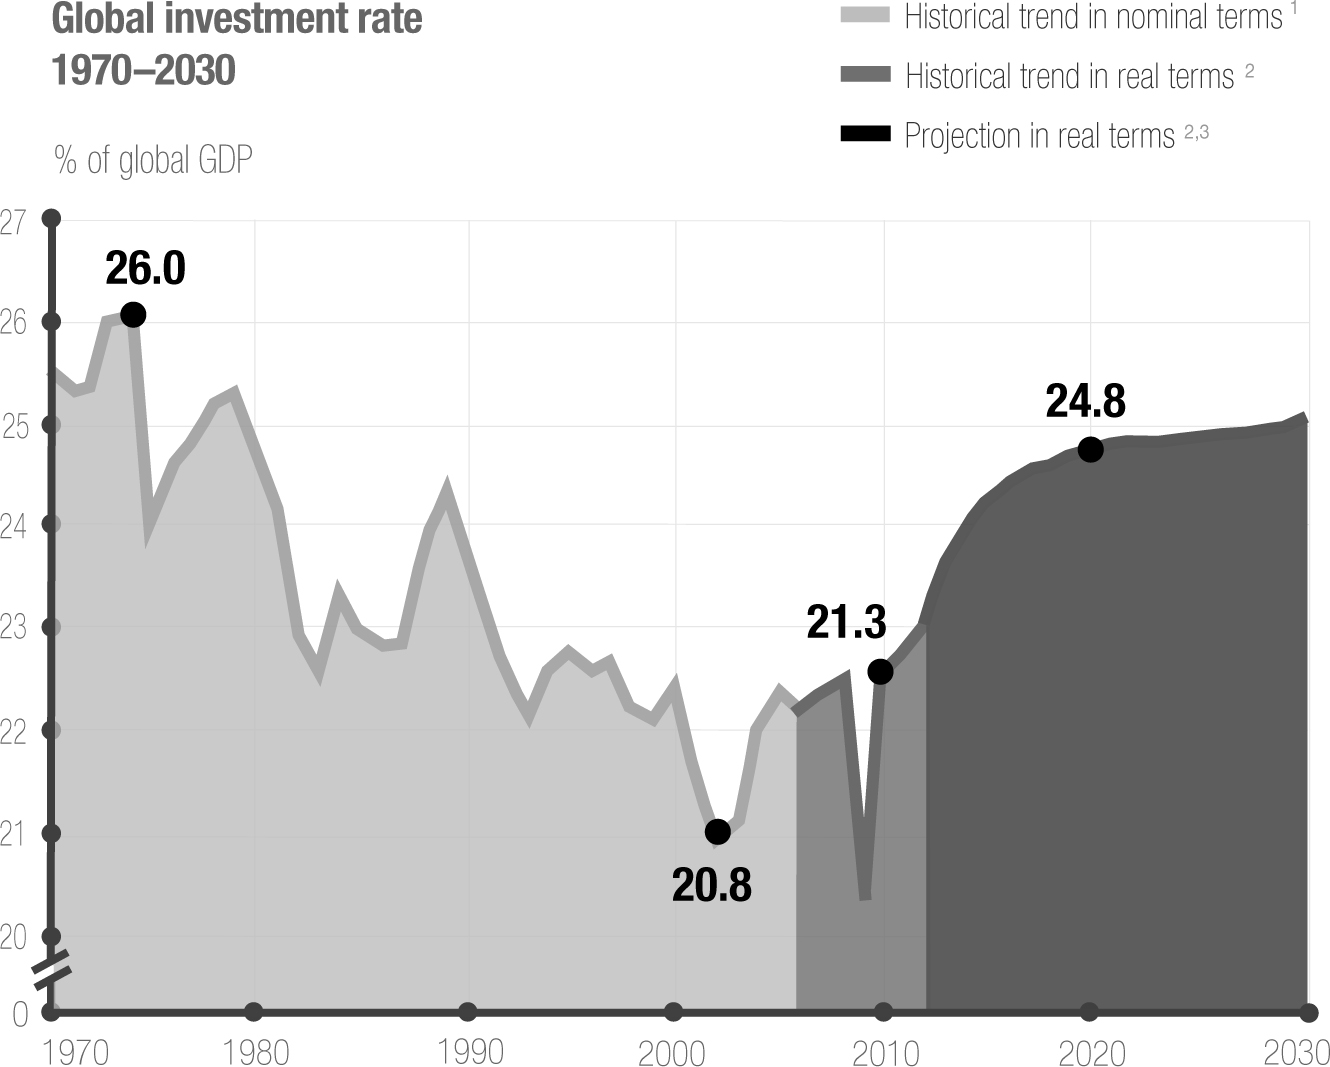
1 Based on actual prices and exchange rates of each year.
2 Shown in 2005 prices and exchange rates.
3 Forecast assumes price of capital goods increases at same rate as other goods and assumes no change in inventory.
SOURCE: Economist Intelligence Unit; Global Insight; McKinsey Global Economic Growth Database; Oxford Economics; World Development Indicators of the World Bank; McKinsey Global Institute analysis
One of the few phenomena more impressive than China’s rise as an economic power has been its impressive propensity to save. The country has a relatively undeveloped safety net, and many Chinese live with fresh memories of the deprivation and desperate poverty of the 1960s and 1970s. This is one of the reasons that the Chinese people are world-champion savers, choosing to stow away their capital instead of spending it. China’s savings rate rose from 37 percent of GDP in the early 2000s to more than 50 percent by 2008.30 That year, annual savings totaled $2.4 trillion and made China the world’s largest piggy bank.31 Four years later, though the savings rate had not risen any further, rapid economic growth had pushed the total amount of savings still higher.
But China’s savings rate seems unlikely to remain so high in the future. The government is trying to engineer a move away from relying on investment to relying more on consumption. It is encouraging citizens to spend a little more and save a little less. Should China follow the path of other Asian economies, such as Japan, South Korea, and Taiwan, its high savings rate could decline significantly. Taiwan’s savings rate, for instance, dropped by 7 percentage points between 1995 and 2008 following efforts to improve public health-care and pension systems.32
As China’s savings rate declines, the saving rates in advanced economies are likely to continue to disappoint. The rates in countries such as the United States, Australia, and the United Kingdom rose after the global recession. In the United States, for example, the personal savings rate jumped from 3 percent in 2007 to 6.1 percent in 2009, before trending downward again. But savings levels are still relatively low. And even if the current rate increases in advanced economies were to persist for twenty years, that would add only 1 percentage point to the global savings rate in 2030.33
By 2030, the supply and demand imbalances will lead to a $2.4-trillion tension between available global savings and the level of desired investments.34 In the traditional macroeconomic view, such a gap between the world’s desire to invest and the world’s willingness to save will exert upward pressure on real interest rates and crowd out investment. That, in turn, could cause global GDP growth to slow down, unless it is offset by robust gains in capital productivity.
SCENARIO 2: A MORE VOLATILE SYSTEM
A challenge to the expected scenario of rising rates exists. In recent years, the world’s central banks, led by the US Federal Reserve, have shown an increasing willingness to take interest rates into uncharted territory and to print money at an unprecedented rate. The ultraloose monetary policies triggered by the recession, the global financial crisis, and the slow recovery show no signs of being temporary. Since the start of the crisis, the central banks of the United States, the United Kingdom, the Eurozone, and Japan have injected more than $5 trillion of liquidity into their economies.35 These actions no doubt prevented a catastrophic scenario from unfolding, but they also pushed interest rates to depths that have remained largely unexplored. And because rates have been held at such low levels for so long, they have helped created new habits that may be hard to shake. Governments across the globe became reliant on low interest rates to finance deficit spending and stimulus. For example, the combined deficits of countries around the world peaked at nearly $4 trillion in 2009.36 But low interest rates held interest costs in check. Between fiscal year 2008 and fiscal year 2012, for example, the US government’s net interest bill fell from $253 billion to $220 billion, a decline of 13 percent, even as the total gross federal debt outstanding grew 67 percent.37
Historically, expansive monetary policy has been a temporary measure deployed to boost consumer expenditure and corporate investments at times of slow growth. Most analysts agree that the central banks’ efforts at quantitative easing over the past five years have boosted global aggregate GDP by 1 to 3 percent.38 However, precisely how the central banks achieved this remains a point of debate. The impact of ultralow rates on consumer expenditure and corporate investment isn’t clear. In the United States, for example, the personal savings rate in 2013 was 5 percentage points higher than the precrisis level, while the rate of business investment remains at its lowest levels since the end of World War II.39 Did lower rates stimulate GDP growth? Rather, it appears that sharply higher government spending and a comparatively quick housing sector recovery were the main factors propelling growth. Between 2007 and 2012, the governments of the United States, the United Kingdom, and the Eurozone collectively saved nearly $1.4 trillion on lower interest payments on their debt, which allowed them to spend more.40 Ultralow interest rates also helped the housing sector recover more quickly than anticipated.
In Japan, ultralow interest rates are nothing new. As the private sector deleveraged aggressively after the 1980s credit boom, the government ran large fiscal deficits to offset depressed demand and activity. At the same time, the central bank kept interest rates low and generally expanded its balance sheet. After two decades of low growth and continued debt monetization, Japan’s annual fiscal deficit peaked in 2011 at just under 10 percent of GDP; the country’s gross public debt is above 240 percent of GDP.41 This level of debt has been sustainable because most Japanese debt is owned domestically.42 However, Japan’s demographic outlook means that the country is unlikely to be able to repay the debt traditionally, and it might need to monetize its government debt over the coming years. That is to say, the central bank will create new money in order to purchase the debt issued by the government.
Japan may not be alone. As governments struggle to find a way to deleverage in the face of increasing age-related spending and fragile growth rates, unconventional monetary policies such as quantitative easing and even permanent debt monetization may become less of a taboo among central banks and policy makers. In this new macroeconomic territory, a traditional view of supply and demand fundamentals may no longer be a sufficient indicator for the future cost of capital. As illustrated by the European Central Bank’s move in the spring of 2014 to lower its benchmark deposit interest rate below zero, ultralow interest rates may remain the norm over the coming years.43 As economists Carmen Reinhart and Kenneth Rogoff argued in a 2013 IMF paper, policy makers need to guard against overplaying the risks related to unconventional monetary support and limiting central banks’ room for policy maneuvering.44
HOW TO ADAPT
As demand-supply dynamics change, business leaders need to be prepared to navigate both worlds. We have seen too many companies, households, and governments caught out by unexpected changes in the cost of capital.
Regardless of which scenario unfolds, you need to reset your intuition and develop more proactive and responsible ways of managing capital. Given the level of uncertainty over long-term capital costs, we’ve focused on five actions that will help companies emerge healthier, regardless of which scenario unfolds.
Double Down on Capital Productivity
With physical resources, it makes sense to focus on efficiency and productivity, regardless of market prices. The same holds with capital resources. You can create a better hedge for the future by improving capital productivity (the rate at which fixed capital generates output and returns). It can be done by defining explicit strategies for capital allocation, focusing on timely and efficient project delivery, reengineering products and processes, and adapting procurement, sourcing, and working capital terms.
Nowhere will the pressure to improve productivity be felt more than in capital-intensive industries such as mining, oil and gas, and real estate. Our analysis of more than 40 recent megaprojects (exceeding $1 billion in original capital expenditure investments) shows that over 80 percent wound up costing more than anticipated. On average, the capital ultimately invested was more than 40 percent higher than the original plan contemplated.45 In recent examples, Gorgon, the huge Australian liquefied natural gas plant, and the mammoth Kashagan oilfield in Kazakhstan have proven to be huge headaches for their developers, with cost estimates for the latter rising to five times the originally budgeted amount.46 If interest rates stay constant, cost overruns can quickly gobble up potential returns.
Should interest rates rise, overruns can prove fatal. Based on our experience across sectors, a combination of project reprioritization, shortening of project life cycles, and tight project execution can deliver as much as a 10 to 25 percent reduction in spending and a 20 to 50 percent reduction in delays.47 A real estate company in the Middle East, for example, reduced cycle time by 30 percent for a $500 million tower project by taking advantage of lean management techniques—such as performance dialogues and war rooms—and prefabricating forms for beams and construction joints. These efforts allowed it to avoid $50 million in penalties for time overruns, while reducing the overall cost.48
When money becomes more expensive, not tying it up unnecessarily becomes more crucial. The just-in-time delivery processes pioneered by Asian manufacturers were, at root, efforts to avoid tying up capital unnecessarily in parts and supplies that would sit idle on factory floors. Today, Japanese and Korean automakers are increasingly adopting a “capital-light” approach to product design and processes. Already, product derivatives and capacity buildup in new markets account for 90 percent of capital expenditures by the typical carmaker. In the future, the demand for capital expenditures is likely to become even more important because of changes in the external environment. The fragmentation of customer demand is leading to a 30 to 50 percent increase in the number of new car models, particularly those that require local adaptation.49 Innovation in PowerTrain Technologies is driving new R&D investments as well as spending for next-generation engine plants. Regulatory requirements for fuel efficiency are fostering the development of new technologies and materials (such as composites and aluminum) and driving new capital expenditures for plant and tooling upgrades. Competition sharpens these trends. In the five-year period ending in 2012, Asian carmakers reported a ratio of capital expenditures to revenue that was 30 percent lower than that of their European counterparts.50
Many companies can also seek to optimize their working capital productivity by adapting collection terms or cutting inventory. Take Tesla as an example. By requiring customers to pay $2,500 to $5,000 to make a reservation for purchase, the electric car manufacturer not only obtains a clearer view of the demand pipeline but minimizes the working capital necessary to run its operations.51 In effect, Tesla has managed to get its customers to provide its working capital. In December 2013, Tesla held customer deposits in excess of $160 million.52 Amazon, as another example, keeps only the fastest-moving items in stock in all of its distribution centers, carefully using advanced technology to pick the right items and stock levels. Taking immediate payments from customers and paying its suppliers with a month delay, Amazon operates with negative working capital. In the fourth quarter of 2013, Amazon reported accounts receivable of $4.77 billion and accounts payable of $15.133 billion, giving it a “float” of more than $10 billion of extremely cheap capital.53 If the top 10 global retailers had Amazon’s cash conversion cycle, they would collectively save over $150 billion in working capital.54
Tap into New Sources of Capital
Working on capital productivity enables you to make the most of the internal resources of your business, as does making the most of the widening array of external capital resources. Traditionally, getting access to capital meant having a good credit rating and nurturing relationships with major financial institutions in financial hubs such as London, Tokyo, and New York. Now, however, it means tapping into other large pools of capital, such as sovereign wealth funds (SWFs) and pension funds, and using digital platforms for peer-to-peer lending and funding crowd sourcing.
Given that the bulk of the increased demand for capital will be for long-term project financing in sectors such as infrastructure and real estate, executives and leaders will increasingly need to seek out pools of patient capital. Investors, such as pensions and sovereign wealth funds, could supply such capital. In doing so, they could capture higher profits than they could investing in government bonds, while maintaining hedges against inflation. Across all investor classes, SWFs have shown the fastest increase, with 10 percent annual growth and assets under management estimated at $3 trillion to $5 trillion in 2013.55 The pension funds landscape is much larger, with roughly $32 trillion in assets under management in 2013, and more mature as well.56 The growth outlook remains strong, driven by emerging economies and expected rises in interest rates.
Some entities, like Saudi Arabia’s SWF, have kept a conservative profile, with the majority of their assets in secure government bonds and equities. Others, however, have embarked on surprisingly aggressive investment strategies. Many SWFs have participated in high-profile trophy deals in areas such as real estate, infrastructure, mining, retail, and entertainment. Two UK landmarks—the department store Harrods and the Shard, London’s tallest building—are now part of the Qatar Investment Authority portfolio.57 So, too, is the soccer team Paris Saint-Germain FC, which has acquired superstars like Sweden’s Zlatan Ibrahimović and Uruguay’s Edinson Cavani and has reemerged as one of Europe’s leading powers.58 Norway’s SWF, with more than $800 billion in assets, directed more than 60 percent of its capital into equity markets with an increasing focus on high-profile real estate.59 In 2013 alone, it bought 45 percent of Times Square Tower in New York and 47.5 percent of One Financial Center in Boston through a joint venture with MetLife.60 It is considering moving investments to assets like wind and solar plants, as well as other infrastructure investments. Some SWFs are adapting investment strategies that more closely resemble those of private equity funds than passive index funds. Temasek, a Singaporean SWF that manages over $170 billion, in 2014 invested $5.7 billion in the A. S. Watson health and beauty group. Since its foundation in 1974, Temasek’s portfolio has included everything from shares in shoemakers to a bird park.61
Digital platforms are also opening access to new sources of capital. These are often of particular interest for smaller companies that do not have access to more traditional capital sources such as public markets and bank loans. Peer-to-peer lending and fund-raising platforms such as Kiva and Kickstarter know no national borders. Kiva, a web-based platform that allows users to lend money to people around the world, has reached over 1.2 million lenders, intermediating more than $600 million in loans.62 Since its founding in 2009, Kickstarter, a crowd-sourcing platform for creative projects—from movie documentaries to board games—has coordinated $1.3 billion in pledges from more than 6.9 million people.63 Among the notable projects funded on Kickstarter was the Veronica Mars movie, a sequel to the television show, which raised $5.7 million from more than ninety thousand “backers.”64 Alipay, the payment processing company launched in China by e-commerce giant Alibaba, has a unit that provides financing to small businesses.65
Exploit New Commercial Opportunities
Companies with access to privileged sources of capital will have a clear competitive advantage. Considering that more than 70 percent of global growth—and associated new investment opportunities—will come from emerging markets, gaining exposure to these growth markets and understanding their capital restrictions and financial regulation is becoming essential for investors. Just as trade in goods and services is increasingly connecting nodes in the developing world to one another, so too is the trade in money. Companies can significantly benefit from embracing this “cosmopolitan capitalism” by seeking out new providers of capital, opening up to global markets, and adapting governance rules to international standards.
Interesting examples of cosmopolitan capitalism can be seen in both developed- and emerging-world companies. Between 2010 and 2012, India’s second-largest telecom operator, Reliance Communications, sought and received about $3 billion in loans from several Chinese banks. The interest rates it paid, as low as 5 percent for portions of the debt, were significantly below the rates Reliance would have had to pay to Indian banks.66 In 2011, private equity giant TPG reached a deal to sell 5 percent of itself to Kuwait and Singapore SWFs.67 In 2010, a group of SWFs joined the Ontario Teachers’ Pension Plan, one of Canada’s largest pension funds, to invest $1.8 billion in BTG Pactual, one of Brazil’s largest investment banks.68 Firms with large balance sheets—and cash on hand—could become new investors of capital in these sorts of partnerships.
The benefits to borrowers of persistently low interest rates are obvious: companies and governments will be able to lock in cheap long-term borrowing. Those that act quickly can benefit by refinancing when interest rates fall. But a rise in the cost of capital can create other types of opportunities. Higher interest rates will offer higher returns on investments for many companies. Another benefit is likely to be reduced pension liabilities. As interest rates increase, the expected rate of return on investment increases because the short-term increase in interest payments is outweighed by the long-term appreciation in capital. This reduces the hurdle to funding defined pension plans. For instance, when interest rates increased in 2013 in the wake of the Fed’s tapering announcement, Ford Motor Company was able to narrow its $9.7 billion pension plan funding gap by about $4 billion, dwarfing its increased interest expenses of $50 million.69 In 2013, S&P 500 companies reported a collective pension funding gap of $355 billion, the largest on record so far.70 Most of these large companies with unfunded defined benefit pension plans will see their funding gaps shrink as interest rates rise.
Retail banks can also adapt their business models to capture new opportunities. For long-term investments, banks can capitalize on existing corporate relationships and underwriting skills and can facilitate the syndication of loan deals on behalf of large institutional investors or partner with governments to create public-private lending institutions. For small and medium enterprises, banks can double down on services related to the provision of working capital or tap into the growing peer-to-peer lending space. Early moves are already taking place, with peer-to-peer lenders such as Lending Club and Funding Circle creating strategic alliances with Union Bank and Santander, respectively, to create new credit products for their customers.71 In the summer of 2014, Lending Club, which was valued at $4 billion in a private fund-raising round, filed for an initial public offering of at least $500 million.
Cope with Risk Through Flexibility
The uncertain outlook and increased prospect of volatility means companies have to be more circumspect, agile, and opportunistic when it comes to making plans about capital. They have to think about it more like other resources or inputs. Since greater risk surrounds the direction of interest rates, companies may find it necessary to rely more on hedging as a form of insurance. In industries where volatile resources are a vital input, it is common for firms to engage in financial transactions that put both a floor and a ceiling on the price they’ll have to pay. Airlines often hedge their jet fuel costs, Pepsi guards against fluctuations in the market price of sugar, and hog farmers use pork belly futures to mitigate their financial risk. Hedging may result in giving up some potential gains if prices of an input unexpectedly fall. But it also allows companies to protect themselves from being blindsided by unexpected changes, permits them to engage in rational planning, and provides peace of mind. More organizations will have to think about capital and money as an input with a potentially volatile price path—and consider ways they can hedge and control its cost.
Businesses must also be willing and able to pivot between the length of funding maturities and different sources. In May 2014, Caterpillar issued a fifty-year bond at a relatively high interest rate, while continuing to access shorter-term borrowing from banks and money markets. That same year, Électricité de France issued a one-hundred-year bond. While the rates for such ultralong-term debt are higher than short-term rates, they function as a form of near-permanent capital whose price will be fixed for several decades. Just as manufacturers are well served by diversifying and having redundancy built into supply chains, the same may hold for the supply of capital.
Change the Mind-Set
Regardless of the future direction of the cost of capital, there’s a final way in which individuals, households, and companies will need to reset their intuition. Households that are used to seeing rapid asset price increases may need to increase their savings rate to account for slower increases.
One of the best ways for companies to prepare for short-term change is to plan for long-term trends. Companies that take a short-term view of the future of capital run the risk of being caught off guard if the cost of capital changes over time. A world in which 80 percent of companies feel pressure to demonstrate strong financial performance over a period shorter than two years is of particular concern for public companies, which tend to belong to large asset owners such as pension funds.72 Outside investors and market pressures often drive publicly held companies into a “quarterly capitalism” rut. Given that companies borrow, invest, and make capital decisions over ten- and even thirty-year periods, this is problematic. Companies will need to revisit their mind-set for making investment decisions so they can create more value over the long run.
To lead these changes, asset owners will need to define long-term objectives and risk appetites more carefully and structure their portfolios accordingly. A probable consequence will be higher capital allocation in more illiquid assets that focus on long-term value creation, even if they suffer from temporary negative shocks. Singapore’s sovereign wealth fund GIC, for instance, looks at a twenty-year horizon when it focuses on opportunities in Asian emerging markets, regardless of their short-term volatility.73
Companies can also help their investors to focus on long-term horizons by providing other metrics to analyze their performances. To bolster its strategy of a combined decentralized door-to-door sales force and higher quality, Brazilian cosmetics company Natura published data such as sales force satisfaction and training hours per employee. Sports retailer Puma decided to publish an analysis of its exposure to health and safety issues through subcontractors, addressing the demand for transparency on a risky dimension of the industry.74
![]()
As we’ve noted, the significant change surrounding the price of capital now lies in the uncertainty over its near-term path. To a large degree, the global economy is still navigating a body of water that has been transformed by significant additions of liquidity. It is difficult to be certain about whether the flood will quickly subside—pushing interest rates up—or will linger. Regardless, companies can reorient their thinking, practices, and competencies in ways that will help keep their ships watertight.