6 Life, Death, and Migration in Afro-Brazilian Slave Society
The expansion of the export sector in Brazil during four centuries of its evolution was the driving force behind the forced
migration of African laborers to the shores of Brazil. Portuguese merchants made this migration possible by opening up the African Atlantic markets and organizing a slave-trading fleet. At the same time, the subsequent growth or decline of these African
slaves and their descendants in Brazil was determined by classic demographic factors, such as their birth and death rates, as well as their rates of internal migration and manumission. These are themes that will be explored in this chapter as we summarize the latest studies relating to the population history
of these several million forced migrants who arrived in Brazil in the period to 1850.
To transport these estimated 5.5 million workers shipped from Africa across the Atlantic Ocean to Brazil, there emerged a
sophisticated and complex system of the purchase of African slaves with goods demanded by the African markets, which in turn linked the economies of Asia, America, and Europe to the evolving market economy in Africa. There is little question that Brazil was the single most important arrival place for African slaves in America. Of the estimated
10.7 million Africans who safely crossed the Atlantic from the late fifteenth century until the late nineteenth century, an
estimated 4.8 million survived the crossing and landed in Brazil.1 The intensity of this forced migration of African
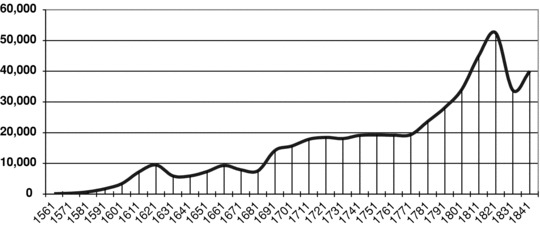
GRAPH 6.1. Estimated average annual slave arrivals to all Brazilian ports, 1651–1850, by decade.
Source: Data accessed in August 18, 2008; http://www.slavevoyages.org/tast/assessment/estimates.
slaves was highly correlated with the growth of Brazilian exports and the expansion of the local economy. Just as the largest expansion
of Brazilian production occurred in the late eighteenth and nineteenth centuries, so too the most important period of this
four-century slave trade was in the late eighteenth and nineteenth centuries (see Graph 6.1).
There were also significant shifts in the relative importance of receiving regions within Brazil. In the sixteenth and seventeenth
centuries, the bulk of the slaves were arriving in the ports of the Northeast, except for the period of the Dutch occupation
of Pernambuco. By the late eighteenth century, however, the southeastern port of Rio de Janeiro had achieved dominance and would continue to outdistance its northeastern rivals for the entire nineteenth century (see Graph 6.2). By the mid-eighteenth
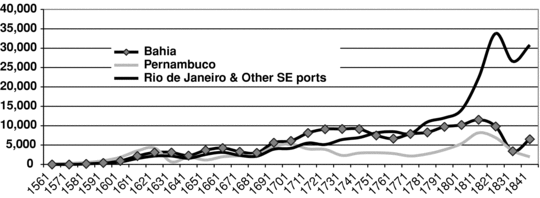
GRAPH 6.2. Average annual estimated slave arrivals by decade in the principal ports of Brazil, 1561–1851.
Source: Data accessed August 18, 2008; http://www.slavevoyages.org/tast/assessment/estimates.
century, Rio de Janeiro had become the single most important arrival point for Africans in Brazil and accounted for 43 percent of all immigrating
African slaves, and it took in more than half of all slaves by the first decade of the nineteenth century. By the 1820s, its
share rose to three-quarters of all the slave arrivals and to four-fifths of all slaves by the 1830s and 1840s. Clearly, just
as the economic center of Brazil had slowly shifted southward during the course of the colonial period, so too had the arriving
Africans followed the economic and political changes in the colony and empire.
Overall, the three dominant regions for the origin of African slaves to Brazil were the regions of Angola-Loanda (Central
Africa), the Bight of Benin (Western Africa), and the East African region of Mozambique. Although their participation varied by time, overall these three regions accounted
for an estimated 94 percent of all Africans shipped to Brazil (see Graph 6.3).2
What is interesting to note is that these regions of origin were quite distinct from those from which mainland North America
drew its African slaves. Although a much smaller trade, the majority of Africans arriving in mainland North America came from
Western Africa, and most especially the Senegambia region, which was the single most important center for this northern Atlantic
trade (see Graph 6.4).
Although Brazilian slaves came mainly from southwestern ports, not all receiving ports obtained their slaves from the same
African sources.
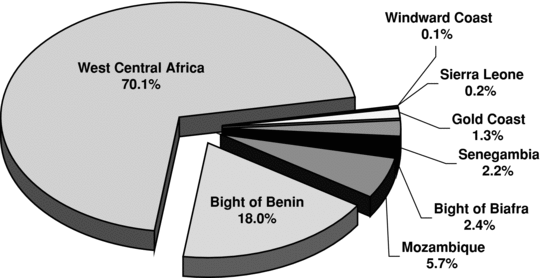
GRAPH 6.3. Estimated African regional origins of slaves shipped to Brazil, 1561–1850 (5,479,583 persons).
Even for given Brazilian ports, the origins of slaves differed over time. Although a great deal of information on given slave
voyages is missing (especially for the port of Rio de Janeiro), the latest estimates suggest that the migration to Rio de Janeiro was dominated by slaves arriving from the Congo-Angola
area, and the same would appear to be the case for Pernambuco. Bahia, however, was much more tied to the Bight of Benin area than any of the other ports, a pattern that persisted during all
the major time periods of the slave trade (see Table 6.1). Interior zones such as Minas Gerais showed a more mixed pattern of African arrivals because they obtained slaves from both
Rio de Janeiro and Bahia. Thus,
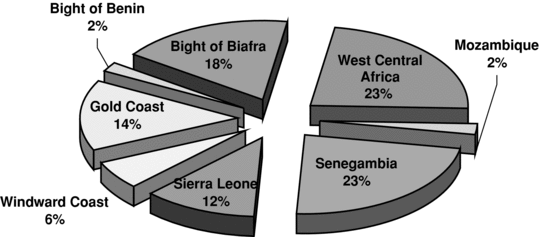
GRAPH 6.4. Estimated origin of African slaves shipped to North America, 1581–1808 (452,651).
TABLE 6.1. Estimate of Ratio of African Slaves Arriving in Major Brazilian Ports for the 4.6 Million Whose African Region of Departure Is Known, 1581–1850

Note: This table is only a partial reconstruction of the slave arrivals to Brazil and is missing numerous voyages and contains
more estimated numbers than actual registered data.
Source: New Emory estimated data set, accessed September 11, 2008.
studies of early eighteenth-century Minas show a very high participation of African slaves from the Bight of Benin region.
Thus, the north/south dichotomy of Brazil aligned with a West-Central Western African origin does not completely hold, as there was a far more mixed origin of slaves in central Brazil.3
The Bahia-Benin connection was unusually close and involved the movement of peoples, goods, and even ideas across the South Atlantic. The Portuguese initially had opened up this area and constructed their factory and fort at El Mina. When the Dutch seized this region in the first half of the seventeenth century, there was a temporary redirection of trade to the other
areas. But the growth of an intimate trade between Africa and northeastern Brazil prior to the Dutch takeover meant that this connection could not be completely severed by the Dutch. African demand for Bahian
tobacco was so strong that eventually the Dutch were forced to compromise and allow the old trade to continue. Also, with the opening
up of the mineiro gold fields, Brazilian and Portuguese traders were able to further penetrate the Benin region through their purchase of slaves
with gold from America. This special relationship between these two regions grew so powerful and existed for such a long time that the Northeast
of Brazil was probably the most concentrated area for Ghanaian and Nigerian cultures in America. So close and recent was the
relation that even in the postemancipation period there was a steady return of Afro-Brazilians either to settle in these regions
of the Bight of Benin or were visitors who came to re-enforce African-based religious belief systems that were developing
in late nineteenth-century Brazil.4
The slave trade from Africa began at a relatively slow pace, and enslaved humans were just one of the major commodities exported
by Africa to Europe and America in the first two and a half centuries of Atlantic contact. In fact, it was not until the early
eighteenth century that slaves became Africa's largest “export.”5 It was the Portuguese who opened up the Atlantic coast of Africa for international trade, and gold and ivory were more important to early traders than slaves. Gradually this changed as Brazil developed as a major slave plantation
economy. Although the Portuguese worked in all coasts, the majority of Brazil's slaves – an estimated 71 percent – came from
the Congo-Angola region, part of which had been settled by Portuguese traders in the sixteenth century. The nineteenth century saw a major new development
of the trade to Brazil as the ports of Mozambique were finally opened up to Portuguese slave traders. Although trading was intense from this new region, especially in the
late 1830s, the ports of Mozambique still accounted for only a small share of total slave arrivals into Brazil. An estimated
85 percent of these Mozambique slaves went to Rio de Janeiro, but even in this port, they made up just an estimated 17 percent of the African slave arrivals in the nineteenth century.
Thus, the Biafran and West-Central African regions together remained the prime areas of the trade at the end, with only some 6 percent of all the slaves shipped to Brazil in the nineteenth century coming from East African
sources (see Table 6.1).
Unlike most of the slave trades, the trade to Brazil was an exclusive monopoly of Portuguese and Brazilian slave traders from the very beginning and remained so until its end in 1850. Portuguese and Brazilian traders also played a role in the
early Spanish American slave trade and were significant players in the Cuban slave trade of the late nineteenth century.6 Moreover, despite the traditional Anglo-Saxon bias against the Portuguese, which is reflected in the historical literature,7 there was no major difference between the Portuguese slavers and all other European slave traders in their shipping and handling
of Africans. No matter what the nationality of the traders, almost all participants carried slaves in a comparable manner, especially
by the eighteenth century. All Europeans transported approximately the same number of Africans per ship in roughly the same
size vessels and crossed the Atlantic in approximately the same amount of time. They housed and fed their slaves in the same
manner, and, despite the usual disclaimers and prejudices, they treated their slaves with the same amount of cruelty and care.
They experienced roughly the same rates of success and failure in carrying slaves across the Atlantic, and no one nation had
a mortality record systematically lower than any other.8
Although the British may have introduced surgeons earlier than other nations, this had little measurable impact on African mortality or the incidence of diseases aboard ship. The general improvement in European knowledge about diet and the use
of crude vaccinations against smallpox pervaded all the slave-trading nations by the second half of the eighteenth century,
a fact that seems to account for the uniform drop in average mortality figures from approximately 20 percent in the pre-1700
period to some 5 to 8 percent by the end of the eighteenth century and beginning of the nineteenth century.9
It should be stressed that although mortality rates were dropping from the sixteenth century until the beginning of the nineteenth century, they were still extremely high and
would have been considered of epidemic proportions had they occurred to a similarly aged population that had not been transported.
Equally, these rates were high even in terms of the shipping of other persons in this period. Slaves had, on average, half
the amount of room afforded convicts, emigrants, or soldiers transported in the same period, and they obviously had the most
rudimentary sanitary facilities. Although the mortality suffered by these other lower-class groups was sometimes as high as the Africans’, their rates eventually dropped to less than 1 percent in the late eighteenth and early nineteenth centuries, a low mortality
level never achieved by the slavers.10 Even a rate of 5 percent for a two- to three-month period for healthy young adults in the late eighteenth century – the best
rate achieved by the slave traders – was very high. Such a rate in a contemporaneous nonmigrating European peasant population
would have been considered of epidemic proportions; even more so because all those who were carried in the trade were healthy
and in prime physical condition. Although the European traders carried out every possible health and sanitary procedure they
knew about, most of these were of little utility, because the typical manner of carrying three hundred slaves on a 200-ton vessel guaranteed a disease environment from which few escaped unscathed.
Although time at sea was not usually correlated with mortality, there were some routes in which time was a factor. Simply
because they were a third longer than any other route, the East African slave trade from Mozambique, which developed in the late eighteenth and nineteenth centuries, was noted for overall higher mortality than the West African
routes, even though mortality per day at sea was the same or lower than on the shorter routes. Also, the simple crowding together
of slaves from all types of different epidemiological zones in Africa guaranteed the transmission of a host of local endemic
diseases to all those who were carried aboard. Finally, many of the sicker slaves died soon after their arrival in Brazil.
It has been estimated for 1825 and 1828 that a death rate for arriving slaves varied from 2.3 percent to 4 percent of the total arriving in the port of Rio de Janeiro in these years.11 Although any mortality that occurred on trips from the interior from the coastal ports is unknown, it was probably quite low. Many newly arrived slaves
(novos – slaves who were unbaptized and did not speak Portuguese) were quickly moved from the port of Rio de Janeiro along with ladino slaves (those already residing in the country and speaking Portuguese) via mule trains in fairly large groups. A recent study
has suggested an average of over 18,000 slaves per annum in the 1824–1830 period left the port for the interior parts of the
provinces of Minas Gerais, Rio de Janeiro, and São Paulo, and this on average represented about half of the Africans who had just arrived in port.12
Although the markup of American slave prices was high relative to prices paid in Africa, the African sellers of slaves controlled the supply conditions and demanded high-cost
goods for their slaves. The single largest item of European imports that paid for slaves were textiles, and these mostly came from the looms of India. In the case of the Portuguese trade, this involved shipments directly from India to Africa to pay for slaves, as well as the shipment of Brazilian-made guns, gunpowder, aguardente (brandy made from sugar cane, or cachaça), tobacco, and even gold dust as goods used to purchase slaves. All of these items, along with bar iron, added up to a considerable cost for the Europeans, and even when
they used cowry shells and/or other African monetary items, these in turn had to be paid for by European goods that in turn
were paid for with gold and silver.13
Unlike many of the major trades, there were no triangular voyage routes between Europe, Africa, and America.14 The Portuguese/Brazilian trade never involved Portugal directly. It was Brazilian-originated ships that transported Brazilian goods to Africa, and they returned directly to Brazilian
ports with the slaves. It was Portuguese ships that brought Asian goods to Africa to purchase slaves. Although Portuguese merchant capital was
involved in all aspects of the trade, along with increasing participation of Brazilian capital, no slave ship ever returned to Portugal. Also, because the Portuguese were resident in both Mozambique and Angola, they were probably able to purchase African slaves a bit more promptly than the usual boat trading system used by the majority
of Europeans. Also, Asian goods used to purchase African slaves, instead of being brought by the Brazilian traders, were usually
brought directly from Asia to the African settlements, whereas the Brazilian ships concentrated on such Brazilian-produced
goods as liquor, gunpowder, tobacco, and gold, which also were used to purchase slaves.15
Although planters often proclaimed their desires for a specific nationality or group of Africans, it is now evident that they took what they could get, and this depended exclusively on African conditions. All studies from
all trades show that the Europeans, except for the Portuguese in Angola and Mozambique, had little idea of the nature of the societies they were dealing with. In most cases, Africans
were simply designated by the ports that they were shipped from rather than by any truly generic ethnic or national identity.
On a few occasions, such as the collapse of a large state or after a major military defeat, whole nations of well-defined
and clearly delineated groups entered the slave trade and were known by their proper names in America. But this was the exception rather than the rule. While Europeans fought among themselves
to protect a special section of the western African coastline, interlopers from other European and African groups went out
of their way to guarantee that no monopolies were created. Although the Portuguese controlled Benguela and Luanda, for example, the French and English were getting their slaves from the same inland areas by landing further north along the Loango-Congolese coast. Attempts by any one African group to monopolize local trade often led to the opening up by their competitors of new trading
routes.
Not only was the origin of all slaves largely determined by African supply conditions, but such conditions also determined
the sex of the departing Africans. It has been estimated that 65 percent of all migrating Africans were males.16 Although there was a price differential between males and females in America, this was insufficient to explain the almost two-thirds majority of males among the arriving slaves. Women performed almost
all the same manual tasks as men on the plantations of America and, in fact, made up the majority of most field gangs in sugar,
coffee, and cotton. African women, both free and slave, were in high demand locally, and it was this counterdemand from African markets that explains why fewer women entered the Atlantic slave trade. In some African societies, women were highly valued because they were the means of acquiring status, kinship, and family.
One of the distinguishing features of western African societies was their emphasis on matrilineal and matrilocal kinship systems.
Because even female slaves could be significant links in the kinship networks, their importance in the social system was enhanced.
Also, slave women were cheaper to acquire than free local women in polygynous societies, making them more highly prized in
societies that practiced this marriage arrangement. Even more important was the widespread Western African practice of primarily
using women in agricultural labor. For all of these reasons, women had a higher price in local internal African markets than
men.17
Aside from the high incidence of males, the trade also exhibited a low incidence of children, with an average of 22 percent
of all those transported being defined in this age category.18 Although children suffered no higher mortality rates in crossing than any other groups of slaves, their low sale prices combined with their costs of transportation equal to that of adults discouraged slave captains from
purchasing them.
All of these biases in the age and sex of the migrating Africans had a direct impact on the growth and decline of the Afro-Brazilian slave populations. The low ratio of women in each arriving ship, the fact that most of these slave women were mature adults who had already spent several of their childbearing years in Africa, and the fact that relatively few
children were carried to Brazil were of fundamental importance in the subsequent history of population growth. It meant that
the African slaves who arrived in America were unable to completely replace themselves through births. The African women who
came to Brazil had lost several potential years of reproduction and were incapable of reproducing even the total numbers of
their immigrant cohort, let alone creating a generation greater than the total number who arrived from Africa. Those Brazilian
regions that experienced a heavy and constant stream of African slaves would thus find it difficult to maintain their slave
populations – let alone increase their size – without resorting to more migrants. It was only in those regions where the slave
trade died out or was no longer important before the end of slavery that the positive natural growth rates – which were the norm among the native-born or Creole slaves – could finally influence the growth of the entire resident slave population. The classic case of such a positive growth
rate was the slave population of the United States, which unqualifiedly attained the highest level of reproduction of any
slave regime in the Americas.19 But the United States was not alone. It has been suggested by recent studies that some provinces in Brazil also achieved
positive natural growth rates well before the end of the Atlantic slave trade, although none comparable to North America. Particularly singled out in this respect were the provinces of Minas Gerais,
Paraná, and Piauí in the nineteenth century.20
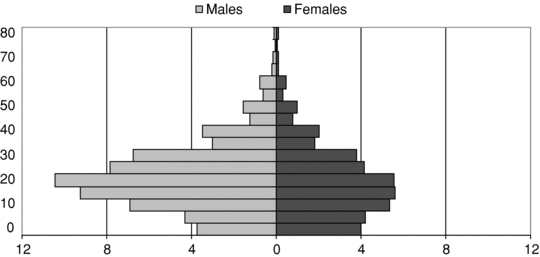
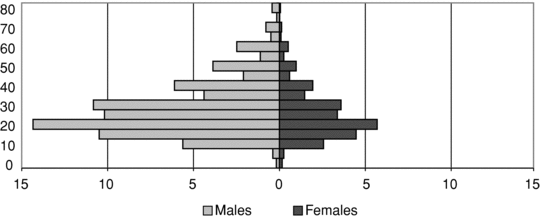
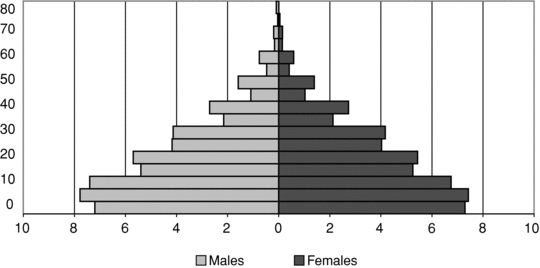
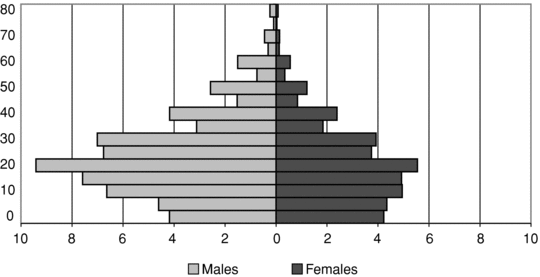
The impact of the biases in age and sex of the arriving slaves can be seen in a fairly complete sample of a large body of slaves, which we have separated by origin, in the provinces of
São Paulo in the late 1820s (see Graph 6.5a–6.5b) and Minas Gerais in the early 1830s (see Graph 6.6a–6.6b). As can be seen in the age pyramids for the African-born slaves, males predominated and the working-age males were the most
important cohorts, whereas the Creole-born slaves in both provinces showed a classic age pyramid of a pretransition population
with close to a normal distribution of men and women. The final total resident slave population in both categories profoundly
reflected the influence of the Africans and would of course have led to negative population growth rates (see Graph 6.5c and 6.6c). The sex ratio for the São Paulo slaves was on the order of 154 males per 100 females, and for Minas, the figure was almost identical at 155 males per 100 females.
This pattern of declining populations under the impact of the slave trade was perceived by contemporaries, most of whom assumed
it was related to the treatment of the slave population. Later, commentators took up this theme and a host of claims were
made for the better or worse physical treatment on the part of this or that slave regime, or one or the other type of plantation
activity or crop. Claims were made for the economic logic of planters rejecting reproduction as too costly and therefore relying
on “cheaper,” imported African adult slaves. Recent demographic analyses show, however, none of these claims hold up. In all
of the American slave regimes, the standardized birthrate among American slave women was comparable with, if not higher than, most of the contemporary European nations. Whereas the U.S. slaves in the nineteenth
century achieved very high rates of fertility by any standards – in the range of 50 births per 1,000 population – the slaves
of Brazil had
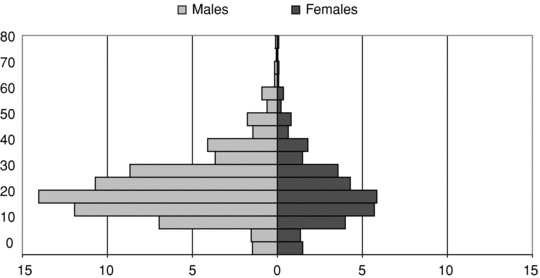

GRAPH 6.5A. Age pyramid of African-born slaves, São Paulo, 1829 (29,989).
GRAPH 6.5B. Age pyramid of native-born slaves, São Paulo, 1829 (22,554).
GRAPH 6.5C. Age pyramid of all slaves, São Paulo, 1829 (75,072).
GRAPH 6.6A. Age pyramid of African-born slaves, Minas Gerais, 1829 (55,843).
GRAPH 6.6B. Age pyramid of native-born slaves, Minas Gerais, 1829 (74,047).
GRAPH 6.6C. Age pyramid of all slaves, Minas Gerais, 1829 (129,890).
birth rates in the upper 30s and lower 40s per 1,000, which were in fact quite high by contemporary European standards.21
But these high birth rates of the slave women were insufficient to maintain local populations because of both the disproportionate number of men in the arriving African
slavers and the very high mortality rates suffered by slaves due to adult age bias of the arriving immigrants. In all American slave regimes with a heavy level of African immigrations, the sex ratio was in favor of men, and the average age of the slaves was higher than the free persons in the receiving societies. The fewer the number of women in the total population, the lower
the overall crude birth rate (births per total population) becomes, no matter how high the birth rate of the slave women in
childbearing ages. Although a crude birth rate in the range of 30 to 40 per 1,000 was high by contemporary European standards and close to
that of the free populations in Brazil, it was insufficient to maintain the slave population. As Slenes noted, “in a population like that of Vassouras in the 1820s, where 77 percent of slaves were male, a female crude birth rate of 40/1000 would have corresponded to an overall
rate of only about 18/1,000.” Thus, the sexual imbalance of the slave population due to the slave trade, he concluded, is “the main reason why deaths exceeded births in the first half of the nineteenth
century…under these circumstances, even high intrinsic fertility would result only in a moderate or low crude birth rate.”22
Slaves equally experienced very high rates of mortality. Given the age of the arriving African migrants, which largely excluded
children and youths, it was inevitable that the immigrant population would suffer a higher crude death rate due to their older age structure than native-born free or slaves. If Africans made up a sufficiently large part of the slave population, then their disproportionately higher death rates would influence
total death rates. This in fact is what occurred. Of course, for the second generation of slaves, those born in America, the mortality rates for these Creole slaves more nearly approached those of the local native-born
free populations. But slave death rates, even under the best of conditions, were invariably higher than those of the free
populations in almost all areas.
For this reason, it required crude birthrates in the upper 40s and lower 50s per 1,000 population to overcome crude death rates in the mid-40s per 1,000 range. By world standards, these were extremely high birth rates, but they were achieved in most
slave regimes of America by the native-born or Creole slave women. The decline of the total slave population in slave colonies often masked a positive growth rate among the Creole slave
contingent, and once the first-generation Africans died off and were not replaced, then it was common for local Creole slave populations to grow. This growth usually occurred
if there were not too many manumissions of young females, which in fact was the group most often manumitted, and if there was no intra-American or internal slave trade that moved younger slaves out of the local population. This latter movement in fact occurred in the Brazilian Northeast, where a major internal slave
trade after 1850 drained off the young males and females from the local populations of Bahia, Pernambuco, and other provinces, as well as from the far southern regions of Rio Grande do Sul and Santa Catarina. As a result, these regions continued to suffer declining total slave populations despite the high Creole slave birth rates
and the dying out of their African-born populations.
If no outmigration occurred, and if manumissions were kept to a low level and favored older postreproductive slaves, then
it was the case that the slave regimes of America would begin to grow once again approximately a generation after the end
of the Atlantic slave trade. Although this seems to have been the rule for most of the American slave regimes, it is true that none of them approached
the levels of growth attained by the slave population of the United States. As commentators have often pointed out, the United
States and Brazil both began the nineteenth century with a slave population of 1 million each. Brazil imported some 2 million
slaves in the nineteenth century and had a resident slave population of only 1.7 million in the late 1850s, whereas the United
States imported a few hundred thousand slaves and ended up with a resident population of 4 million slaves on the eve of the
Civil War. When one adds in the manumitted slaves and their offsprings, the difference declines greatly. There were just 4.4
million free and slave Afro-Americans in the United States at the time of the Civil War, whereas in Brazil at the time of
the first census in 1872, these two groups together numbered 5.8 million persons. This would suggest that both societies saw
their original African populations grow positively well beyond their initial slave trade numbers, though even so, the North
American Afro-American population still grew at a more rapid rate.
It has often been suggested that slave treatment in the United States was different from elsewhere in America. This has been supported by comparing vital rates of the U.S. slave population with all other American slave groups. But such an argument has serious difficulties on several grounds. To begin with, the
birth and death rates of the slaves everywhere in America reflected those of the free whites and free-colored population among whom they lived, and these rates differed between the free populations of different countries. The slave rates in Latin
America were close to those of the free populations in their respective countries, just as those rates in the United States were
close to those of the free population. The comparison is then not between slave groups across political boundaries but within
each country between its slave and free populations. All the evidence to date suggests that although Brazilian slave mortality
rates were higher than U.S. slave mortality rates, so too were the rates for whites in roughly the same proportion. This suggests that the argument that different treatment
can be shown by just comparing slave death rates across colonial and national boundaries cannot be sustained by comparing only the slave populations. The vital rates of the entire society must be examined.
Next, if treatment was that different in any given slave regime we would expect to see different patterns of fertility among women. Because female fecundity is influenced by diet and treatment, one would expect that in “good treatment” regimes the ages
of menarche and menopause would be lower in the former case and higher in the latter than in “bad treatment” regimes. But
comparing the ages of West Indian women at the beginning and end of their reproductive cycles with those for U.S. slave women shows essentially little difference. Thus, treatment was not in and of itself sufficiently different in the American slave
regimes to account for the differences in birth rates. Although this does not necessarily mean that treatment was equal in
all areas, or that some work regimes were not more oppressive than others, or that some societies were more pro-natalist than
others, it does suggest that the “treatment” question is a difficult one to answer, and that the detailed demographic reconstructions
undertaken to date give no comfort to those who would readily identify their slave histories as “better” than others.
If it was not difference in potential fecundity that explains the differences in birth rates of Creole slave women between
the United States and the other slave regimes, what then can be offered as an explanation? It has been suggested that it was
a difference in the spacing between children rather than any differences in potential years of fecundity that distinguishes the U.S. slave regime from all others. Recent studies show that North American slave women had fewer months separating the births of their first and subsequent children than did those in Latin America and the Caribbean.
Because no slave regimes practiced birth control, it was suggested that either abstinence or other factors explained these longer delays between children outside the United
States. The evidence suggests that a sharply different pattern of breast-feeding accounts for most of the differences in spacing. Outside the United States, the norm was for breast-feeding to last on average
two years, which was the West African norm of behavior. In the United States, the Creole slaves adopted the northern European pattern of one year of lactation. Because lactation
reduces fertility, the extra year of on-demand breast-feeding helps explain the difference in the number and spacing of children.23
Although contemporaries and later commentators have speculated endlessly about the life expectancy of slaves, it is apparent that it was not that different from the free populations in the societies in which they lived. A favorite
theme even in the nineteenth-century literature is of an average working life of seven years for a slave entering adulthood,
or arriving in America. Even adding in the relatively high mortality suffered in the first months of a new disease environment by the recently arrived Africans (the so-called “seasoning” process), such a high mortality did not occur even for Africans, let alone Creole or American-born slaves. The average life expectancy of native-born Latin American slaves was in the low 20s. This contrasts with a U.S. slave life
expectancy rate in the mid-30s. In both cases, the slave rates reflected local free population rates, with free Latin Americans having a
lower life expectancy than did free North Americans. Moreover, the spread of years in life expectancy between nonslaves and slaves was much greater in the United States than in Brazil. Thus, the life expectancy of the U.S. population in 1870 was forty-two years for men and forty-three years for women,24 whereas that of slaves resident in the United States in this same year was an estimated thirty-three years for both sexes, some ten to eleven years
less than the
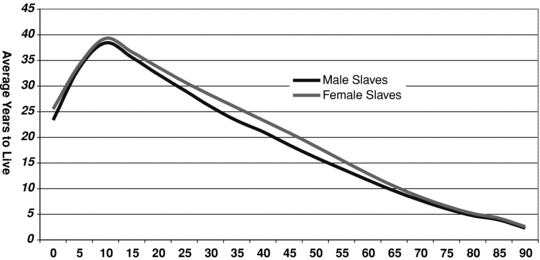
GRAPH 6.7. Estimated upper bound life expectancy of slaves (from birth and by five year cohorts).
Source: Carvalho de Mello, “The Economics of Labor in Brazilian Coffee Plantations,” p. 123.
total population.25 In Brazil in 1872, the total population had an average life expectancy of just twenty-seven years for both sexes, which was
only 3.7 years more than for male slaves in this year and just 2.3 years better than the life expectancy of female slaves.26
Saying that life expectancy for a male slave in Brazil was twenty-three years in this period (an upper bound estimate) does not mean that the average slave died at that age. It
should be remembered that infant mortality was so high in nineteenth-century Brazil that one-third of all male children born died before the age of one, and just under
half died before the age of five. For those slave male children who reached the age of one, the expectation of life was 33.6 years; for those who survived the first five years of life,
the average number of years of life remaining was 38.4 years (see Graph 6.7). Thus, a male slave who survived the extremely dangerous years of infancy and early childhood stood an excellent chance
TABLE 6.2. Life Expectancy of Brazilian Slaves and All Brazilians at Ages 0, 1, and 5 Years
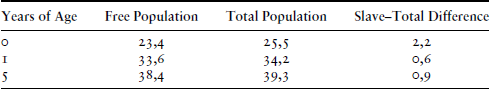
Source: Carvalho de Mello, “The Economics of Labor in Brazilian Coffee Plantations,” p. 123.
of reaching his 40s. For women slaves, the life expectancy was better. Only 27 percent died before the age of one and 43 percent before the age of five, which
meant that life expectancy for female slaves at birth was 25.5 years, with the corresponding expectations of those who survived
to one reaching 34 years and those who survived to five achieving 39 years.
Finally, the data available suggest that although slaves had a higher infant mortality rate than the total population, this difference declined significantly at ages one and five years (see Table 6.2).
Slaves who survived dysentery and other childhood diseases obviously had an average working life well over the mythical seven
years. Nevertheless, it should not be forgotten that slaves were almost exclusively a working-class population and suffered
more than their share from work-related accidents as well as all the infectious and dietary diseases from which the poorest
elements of the population suffered.27 Although their sanitation and housing in rural areas was probably better than the average subsistence free farm family, their
food consumption was probably little better than the poorest elements of the society. Therefore, in considering their exclusive
concentration in the working classes of the nation, along with their high level of work accidents and high rates of labor
participation, it is no wonder that slaves suffered the worst disease and mortality rates in their individual societies. Although
the general levels of disease and mortality in each individual American society may account for the different rates among
the slave regimes, there is little doubt that they were at the worst levels in every society in which they lived.
As the Atlantic slave trade came to an end, there was still a fairly even distribution of African slaves throughout Brazil. The new coffee zones of Rio de Janeiro were growing rapidly and absorbing ever more slaves, but the northeastern sugar zones still had a fairly significant slave
population, as did the far southern grazing economies. But the end of the Atlantic slave trade led to a secular rise in slave prices.28 In turn, this made slave labor in the more marginal economies a too-costly workforce. Slowly and steadily, slaves were replaced by a free labor force, which
was growing rapidly during this period. At the same time, attractive prices were now available for owners who were willing to sell their slaves, and thus there began a major internal slave trade. With some consistency, the older sugar and cattle regions began to see a steady decline in their slave labor force, while the coffee counties of the southeastern region began to expand their numbers.
Although an internal slave trade had always existed in Brazil, especially given the common reshipment of Africans arriving
in the major coastal ports to smaller ports or interior countries, the post-1850 trade was far more intense.29 Thus, even the seaborne interregional movement was not a new phenomenon in 1850, and a steady, widespread, interprovincial trade had gone on while the Atlantic slave trade was at its height. Also an important part of the internal trade, both before and
after 1850, was quite local, involving the land transfer of slaves within provincial borders or between contiguous provinces, as recent studies have suggested. As expected, the slaves being sold in the local markets of São Paulo in the 1860s to the 1880s were primarily of the ages fifteen to twenty-four; and in most cases males predominated, although
in some markets almost as many young women were sold as young men.30 The majority of slaves being sold in individual municípios came from other regions of the province, and only a minority came from northern provinces of the empire, with the majority
of these northern slaves coming in the 1876–1880 period. It has been suggested that an agricultural crisis in the northeastern
region in 1877–1879 was an especially active period, with specialized traders purchasing local slaves for sale outside the
province.31 Moreover, it appears that prices of slaves in the Northeast were considerably below that of prices in the southeastern region,
which made such a trade profitable.32 Nevertheless, the general sense of all these sales of slaves in local markets is that local, regional, and intraprovincial
sales were more important than interprovincial ones, even in the period prior to the early 1880s.33
Although the slave trade from northern ports still had some elements of an intraregional trade as it had existed in the pre-1850 period, these ports now were primarily
shipping local and regional slaves to the south-central ports supplying the coffee zones of Brazil. The same was occurring in this period in the far southern
ports of the empire as well. The principal destinations for these coastal traders were Rio de Janeiro and Santos, the former being the more important. In 1852, for example, Rio de Janeiro was reported to have imported more than 4,400
slaves, and its average per annum importation for the years 1852–1859 was estimated at 3,327.34 Although no figures are available this early for Santos, its annual importation of slaves more than a decade later was in
the 1,000 to 2,000 range. Thus in 1867, 904 slaves were imported, 1,229 arrived in 1868, and 2,129 in 1869.35 Considering that these were the primary ports of entry for slaves transported by sea, importation may have reached as high as 5,000 to 6,000 per annum in these two decades.
One contemporary Brazilian authority, in fact, estimated in 1860 that in the 1850s, some 5,500 slaves were annually being
exported to the central states from the North alone.36 Eventually, the drain on the local labor force led the “exporting” states to tax the trade in order to slow its volume, and
they and the imperial government eventually killed the trade as an important source of slaves by the early 1880s.37
Nevertheless, even when this interprovincial movement was functioning, the overwhelming majority of the Creole slaves in the major importing provinces (Rio de Janeiro and São Paulo) of the southeastern region were born in the province in which they resided, as can be seen in the census of 1872 (see Table 6.3). This was even more the case for the exporting states of the northeast and far south and the exceptional province of Minas
Gerais, whose slave population was probably growing through births of resident Creole slaves. There is only a moderate difference between men and women
in terms of their birth outside their province of residence, and even for the state of São Paulo, only 10 percent of the men
came from the northeastern states and only 7 percent of the women were born there. In both cases, Bahia was the most important state of origin, followed by slaves coming from Minas Gerais, and finally, by this time, African-born
slaves represented just 8 percent of the slave population. In this latter case, Rio de Janeiro had more diversity compared
to the other two importing provinces, because a very high 19 percent of its slave
TABLE 6.3. Ratio of Native-Born Slaves by Birth and Current Residence by Province in 1872 (for persons whose birthplace were known)
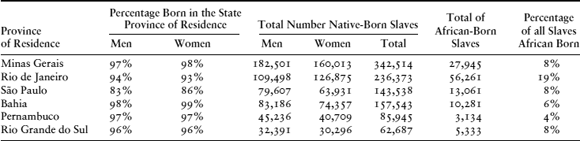
Source: Data generated from CEBRAP, 1872, Quadros de Provincia, quadros 4, 5, and 6.
population was African born, a ratio not found in the other provinces studied here.38
There is some debate in the literature about whether the end of the slave trade pushed planters toward encouraging births
and marriages among slaves, or if the opposite was the case.39 To date, there seems to be little evidence to suggest that planters themselves were more or less pro-natalist before and after 1850, and recent studies on the positive natural growth rates in Paraná and in Minas Gerais before 1850
would suggest that there was no inherent bias among slave owners against procreation of slave children and/or slave unions
and marriages.40
Finally, the growth of the slave population was influenced not only by deaths and births and by international and interprovincial migrations, but also by the rate of
manumission – or slaves leaving this status to become free. The age and sex of the manumitted slaves are now well understood from numerous manumission studies. Historians have systematically built on the pioneering work of Stuart Schwartz and Katia Mattoso that was done for Bahia. Not only has more work been done with Bahia, but we now have manumission studies for just about
every region of Brazil. In fact, the analysis of these cartas de alforria now provides a far better national coverage than for any other single quantitative aspect of slave analysis.41 Moreover, although there are some variations from urban and rural areas and from northeastern to southeastern regions, all studies have shown the same patterns of women and the young
being overrepresented among the manumitted, that voluntary grants of manumission – both free or unhindered manumissions and
onerous ones that required some postliberation obligations – were the most significant, but that self-purchase always made up a significant share of manumissions in almost all regions. There have even been some interesting attempts
to relate manumission patterns to plantel size, and one study has shown that the smaller the slaveholding, the higher the rates of manumission.42 It would appear that Africans and adults were more representative among the self-purchasing group than they were among the voluntary manumissions. All
of these themes will be more completely examined in Chapter 9, but it is worth stressing here that manumission rates in nineteenth-century Brazil were extremely high by American standards and represented a steady outmigration of slaves in their fertile years.
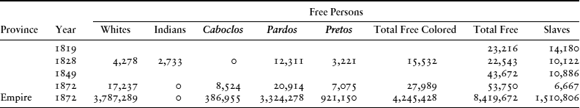
Without question, the fastest growing part of the Brazilian population was the free colored. With young women of childbearing
ages as the prime group being manumitted, it was inevitable that an important part of the growth of this class was due to
migration from slave status. But given the poor quality of census materials prior to 1872, it is difficult to precisely measure the two different factors
influencing free-colored growth – that is, natural growth due to births exceeding deaths and migration of manumitted slaves. Taking just a few approximate measures, one can roughly estimate the relative influence of these two factors in the growth
of the free-colored population. For example, the province of Rio de Janeiro – excluding the imperial court at the city of Rio – had a free-colored population of 64,592 in 1840 and this grew to 178,960
in 1872, for a per annum growth rate of 3.2 percent. In neighboring Minas Gerais, the free-colored population also grew at
3.0 percent per annum between 1814 and 1872, as it did in Pernambuco between 1829 and 1872. São Paulo, which had one of the slower rates of growth, saw its free-colored population grow at 2.4 percent per annum between 1811
and 1872. Even the slowest growing of these populations, those of the free colored for the provinces of the far South and
the West, all had rates of 2.0 percent per annum or greater (see Table 6.4). These growth rates were not achieved in most world populations until after the systematic decline of mortality – the so-called demographic transition – an event that did not occur in Brazil until the twentieth century. For this population, a very high contemporary rate of
natural growth would have been 1 to 1.5 percent per annum.43 Thus, at a minimum, half the growth of the free-colored population was probably due to the steady arrival of manumitted slaves
and only half to natural rates of increase. While systematic data are
TABLE 6.4. Slave and Free Populations in Nineteenth-Century Brazil by Color and Condition by Province, 1800–1872
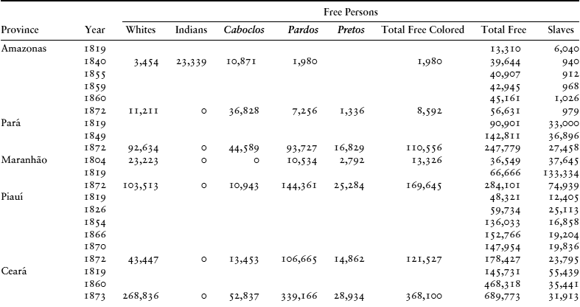
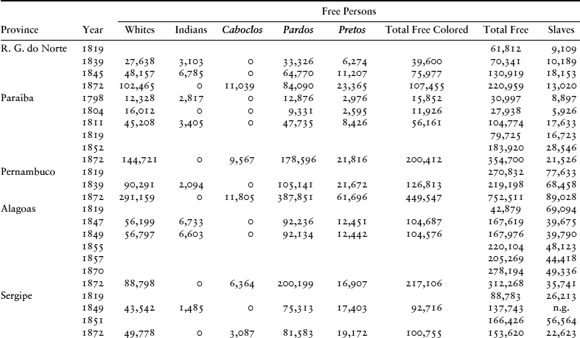
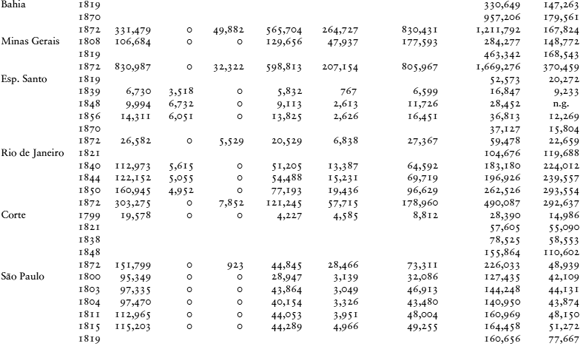
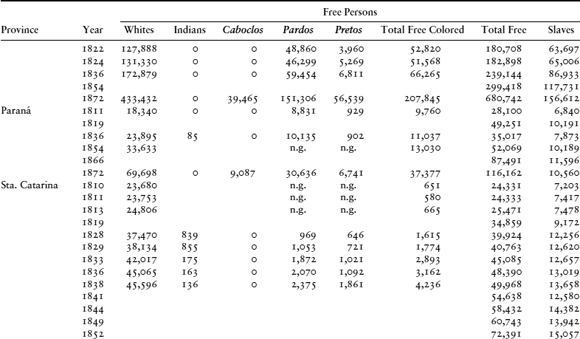
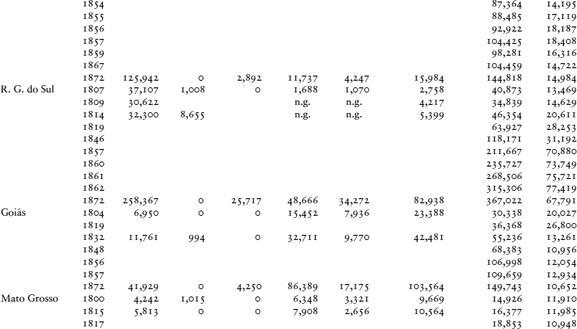
Sources: Paraíba, 1798: IHGB/CU, Arq. 1–1–13, fols. 148v–149; 1804, fol. 204. São Paulo, 1800: ANRJ, cod. 808, IV, fol. 255; 1803: fol. 256; 1822: fol. 262; 1811, 1815, and 1826: Roger Bastide and Florestan Fernandes,
Brancos e negros em São Paulo (São Paulo, 1959), p. 26. Maranhão, 1798: IHGB/CU, Arq. 1–1–6, fol. 92. Santa Catarina, 1811: ANRJ, cod. 808, 111, fol. 75; 1828, fol. 93; 1831: fol. 84; 1838:
fol. 86; 1860: Cardoso and Ianni, Côr e mobilidade social, p. 86. Rio Grande do Sul, 1807: ANRJ, cod. 808, 111, fol. 147. Mato Grosso, 1797: Revista do Instituto Histórico e Geográfico Brasileiro (Rio de Janeiro), XX (1857), 281; 1815: p. 292; 1828: ANRJ, cod. 808, 111, fols. 38–9. Minas Gerais, 1814: ANRJ, cod. 808,
1, fols. 130–2. Espírito Santo, 1839: ANRJ, cod. 808, I, fol. 35. Goiás, 1824: Auguste de Saint-Hilaire, Viagem às nascentes do Rio S. Francisco e pela província de Goyaz (São Paulo, 1937). I, 296–7; 1832: ANRJ, cod. 808, I, fol. 96. Rio de Janeiro, 1844: ANRJ, cod. 808, 11, £01, 62. Paraná,
1854: Octávio Ianni, As metamorfoses do escravo, apogeu e crise da escravatura no Brasil Meridional (São Paulo, 1962), p. 104. City of Bahia, 1775: IHGB/CU, Arq. 1–1–9, fol. 230. Brazil, 1872: Directoria Geral de Estatística,
Recenseamento da população do Império do Brazil a que se procedeu no dia 1 de agosto de 1872 (21 vols.; Rio de Janeiro, 1872–6). All other census data from Joaquim Norberto de Souza e Silva, Investigações sobre os recenseamentos da população geral do Império e de cada província de per si tentados desde os tempos
coloniais até hoje (1st ed., 1870; São Paulo: IPE-USP, 1986).
TABLE 6.5. Decline of the Slave Population, 1872–1885
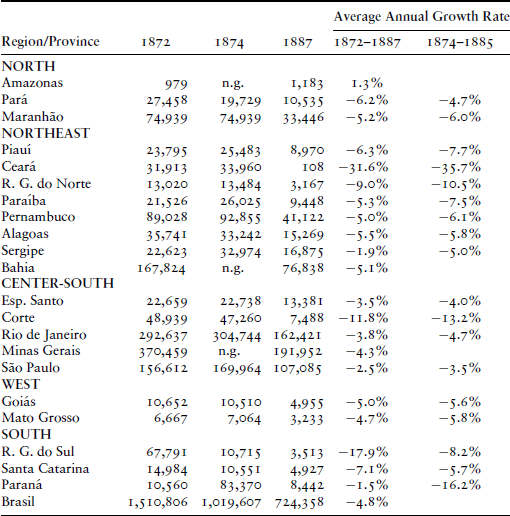
Sources: Slenes, “The Demography and Economics of Brazilian Slavery,” tables B-6, B-7, and table 6.3.
difficult to obtain, one estimate suggested an overall manumission rate in the 1870s of 8.5 percent for all slaves reaching
ten years of age.44
Had this outmigration of manumitted slaves been retained by the slave population, it is possible that the slave population after 1850 might have retained its numbers or even experienced a positive rate of growth. However, the reality was that there was a steady decline
of the slave population from 1850 onward. In every province the number of slaves declined, and only in selected coffee-exporting municípios did their numbers remain the same or expand in this period. By the matrícula (census) of 1887, after the law of free womb and the sexagenarian law were passed, the total slave population had dropped to half of the 1872 figure and was declining at a rate of 4.8 percent per annum (see Table 6.5). In fact, as Carvalho de Mello has shown, prices began to reflect the declining expectation of slave owners in the survival of slavery. By 1881, prices still suggested that slavery might continue until the early twentieth century, and even in 1886, prices indicated an expectation of five more years of
slavery. Only in 1887 had they declined to the point where the expectation was that it would survive only one more year.45 Had what Carvalho de Mello calls “strong abolitionism” not occurred, it is evident that slavery – which was still profitable in the 1880s – could have continued with the post-1850
population for a very long time.46
1 The figures presented here are still quite tentative and are estimates based on the voyage collection of the Atlantic slave
trade. This is an ongoing project developed under the aegis of David Eltis at Emory University and is constantly being updating
and changing its overall estimates of the volume of the trade. The biggest change since the publication of the first data
set (see David Eltis, Stephen D. Behrendt, David Richardson, and Herbert S. Klein, The Transatlantic Slave Trade, 1562–1867: A Database [New York, Cambridge: Cambridge University Press, 2000]) has been the almost doubling of the estimate of the Brazilian slave
trade. This trade is now recognized as both the longest and the largest of the Atlantic slave trades, and it is thought to
have transported an estimated 5.5 million Africans from Africa. Of this number, an estimated 4.8 million survived the crossing
(all estimates cited here and in the text were generated from data in the Voyages database in mid-August 2008). Given the
fact that only about 10 percent of the known slave ships have data on the actual numbers of slaves carried, the total estimates
are in a state of flux as new ships are found and new estimates for missing data are provided. The current iteration of the
database (which I accessed on August 18, 2008) can be found at http://www.slavevoyages.org/tast/index.faces. It should be noted that although all of the volume estimates of the slave trade, the relative importance of different time
periods, and the rates of national participation have changed over the last quarter-century, the overall numbers of the slave
trade are still well within the total limits established by Philip Curtin, The Atlantic Slave Trade: A Census (Madison: University of Wisconsin Press, 1969).
2 These origin data, generated on August 10, 2008, were taken from the Estimated data set, a subset of the online Voyages data
set and found at http://www.slavevoyages.org/tast/assessment/estimates.faces.
3 On the origin of the African slaves in Minas, see Francisco Vidal Luna and Iraci del Nero da Costa, “Algumas características
do contingente de cativos em Minas Gerais,” Anais do Museu Paulista, tomo XXIX (São Paulo: USP; 1979), pp. 79–97, and their essay “A Presença do elemento Sudanês nas Minas Gerais,” Suplemento Cultural, O Estado de São Paulo, Ano II, no. 188, (26/11/1978), pp. 14–16.
4 On the intimate relations between the two regions, see the classic study by Pierre Verger, Flux et reflux de la traite des négres entre le golfe de Benin et Bahia de Todos os Santos, du dix-septième au dix-neuvieme
siècle (Paris, 1968). On the postslavery contacts, there is an extensive literature: see Manuela Carneiro da Cunha, Negros, Estrangeiros: Os Escravos Libertos e a sua Volta à África (São Paulo: Brasiliense, 1985); Manuela Carneiro da Cunha, Da Senzala ao Sobrado: Arquitetura Brasileira na Nigéria e na República Popular do Benim [From Slave Quarters to Town Houses:
Brazilian Architecture in Nigeria and the People’s Republic of Benin] (São Paulo: Nobel/EDUSP, 1985); J. M. Turner, “Les Brésiliens: The Impact of Former Brazilian Slaves upon Dahomey” (Boston:
Ph.D. diss., Boston University, 1975); Alcione Meira Amos, “Afro-Brazilians in Togo: The Case of the Olympio Family, 1882–1945,”
Cahiers d’Études africaines, 162, XLI-2 (2001), pp. 293–314; Alcione Meira Amos and Ebenezer Ayesu, “Sou brasileiro: História dos Tabom, afro-brasileiros
em Acra, Gana,” Afro-Ásia, no. 33 (2005), pp. 35–65; Robin Law, “The Evolution of the Brazilian Community in Ouidah,” Slavery & Abolition, 22, no. 1 (2001), pp. 3–21; Eliseacutee Soumonni, “Some Reflections on the Brazilian Legacy in Dahomey,” Slavery & Abolition, 22, no. 1 (2001), pp. 42–60; and Olabiyi Babalola Yai, “The Identity, Contributions, and Ideology of the Aguda (Afro-Brazilians)
of the Gulf of Benin: A Reinterpretation,” Slavery & Abolition, 22, no. 1 (2001), pp. 61–71.
5 David Eltis, “The Relative Importance of Slaves and Commodities in the Atlantic Trade of Seventeenth-Century Africa,” The Journal of African History, 35, no. 2 (1994), pp. 237–49.
6 David Eltis, Economic Growth and the Ending of the Transatlantic Slave Trade (New York: Oxford University Press, 1987); and Herbert S. Klein, “The Structure of the Atlantic Slave Trade in the 19th Century:
An Assessment,” Revue Française d’Histoire d’Outre-mer, nos. 336–7 (2éme semestre 2002), pp. 63–77.
7 For different views on this question, see Joseph C. Miller, Way of Death: Merchant Capitalism and the Angolan Slave Trade, 1730–1830 (Madison: University of Wisconsin Press, 1988); and Robert E. Conrad, Tumbeiros: O tráfico de escravos para o Brasil (São Paulo: Brasiliense, 1985).
8 Herbert S. Klein, The Middle Passage: Comparative Studies in the Atlantic Slave Trade (Princeton: Princeton University Press, 1978); see also Herbert S. Klein and Stanley L. Engerman, “Slave Mortality on British
Ships, 1791–1797,” in Roger Anstey and P.E.H. Hair, eds., Liverpool, the African Slave Trade, and Abolition (Liverpool, Historical Society of Lancashire and Chesire, Occasional Papers, vol. 2, 1976), pp. 113–22; and by the same authors,
“Facteurs de mortalité dans le trafic française d’esclaves au XVIIIe siècle,” Annales. Économies, Societés, Civilisations, 31, no. 6 (1976), 1213–1223; and articles cited in notes 6 and 7.
9 Herbert S. Klein and Stanley L. Engerman, “Long-term Trends in African Mortality in the Transatlantic Slave Trade,” Slavery & Abolition, 18, no. 1 (April 1997), pp. 59–71; and for detailed data on mortality in the slave trade to Brazil, see Herbert S. Klein,
“The Trade in African Slaves to Rio de Janeiro, 1795–1811: Estimates of Mortality and Patterns of Voyages,” Journal of African History, X, no. 4 (1969), 533–49; and Herbert S. Klein and Stanley L. Engerman, “Shipping Patterns and Mortality in the African Slave
Trade to Rio de Janeiro,” Cahiers d’études africaines, no. 59, XV, no. 3 (1976), pp. 381–98.
10 Herbert S. Klein, Stanley L. Engerman, Robin Haines, and Ralph Schlomowitz, “Transoceanic Mortality: The Slave Trade in Comparative
Perspective,” The William & Mary Quarterly, LVIII, no. 1 (January 2001), pp. 93–118.
11 This is based on the total of new Africans who were buried in the special “Cementario para Pretos Novos” in Rio de Janeiro
in those years compared to the estimated total number of arrivals. This cemetery was not used by any resident forros or slaves, all of whom were buried by the irmandades in the city in their own churches or cemeteries, and thus was almost exclusively for those who had recently died upon arrival
from Africa. Júlio César Medeiros da S. Pereira, “À flor da terra: O Cemitério dos Pretos Novos no Rio de Janeiro” (Dissertação
de mestrado, Universidade Federal do Rio de Janeiro, 2006), pp. 120–1.
12 Fábio W. A. Pinheiro, “Tráfico atlântico de escravos na formação dos plantéis mineiros, Zona da Mata, c. 1809 – c. 1830” (Dissertação
de mestrado, UFRJ, Rio de Janeiro, 2007), tabela 13, p. 99, and tabela 7, p. 75. Over the entire period from 1809–1830, roughly
a third of the newly arriving African slaves (novos) were sent into the interior in this period, although annual rates fluctuated quite widely and increased dramatically in
the 1820s. It has been estimated for the 1770s for the port of Bahia that 22 percent of the novo slaves were shipped from the port to Minas Gerais and other interior regions – although again with high annual fluctuations. Alexandre Viera Ribeiro, “O comercio de escravos
e a elite baiana no período colonial,” in João Luis Ribeiro Fragoso, Carla Maria Carvalho de Almeida, and Antonio Carlos Juca
de Sampaio, eds., Conquistadores e negociantes. Histórias de elites no Antigo Regime nos trópicos, América lusa, séculos XVI a XVIII (Rio de Janeiro: Civilização Brasileira, 2007), p. 317.
13 On the economics of the trade, see the two works of Herbert S. Klein, The Middle Passage, especially chapters 2–4, and The Atlantic Slave Trade (2nd printing; Cambridge: Cambridge University Press, 2002), chapters 4–5; as well as Miller, Way of Death. Recent work on the Brazilian slave trade has included Jaime Rodrigues, De costa a costa, escravos, marinheiros e intermediários do tráfico negreiro de Angola ao Rio de Janeiro (1780–1860) (São Paulo: Companhia das Letras, 2005); Selma Pantoja and José Flavio Sombra Saraova (eds.), Angola e Brasil nas rotas do Atlântico sul (Rio de Janeiro: Bertrand Brasil, 1999); and Linda M. Heywood, ed., Central Africans and Cultural Transformations in the American Diaspora (New York: Cambridge University Press, 2002).
14 In fact, the triangular trade was mostly a myth, in the sense that slave-produced American products primarily moved in regular
shipping, and slave ships were only moderately used to bring these products from America to Europe. See Klein, The Atlantic Slave Trade, chapters 4 and 5.
 ncia-Geral do Ultramar, 1970). Gold was primarily used to purchase slaves only in the ports of the Bight of Benin.
See Klein,
ncia-Geral do Ultramar, 1970). Gold was primarily used to purchase slaves only in the ports of the Bight of Benin.
See Klein, 16 The current estimate of the Emory database is that 65 percent of the slaves who were shipped from Africa were males. This
was the number obtained on August 19, 2008, from the Summary Table available on the Voyage website and is based on only 12
percent of the 33,388 voyages that had actual breakdowns of the transported slaves by sex. See Summary Statistics at http://www.slavevoyages.org/tast/database/search.faces.
17 See Herbert S. Klein, “African Women in the Atlantic Slave Trade,” in Claire C. Robertson and Martin A. Klein, eds., Women and Slavery in Africa (Madison: University of Wisconsin Press, 1983), pp. 29–38.
18 This is a current estimate provided in the “Summary Table” of the Emory data set accessed on August 18, 2008. It should be
noted that only 12 percent of the 33,388 voyages listed in this source had the actual age breakdown of the transported Africans.
19 Herbert S. Klein, A Population History of the United States (Cambridge: Cambridge University Press, 2004), p. 83.
20 For a review of this issue for Minas Gerais, see Laird W. Bergad, Slavery and the Demographic and Economic History of Minas Gerais, Brazil, 1720–1888 (Cambridge: Cambridge University Press, 1999), pp. xix–xxi; and Clotilde Andrade Paiva and Douglas Libby, “Caminhos alternativos:
Escravidão e reprodução em Minas Gerais,” Estudos Econômicos, 25, no. 2 (Mayo–Agosto 1995), pp. 203–33. For Paraná, see Horácio Gutierréz, “A harmonia dos sexos: Elementos da estrutura
demográfica da população escrava no Paraná, 1800–1830,” Anais do V Encontro Nacional de Estudos Populacionais, ABEP (1986); “Demografia escrava numa economia não exportadora: Paraná,” Estudos Econômicos, 17, no. 2 (1987), pp. 297–314; “Crioulos e Africanos no Paraná, 1798–1830,” Revista Brasileira de História, 8, no. 16 (1988), pp. 161–88. On the sexual balance among the slaves and the high incidence of children in the relatively
backward economy of nineteenth-century Piauí, see Renato Leite Marcondes and Miridan Britto Knox Falci, “Escravidão e reprodução
no Piauí: Oeiras e Teresina (1875)” (Texto para Discussão, Série Economia, TD-E/26, USP-FEAC-Ribeirão Preto, 2001).
21 Pedro Carvalho de Mello, “The Economics of Labor in Brazilian Coffee Plantations, 1850–1888,” (Ph.D. diss., University of
Chicago, Department of Economics, 1977), and Robert W. Slenes, “The Demography and Economics of Brazilian Slavery, 1850–1888,” (Ph.D. diss., Stanford University, Department of History, 1976), chapter 7. Also see the discussion on demography
in Chapter 9.
22 Slenes, “The Demography and Economics of Brazilian Slavery,” pp. 273–4.
23 See Herbert S. Klein and Stanley L. Engerman, “Fertility Differentials between Slaves in the United States and the British
West Indies: A Note on Lactation Practices and their Implications,” The William & Mary Quarterly, XXXV, no. 2 (April 1978), 357–74.
24 Michael R. Haines, “The Use of Model Life Tables to Estimate Mortality for the United States in the Late Nineteenth Century,”
Demography, 16, no. 2 (May 1979), p. 307, table 7.
25 Jack Ericson Eblen, “New Estimates of the Vital Rates of the United States Black Population During the Nineteenth Century,”
Demography, 11, no. 2 (May 1974), p. 609, table 6. In fact, the spread was even greater if we look only at the whites versus the slaves
in the 1870s. The white rates calculated by Haines shows white men with a life expectancy at birth of 43.1 years and white
women of 45.1 years. Haines, “The Use of Model Life Tables to Estimate Mortality for the United States,” p. 307, table 7.
26 Eduardo E. Arriaga, New Life Tables for Latin American Populations in the Nineteenth and Twentieth Centuries (Berkeley: University of California, Population Monograph Series, no. 3, 1968), table III.3, pp. 29–30; and Carvalho de Mello,
“The Economics of Labor in Brazilian Coffee Plantations,” table 31, p. 123.
27 In an interesting study of fugitive slave advertisements in the leading newspaper of Rio de Janeiro in 1850, it was noted that some 40 percent of all the infirmities and diseases listed for 206 fugitives, 31 percent were
work related and the majority related to conditions of poverty. Márcia Amantino, “As condições físicas e de saúde dos escravos
fugitivos anunciados no Jornal do Commercio (RJ) em 1850,” História, Ciências, Saúde – Manguinhos, 14, no. 4 (Out.–Dez. 2007), p. 1384, tabela 1.
28 For an analysis of slave prices in the nineteenth century, see Katia M. de Queirós Mattoso, Herbert S. Klein, and Stanley
L. Engerman, “Trends and Patterns in the Prices of Manumitted Slaves: Bahia, 1819–1888,” Slavery & Abolition, 7, no. 1 (May 1986), pp. 59–67. A Portuguese version was published in João José Reis, ed., Escravidão e invenção da liberdade: Estudos sobre o negro no Brasil (São Paulo: Editora Brasiliense, 1988), pp. 60–72. The most recent collection and analysis of these prices is found in Bergad,
Slavery and the Demographic and Economic History of Minas Gerais.
29 Although there were significant fluctuations over time, by the early nineteenth century it has been estimated that only 13,168
African slaves (novos) were brought into Minas Gerais by coastal traders in the period from 1800–1830, along with some 561 Creole slaves (ladinos). Cristiano Corte Restitutti, “A circulação entre o Rio de Janeiro e o Sul de Minas Gerais, c. 1800–1830,” XVI Encontro Nacional de Estudos Populacionais, ABEP (2008), tabela 8, p. 12. This would give an annual rate of 458 slaves, clearly far less than was the norm in the early eighteenth
century, or the rates noted for the post-1850 period. In the case of Porto Alegre in Rio Grande do Sul, aside from direct African arrivals, the port has received transshipped from Rio de Janeiro some 6,958
slaves from 1809 to 1824, for an average of 435 slaves per annum. Gabriel Santos Berute, “A concentração do comércio de escravos
na capitania do Rio Grande de São Pedro do Sul, c. 1790 – c. 1825,” II Encontro “Escravidão e Liberdade no Brasil Meridional” (2005), tabela 1, coluna B, p. 6.
30 José Flávio Motta, “O tráfico de escravos na Província de São Paulo: Areias, Silveiras, Guaratinguetá e Casa Branca, 1861–1887,”
Anais VII Encontro Nacional de Economia Política (Curitiba, 2002), pp. 3–5; and the same pattern was found for the 1870s in Guaratingetá in the 1870s, although in this case
with a more balanced sex ratio. José Flávio Motta and Renato Leite Marcondes, “O Comércio de Escravos no Vale do Paraíba Paulista:
Guaratinguetá e Silveiras na Década de 1870,” Estudos Econômicos, 30, no. 2 (Abril–Junho 2000), table 2, p. 272.
31 See Erivaldo Fagundes Neves, “Sampauleiros traficantes: Comércio de escravos do Alto Sertão da Bahia para o Oeste cafeeiro paulista,” Afro-Ásia, no. 24 (2000), pp. 97–128.
32 It would appear that on average, prices in Rio Claro São Paulo for young adult males age 15–29 were double the price paid
in the same year for these young male slaves in Bahia. Neves, “Sampauleiros traficantes,” tabela 5, p. 111.
33 This is a finding encountered for all years in a whole range of municípios throughout São Paulo; see Motta, “O tráfico de escravos na Província de São Paulo,” p. 7; José Flávio Motta, “Derradeiras
transações: O comércio de escravos nos anos de 1880 (Areias, Piracicaba e Casa Branca, Província de São Paulo),” Anais do XII Encontro Nacional de Economia Política (São Paulo, 2007), graph 1, p. 8; in Piracicaba, he found that only 12 percent of the slaves sold whose origins were known, were from outside the province in the 1860s. In the district of Constituição between 1861–1869, interprovincial
slaves accounted for a high 38 percent of local slaves; moreover, the interprovincial sales were far more male than were sales
sold from any other area. José Flávio Motta, “Escravos daqui, dali e de mais além: O tráfico interno de cativos em Constituição
(Piracicaba), 1861–1880,” Anais do XXXIII Encontro Nacional de Economia ANPEC (2005), pp. 5–6, tabelas 3–4. The same findings were also noted in studies on the province of Minas Gerais. In Juiz da Fora, only 23 percent of slaves purchased in the local market in the late 1860s and early 1880s were of interprovincial
origin, and here too males (who made up more than two-thirds of these interprovincial slaves) predominated, more so than any
other origin group. Cláudio Heleno Machado, “O tráfico interno de escravos na região de Juiz de Fora na segunda metade do
século XIX,” X Seminário de Economia Mineira (2002), table 5, p. 17. In Mariana, the majority of slaves, both male and female, were young – the modal age being twenty
to twenty-four years and only a minority were brought through the interprovincial trade; see Camila Carolina Flausino, “Negócios
da escravidão: Tráfico interno de escravos em Mariana: 1861–1886” (Dissertação de mestrado em História, Universidade Federal
de Juiz de Fora, 2006), tables 14 and 15, pp. 82, 87. The only scholar to date who has found very significant numbers of interprovincial
slaves was Robert Slenes in his study of the Campinas Market from 1865–1879. Of some 2,684 slaves sold in the Campinas market,
68 percent came from outside São Paulo and the southeastern region in general. Slenes, “The Demography and Economics of Brazilian
Slavery,” table 3.3, p. 136.
34 One contemporary source reported that 26,622 slaves were imported into Rio de Janeiro between 1852–1859, which would give
an annual average of 3,327 slaves. This source stated that slave imports into Rio de Janeiro were as follows:
Sebastão Ferreira Soares, Notas estatisticas sobre a producão agrícola e carestia dos gêneros alimentícios no Império do Brazil (Rio de Janeiro: J. Villeneuve, 1860), p. 1351. The British Minister to Rio de Janeiro, W. D. Christie, reported that “34,688 slaves had been imported at Rio by sea in ten years and a half, from January 1, 1852, to July 1, 1862,” which would give a rate of 275 per month or 3,300 per annum. He then went on to estimate that with slaves brought by land from other regions, the estimate was 5,000 arrivals per annum in this internal slave trade. W. D. Christie, Notes on Brazilian Questions (London: Macmillan, 1865), p. 93.

35 For the respective importation figures, see Joaquim Saldanha Marinho, Relatório apresentado a Assembléia Legislativa provincial de São Paulo…no dia 2 de fevereiro de 1868 pelo presidente da mesma província.…(São Paulo: Typ. do Ypiranga, 1868), p. 15; Relatório com que sua excelência o sr. senador Barão de Itaúna passou a administração da província ao exmo. sr. comendador
Antônio Joaquim da Rosa (São Paulo: Typ. Americana, 1869), Annexo no. 1, Mapa no. 7; and Antonio Candido da Rocha, Relatório apresentado à Assembléia Legislativa provincial de São Paulo pelo presidente da província…(São Paulo: Typ. Americana, 1870), pp. 65–6. It should also be noted that slaves were exported from this same port and that
the net gain for the port was 580 slaves in 1867, 780 in 1868, and 1,746 in 1869.
36 Ferreira Soares, Notas estatísticas, pp. 135–6. It should be noted here as well that whereas southern ports such as Santos exported as well as imported slaves, northern ports such as Salvador da Bahia also imported as well as exported. Thus, in 1855, Bahia exported 1,699 slaves and
imported 471 for a net loss of 1,228. In 1856, its net loss was 1,794, with 2,388 slaves exported to other ports of the empire
and 594 imported. Álvaro Tibério de Moncorvo Lima, Falla recitada na abertura da Assembléia Legislativa da Bahia.…(Bahia: Typ. de Antonio Olavo da França Guerra, 1856), mapa n. 48; João Lins Vieira Cansanção de Sinimbu, Falla recitada na abertura da Assembléia Legislativa da Bahia.…(Bahia: Typ. de Antonio Olavo da França Guerra, 1857), mapa n. 24.
37 As early as 1862, Bahia passed an export tax of 200 milréis on every slave exported from the state. Other states soon followed,
and the internal interprovincial trade was definitively terminated by imperial decree in 1885 as part of the Sexagenário freedom
act. Neves, “Sampauleiros traficantes,” pp. 107–8.
38 In total, there were some 177,000 Africans in Brazil listed in the census of 1872, of whom 22 percent (or 38,000) were free
persons.
39 For the former position, see Manolo Florentino and Cacilda Machado, “Sobre a família escrava em plantéis ausentes do mercado
de cativos: Três estudos de casos (século 19),” XI Encontro Nacional de Estudos Populacionais da ABEP (1998), especially p. 1381. This is also the position of Gorender, who suggests that a pro-natalist attitude of slave owners
could only develop after the end of the slave trade; see Jacob Gorender, O escravismo colonial (4th ed. rev.; São Paulo: Editora Ática, 1985), pp. 343ff. Slenes takes the opposite view, suggesting far less interest in
slave fecundity and slave marriage in all the plantation areas of the Southeast after 1850; see Robert W. Slenes, Na senzala, uma flor: Esperanças e recordações na formação da família escrava: Brasil Sudeste, século XIX (Rio de Janeiro: Editora Nova Fronteira, 1999), p. 92. For an argument showing strong marriage ties from the earliest times,
see Tarcísio Rodrigues Botelho, “Familia e escravidão em uma perspectiva demográfica: Minas Gerais (Brasil), século XVIII,”
in Douglas Cole Libby and Júnia Ferreira Furtado, eds., Trabalho livre, trabalho escravo, Brasil e Europa, séculos XVIII e XIX (São Paulo: Annablume, 2006), pp. 195–222.
40 As Carvalho de Mello has pointed out, the effect of the slave trade closure on fertility was probably minimal; because “the
response of demographic behavior to changes in the economic conditions is a long-run process, it takes some time to begin
and more for the effects to be significantly observed.” Carvalho de Mello, “The Economics of Labor in Brazilian Coffee Plantations,”
p. 120.
41 In his survey of six earlier studies of manumission in the colonial Latin American world, including Brazil, Johnson found
that women predominated in all these manumission lists, and that self-purchase usually involved half the freedom acts; see
Lyman L. Johnson, “Manumission in Colonial Buenos Aires, 1776–1810,” Hispanic American Historical Review, 59, no. 2 (May 1979), p. 262, table 1. This also holds true for all the latest studies done on Brazil. See, among others,
Kathleen J. Higgins, “Gender and the Manumission of Slaves in Colonial Brazil: The Prospects for Freedom in Sabará, Minas
Gerais, 1710–1809,” Slavery & Abolition, 18, no. 2 (1997); Mieko Nishida, “Manumission and Ethnicity in Urban Slavery: Salvador, Brazil 1808–1888,” Hispanic American Historical Review, 73, no. 3 (August 1993); and Marcus J. M. de Carvalho, Liberdade, rotinas e rupturas do escravismo, Recife, 1822–1850 (Recife: Ed. Univesitária UFPE, 1998), chapter 10. See also the older studies of Katia M. de Queirós Mattoso, “A propósito
de cartas de alforria: Bahia, 1779–1850,” Anais de História, 4 (1972), and her “A Carta de alforria como fonte complementar para o estudo de rentabilidade de mão de obra escrava urbana,
1819–1888,” in Carlos Manuel Pelaez and Mircea Buescu, eds., A moderna história econômica (Rio de Janeiro: APE, 1976); and Stuart B. Schwartz, “The Manumission of Slaves in Colonial Brazil: Bahia, 1684–1745,” Hispanic American Historical Review, 54, no. 4 (1974); Peter L. Eisenberg, “Ficando livre: As alforrias em Campinas no século XIX,” Estudos Econômicos, 17, no. 2 (1987); Mary C. Karasch, Slave Life in Rio de Janeiro, 1808–1850 (Princeton: Princeton University Press, 1987), chapter 11; and Douglas Cole Libby and Clotilde Andrade Paiva, “Manumission
Practices in a Late Eighteenth-Century Brazilian Slave Parish: São José d’El Rey in 1795,” Slavery & Abolition, 21, no. 1 (2000); Francisco Vidal Luna and Iraci del Nero da Costa, “A presença do elemento forro no conjunto dos proprietários
de escravos” Ciência e Cultura (São Paulo: SBPC), 32, no. 7 (Julho 1980), pp. 838–41.
42 Newer manumission studies evaluating the relative importance of the three types of voluntary and self-purchase arrangements
include Manolo Florentino and José Roberto Góes, “Do que Nabuco já sabia: Mobilidade e miscigenação racial no Brasil escravista”
(Congresso Internacional Brasil-Portugal Ano 2000 – Sessão de História, 2000); Antônio Henrique Duarte Lacerda, “Economia cafeeira, crescimento populacionale manumissões
onerosas e gratuitas condicionais em Juiz de Fora na segunda metade do século XIX,” X Seminário sobre a Economia Mineira (2002); and the previous cited study of Nishida on manumissions in Salvador. Unfortunately, some local scholars lump both
self-purchase and post-manumission personal service as “onerous” manumissions, without distinguishing the two. This was the
problem with the otherwise excellent local study of Adriano Bernardo Moraes Lima, “Trajetórias de Crioulos: Um estudo das
relações comunitárias de escravos e forros no têrmo da Vila de Curitiba (c. 1760–c. 1830) (Dissertação de mestrado, UFP, Curitiba, 2001), tables 10–13, even though
she shows that 46 percent of the 105 emancipated slaves were listed with a family relationship, which presumably meant that some of these slaves had their freedom purchased by third
parties.
43 The growth rates of thirteen major western European countries from 1820–1870 was 0.72 percent per annum and rose to just 0.99
percent in the 1870–1913 period. At the same time, Portugal's rate was 0.56 percent and rose to 0.75 percent in the second period. Angus Maddison, The World Economy: A Millennial Perspective (Paris: Development Centre of the Organisation for Economic Co-operation and Development, 2001), p. 242, table B-11. On the
demographic transition, see Jean-Claude Chesnair, The Demographic Transition, 1720–1984 (Oxford: Clarendon Press, 1992).
44 Slenes, using the matrículas of 1873 and 1875, has estimated an average crude manumission rate of 6.3/1,000, a figure that compares to o.45/1,000 for the United States in the 1850s. Controlling for mortality, he estimated that any slave reaching ten years of age had a 5.1 percent change of being manumitted by age forty, and for
age sixty, the overall rate was 8.4 percent. Slenes, “The Demography and Economics of Brazilian Slavery,” pp. 488–93.
45 Carvalho de Mello, “The Economics of Labor in Brazilian Coffee Plantations,” p. 209, table 41.