Objective of this Unit: To understand what writing task 1 is.
For writing task 1 you are required to write a short report on graphical information provided. This means you may be asked to describe a diagram, chart or graph, or some other graphic representation. You may also be asked to describe the process illustrated by a diagram.
Tip: The best way to think of this report is to imagine you are writing a report for somebody who cannot see the information, so they can understand what is happening.
Tip: Make sure your report is neutral and unbiased. This means that your opinion should NOT be included in your report.
This task is difficult for many people because they are not sure what things to write about and how to actually describe what is happening in the way that the IELTS evaluators want.
Once you know how to structure your answer and the way to express the information correctly and develop your answer in the way the evaluators love, it becomes very easy.
This book will show you exactly how to do this.
Objective of this Unit: To develop a system for answering writing task 1.
The most efficient way of approaching the writing section and the individual tasks is by implementing a systemized approach. A system reduces time wasting and makes sure you are answering the questions in the best way possible.
A writing system is something that has a level of automation. It can be used in all situations and provides a clear framework from which to produce the correct answer every time. This means that by developing a system for each writing task, you are developing a clear framework that will produce a high IELTS score.
Here is a suggested system to follow:
Step 1 – Recognize and identify the graphic form, i.e.; line graph, bar chart, pie chart, etc.
Step 2 – Look for trends, what information the chart is showing, the range of data and how the data change over time.
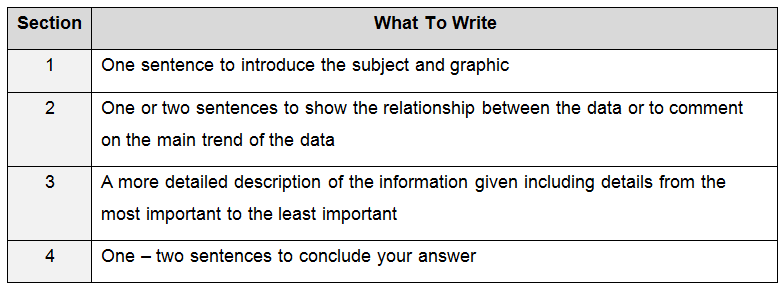
Step 3 – Write your answer according to the plan below:

Step 4 – Make sure you use appropriate vocabulary when describing data. By using more advanced vocabulary you will obtain a higher score.
In Task 1, the best approach is to follow a system to plan, develop, write and review your letter for best results.
The key things to remember are:
• Describe what is happening in the graphic from an unbiased point of view
• Describe the graphic using the passive voice
• Respond to each of the bullet points
• Use a clear introduction and conclusion
• Use transition/connecting phrases to connect your ideas
• Use varied and some higher level vocabulary
• Check your spelling errors
• Check your capitalization
• Check punctuation
• Use a proven structure for organisation
Objective of this Unit: To learn key expressions to use when you explain what is happening in the graphic.
Here are some example phrases and words to use:

Once you have written a practice report, use the following questions to make sure you have included everything in the report:
• Have you identified the type of graphic that is used?
• Is the writing easy to follow?
• Have you correctly explained if the graphic relates to the past, present or future?
• Have you included all the subjects that are referred to in the diagram?
• Have you included references to the correct units? (eg; month, year, km, litres)
• Have you mentioned the peaks or troughs shown in the graphic?
• Have you noted the trends?
• Is the answer long enough (150 words)?
• Is there a sense that the report has been planned?
• Are words or phrases taken from the question paraphrased?
• Are there cohesive devices used?
• Is a wide range of vocabulary used?
• Is a wide range of grammar used?
• Is the language used simple or complex?