7
Commodity Beta: Diversification and Inflation Protection
Although financial exchanges for commodities and portfolio assets linked to commodities—from bullion deposits to mining shares—have been around for centuries, commodities have seen a recent surge in investor interest as an “alternative” asset class.
Academic studies in the 1990s documented the seemingly good risk-versus-return profiles of commodities, low or negative correlations to traditional asset classes and the business cycle, and low cross-commodity correlations. This research inspired many large institutional investors, such as pension funds, sovereign wealth funds, and university endowments (notably Yale University’s endowment model under David Swensen), to explore allocating more of their investment portfolios directly to physical commodities and long-only commodity-linked funds. By the time of writing, this investment had grown to massive allocations aggregating to hundreds of billions of dollars, and nearly every large asset manager was making at least some allocation to the commodities sector.
As the populations of the world’s advanced and emerging economies age and retire, the financial yields from savings and investment portfolios rather than professional incomes will become ever more important sources of income for households, putting further pressure on asset managers and institutional investors to find ways to deliver that yield. Unsurprisingly, investors have been scouring markets in a search for yield, and interest in alternative assets such as commodities is likely to remain strong.
In this chapter, we discuss the rise of financial instruments linked to commodity markets, the entry of long-term institutional investors as a new class of speculators, and some widely mentioned investment rationales for their exposure, with emphasis on some that have not fared as well as others.
Financialization of Commodities Markets
Earlier chapters discussed the various financial instruments linked to commodity markets, such as futures and options contracts. These have a long and venerable history, dating back to futures contracts developed by Dutch traders in the seventeenth century (including tulip futures during the notorious Dutch tulip bubble in the 1630s) and the Dojima Rice Exchange, established in 1697 in Osaka, Japan. The first modern standardized futures exchange was established to trade grain at the Chicago Board of Trade in 1864. Exchanges subsequently spread to many other commodities, including the first oil-linked futures contract by the New York Mercantile Exchange in 1978.
Since 2002, the rise in trading volume of “paper” oil is indicative of a broader trend. In 1995, financial traders traded paper contracts linked to about one billion barrels of oil every day. By 2012 that number had exploded to more than one trillion barrels of oil every day, a thousand times increase (figure 7.1). By contrast, approximately 90 million barrels of physical oil are being produced and consumed globally in the spot market every day. In other words, more than 10,000 times as much oil is trading hands financially than is trading physically every day.

Figure 7.1 Total financial oil trading volume vs. physical volumes, 2000–2012.
Part of this growth was undoubtedly driven by the increasing interest of investors such as hedge funds, institutional investors, and even retail investors in the commodities space. We first concentrate on institutional and retail investors typically interested in long-only allocations to commodities through passive indexes, medium-term notes (MTNs), and exchange-traded products (ETPs). The outstanding value of assets under management (AUM) exceeded $400 billion in early 2011 (figure 7.2).
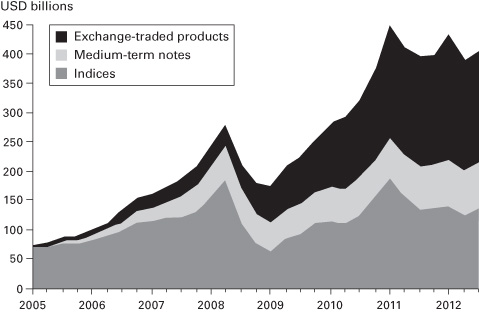
Figure 7.2 Commodity assets under management, 2000–2012.
Sources: Bloomberg, Barclays Capital.
Part of this increase in value is, of course, being driven by the underlying rise in commodity spot prices, but the increase in these long-only positions represents a major influx of new investment capital into the commodity space. Does it make sense for there to be so much in long-term holdings in commodities?
Commodity Beta and Diversification
A full review of modern portfolio theory (MPT), first articulated by Sharpe and Markowitz, is beyond the scope of this book. As a quick reminder, it assumes investors face a trade-off between the expected return of a portfolio and its risk, often measured as its standard volatility or variance. The capital asset pricing model (CAPM) closes the MPT model by finding that the mean return of any asset, such as stocks, bonds, and so forth, is driven by its beta, or its correlation with the overall fully diversified market portfolio. Assets with a high beta must also have a higher return to compensate investors for their lack of diversification value in reducing overall risk. Any outperformance of an asset not explained by its beta is the elusive “alpha.” Such outperformance assigned to alpha might be achieved by taking advantage of arbitrage opportunities or accumulating risk premia.
Inspired by this seminal mean variance framework, investors have come to use the terms “alpha” and “beta” more loosely to refer to any source of uncorrelated and usually ephemeral positive returns from arbitrage versus the portfolio gains that stem from long-term structural exposure to an asset. Much of the challenge to investors is distinguishing between true sources of alpha resulting from mispricing versus being “lucky” with beta.
Is there a beta case to be made for a long-term long-only financial exposure to commodities? The first question is how investors actually gain said exposure. The vast majority of passive index investments, medium-term notes (MTNs), and exchange-traded products (ETPs) follow some variation of the “rolling” strategy described in chapter 4, whereby the investor takes a long position in a futures contract at  , exits it immediately before expiration at the future spot price
  , then uses the proceeds to buy another futures contract, which starts the cycle again.
As seen before, the performance of this rolling strategy can be divided into two components, the spot return,  , and the inverse roll return,
  :
:
If the markets are risk neutral and there is no risk premium, then  , and this rolling strategy will on average result in zero returns. Any consistent outperformance comes from the alpha associated with reaping the risk premia by providing economic insurance to commercial hedgers, not from any beta exposure to the underlying spot returns of the commodity. (We discuss the alpha from this spread alpha in the next chapter.) But the entire concept of relying on rolling strategies to provide beta exposure rests on shaky theoretical ground. To the degree it works in practice it is because, as we saw earlier, futures markets do a terrible job of predicting future spot prices, and spot price returns swamp any roll returns. We return to this topic in the next chapter.
But suppose the investor does find a financial product that provides a relatively unadulterated exposure to the spot return, such as through holding physical storage, purchasing farmland, or leasing undeveloped energy acreage. Is a long-term exposure to this source of beta desirable? To answer this question, we need to understand the underlying economic relationship between commodity markets and whatever other asset classes the investor is holding in his or her portfolio, such as stocks or bonds.
We discussed the relationship between commodities and fundamental demand and supply factors in previous chapters. Commodity demand is driven by global demand factors, such as the business cycle and structural economic growth. The impressive but resource-intensive growth by emerging economies, particularly China and India, has underpinned an impressive spot market return across many commodities markets since the beginning of the twenty-first century.
In other words, commodities can offer indirect exposure to the rise of emerging markets and the aspirations of millions of newly middle-class households with resource-intensive consumption patterns, such as a taste for private automobiles and beefsteaks.
But this is a positively correlated relationship: stronger economic growth lifts both equity markets and commodity prices together. Presumably investors seeking diversification are looking for negative or at least neutral relationships to traditional equity asset classes. At best, what they are gaining is a substitute rather than a complement to emerging market equities and bonds. This may still be valuable, but it is a far cry from the idea of commodities as a source of diversification or low or negative beta compared to other asset classes.
In fact, even for developed market equities, such as the U.S. S&P 500 total return index, the returns look positively correlated to commodity price indexes, such as the popular S&P Goldman Sachs Commodity Index (GSCI) benchmark, particularly around areas of global demand shocks such as the 2009 global recession and ensuing financial crisis (figure 7.3).
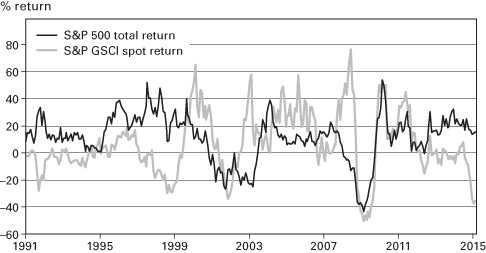
Figure 7.3 S&P 500 total return vs. GSCI spot return, 1991–2016,
Furthermore, unlike commodities, equities generate continued economic value; companies try to generate value through the provision of goods and services to consumers. The value of companies may see long-term continued appreciation through technological growth and profits from market share. But commodities are just static goods, and, as discussed in previous chapters, their long-term level is stationary despite long super-cycles up and down. The long-term return of a long-only allocation to commodities is zero (or even negative, if technological progress causes a commodity to become obsolete).
This positive linkage between commodity demand and economic growth, on the one hand, and no long-term return on the other suggests that commodities are not an ideal asset class from a diversification perspective.
However, there may be another rationale for investing in commodity beta: to protect against political shocks. Here the diversification argument is more straightforward. Political shocks that cause commodity prices to rise, for example, a hot war that disrupts supply, may also depress economic growth and equities as companies and households face higher commodity prices. In particular, a geopolitical tail event that depresses equity prices may in turn cause commodities to spike. We discuss geopolitical tail events in chapter 9.
Commodity Beta and Inflation Protection
Another rationale for seeking a beta allocation to commodities is to protect against inflation. Inflation is defined as a general rise in nominal prices for a broad basket of goods and services in an economy. This basket includes commodities consumed widely by households and companies, such as food and energy.
Economists often distinguish between headline inflation, which captures the entire consumption basket, and core inflation, isolated to only the basket of non-food and non-energy goods and services. Why does this help? First, by removing noise from the frequently volatile food and energy subcomponents, core inflation can provide a more stable and meaningful assessment of the price stability of the underlying economy.
Second, because core inflation reflects the pricing decisions of a wider category of firms, movements in core inflation are a more useful predictor of future inflation than are changes in headline inflation. Partially for this reason, core inflation is the inflation metric most widely watched by central banks in determining monetary policy. Doing otherwise would result in a hypersensitive monetary policy.
Inflation reduces the real purchasing power of any nominally denominated financial assets such as cash, stocks, and (non-inflation-linked) bonds. This real wealth destruction should be of great concern to investors. A portfolio exposure to commodities, a major driver of headline inflation (and particularly unexpected inflation), can thus serve as a financial hedge against inflation.
To assess the efficacy of commodity beta as an inflation hedge, we must first explore the relationship between commodity prices and broader core and headline inflation. First, as mentioned above, commodities have a straightforward direct presence in broad consumption baskets. In the United States, for example, housing is the largest component of the CPI consumption basket (figure 7.4). But transportation and food costs, which are closely linked to energy and agricultural commodity prices, are also substantial. The U.S. Bureau of Labor Statistics (BLS) calculated that commodities account for as much as 41% of headline inflation, with the largest drivers being food (14%) and energy (8%) in 2017.
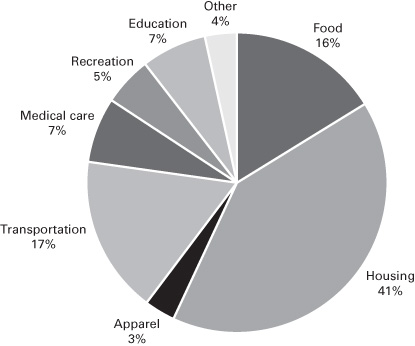
Figure 7.4 Components of U.S. Consumer Price Index (2015).
It is important to note that as substantial as food and energy expenses are to the average consumer in a developed economy, they are dwarfed by their importance to consumers in emerging and developing economies. The importance of food expenses alone runs anywhere from 25% to as high as 75% for certain sub-Saharan African nations. The economic distress that results from high food prices in the poorest nations has made food security a top issue on the international policy agenda. Governments in the developing world are particularly sensitive to high food prices because those prices can spill over into the political arena, galvanizing discontent against the incumbent regime. Many of the simmering tensions that led to the Arab Spring and regime change in Tunisia, Libya, and Egypt can be traced to anger over food costs, as well as frustration over stagnant economies and corrupt regimes.
But in addition to the direct presence of commodities in consumption baskets, there are also more pernicious ways that commodity price inflation can indirectly affect even non-commodity-linked core inflation, such as when firms increase prices for goods and services because of higher input costs. For example, even though a household living in an apartment building may not be directly consuming copper, the landlord may raise rents because of higher maintenance costs when copper prices rise. This pass-through from headline commodity prices to the core inflation basket is one mechanism by which commodity prices might affect broader inflation as well as inflation expectations.
This complicated three-way relationship among commodities, core inflation, and expectations is captured in the triangle shown in figure 7.5.
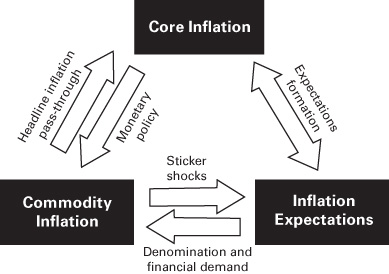
Figure 7.5 Relationships among commodity inflation, core inflation, and inflation expectations.
We have already discussed the direct pass-through from commodities to core inflation. Economic policy makers—in particular central banks—may respond to higher core inflation levels with contractionary policies such as raising interest rates. Raising rates slows economic growth and depresses real demand for commodities.
Furthermore, sudden increases in food, energy, and other commodity prices may also affect market expectations of future general inflation. When economic agents begin to expect high levels of inflation, it can become a self-fulfilling prophecy. This cycle can even occur when there is slack in the real economy, as any student of the 1970s oil price shocks and resulting stagflationary unhinging of inflation expectations in the United States can testify.
In turn, higher inflation and inflation expectations can drive significant appreciation in nominal commodity prices. This happens for two reasons: first, because inflation means the real value of the denominating currency (typically the U.S. dollar) is depreciating, and second, as a result of higher financial demand for commodities as an inflation hedge, notably for precious metals.
How well do commodity indexes track consumer inflation in practice? Figures 7.6 and 7.7 show the recent energy component of consumer inflation in the United States, the EU, and Japan compared to the Energy Sub-Index, which tracks the energy subcomponent of the S&P GSCI. As we can see, the index tracked headline energy inflation quite well, with correlations ranging from 40% to 50% for Japan to as high as 70% to 80% for the United States and the EU.
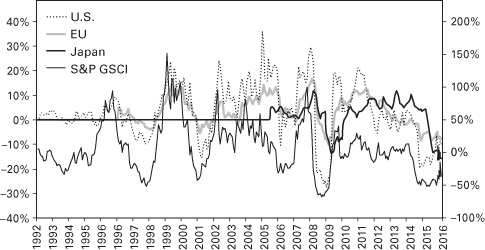
Figure 7.6 Energy inflation for selected economies and the S&P GSCI Energy Sub-Index, % year-over-year returns, 1992–2016.
Source: Bloomberg.
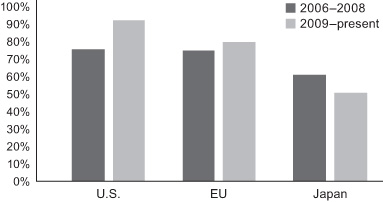
Figure 7.7 Spot energy prices and energy subcomponent inflation correlations.
Source: Bloomberg.
However, the S&P GSCI Agriculture Sub-Index does a much poorer job of tracking food inflation for the same economies, with correlations negative for Japan (figures 7.8 and 7.9).

Figure 7.8 Food inflation for selected economies and the S&P GSCI Food Sub-Index, % year-over-year returns, 1992–present.
Source: Bloomberg.

Figure 7.9 Spot food prices and food subcomponent inflation correlations.
Source: Bloomberg.
It is possible the difference may reflect weaker pass-through of raw agricultural commodity prices into retail food prices due to greater pricing wedges introduced by intermediate processors and distributors in the food sector compared to the energy sector. It may also be driven by different commodity preference baskets. A heavily rice-based food index in Japan may not be as well tracked by an index that tracks global corn and wheat prices.
To conclude, commodities are a significant source of direct inflation to consumers and, given their substantial correlation to overall inflation indices, investing directly in commodities can provide some (imperfect) protection against inflation. But in the next section, we shall discuss the more powerful linkages between commodity prices and unexpected inflation shocks.
Expected versus Unexpected Inflation
We have discussed the relationship between commodity prices and the commodity-linked sources of headline inflation. What about the rest of core inflation unrelated directly to food and energy prices? In fact, in so far as any inflation that has already been built into expectations, companies and bond issuers should have already (in theory) reflected them in their business and pricing decisions. For example, consider a zero-coupon bond that should pay $110 in face value one year from now, and assume that the nominal interest rate was zero (no time value of money). If investors already expect that there should be 10% nominal inflation throughout the year, they would correctly recognize that $110 one year from now is worth $100 in real terms, and this bond should already be priced at $100. Only cash would see a true erosion of real value from any expected inflation.
And should problems in the ability of companies and bond markets prevent a perfect readjustment of asset prices to absorb expected inflation, fear not! Many governments have begun issuing inflation-linked securities, such as the U.S. Treasury Inflation-Protected Securities (TIPS) and the UK’s Inflation-linked Gilts. These securities represent the most direct means by which investors can protect against expected inflation, as either the bond’s coupons or the principal repayments are explicitly linked to some common measure of inflation (e.g., the U.S. CPI). Even many emerging economies have begun issuing instruments linked to inflation.
The problem with inflation-linked securities is that while they serve as an excellent hedge against expected inflation, market expectations of future inflation do not necessarily capture the actual realization of inflation. In other words, investors also face significant unexpected inflation shocks. Figure 7.10 compares various measures of inflationary expectations, such as the University of Michigan’s surveys of inflation or the amount of inflation priced in by the one-year TIPS market compared to the actual realization of U.S. CPI inflation one year hence. It is clear that markets did a rather terrible job of foreseeing realized inflation, especially during the global recession of 2008–2009.
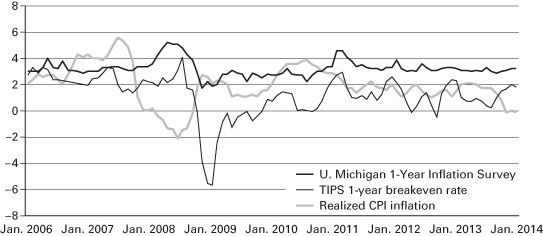
Figure 7.10 Inflation expectations vs. realized inflation.
Here is where commodity beta investment can truly shine as an inflation hedge, because commodity-tracking indices often prove highly correlated to unexpected inflationary shocks. In 2007, realized CPI inflation proved much higher than earlier forecasts had expected, in part because of record-high oil prices. Ironically, by the time inflationary expectations caught up in 2008, actual inflation had plunged as a result of the global economic crisis. A holder of TIPS would have had almost no protection against these inflationary oscillations.
Furthermore, some commodities are not actually commodities in the traditional sense but are prized as stores of financial value, such as gold, diamonds, and other precious materials. They also perform excellently as real hedges against inflation, especially in hyperinflation scenarios in which other market assets may do poorly as a result of economic mismanagement. The precious metals are a special category more akin to currencies driven by purely financial factors such as inflation, real interest rates, and investor demand rather than they are like commodities whose price is driven by supply and demand fundamentals.
Commodity Beta
To conclude, despite the vast increase of portfolio investment and interest into purely financial long-only exposure to commodities, the “beta” case for commodity portfolio investment rests on relatively shaky grounds. In terms of uncorrelated or negatively correlated diversification complementing traditional equity and bond asset classes, commodity beta does not appear to perform particularly well, even against developed market equities. Furthermore, the long-term returns on commodities are zero or negative. The outstanding returns of commodity indices in the 2000s is actually a function of a supercyclic upswing in equilibrium prices due to emerging market economic growth. This outperformance should not be misconstrued as a permanent source of beta outperformance.
However, commodity beta may hold some value to long-term investors by providing a valuable source of protection against inflation. This includes not only the direct inflationary exposure to commodities—such as food and energy—but especially protection against unexpected inflationary shocks, a source of portfolio risk that other asset classes, including inflation-protection securities, struggle to protect against.
 =
=  .
.