The following is reprinted with the permission of the Author, S. James P. Spottiswoode, Cognitive Sciences Laboratory, Palo Alto, California. It originally appeared in The Journal of Scientific Exploration, Vol II, No. 2, 1997.
APPARENT ASSOCIATION BETWEEN EFFECT
SIZE IN FREE RESPONSE ANOMALOUS
COGNITION EXPERIMENTS AND LOCAL
SIDEREAL TIME
S. James P. Spottiswoode
Cognitive Sciences Laboratory, Palo Alto, CA 94301
Abstract
Nothing is known about the physical mechanism of anomalous cognition (AC), or ESP. A first step towards generating focused hypotheses would be the discovery of a physical parameter, which clearly modulated AC performance. In this paper, an association between the local sidereal time (LST) at which a trial occurs and the resulting effect size is described. In an existing database of 1,468 free response trials, the effect size increased 340% for trials within 1 hour of 13.5 h LST (p:0,001). An independent database of 1,015 similar trials was subsequently obtained in which trials within 1 hour of 13.5 h LST showed an effect size increase of 450% (p:0.05) providing confirmation of the effect. Possible artifacts due to the non-uniform distribution of trials in clock time and variations of effect size with experiment are discussed and rejected as explanations. Assuming that some unknown systematic bias is not present in the data, it appears that AC performance is strongly dependent upon the LST at which the trial occurs. This is evidence of a causal connection between performance and the orientation of the receiver (i.e., a term for subject or participant), the earth and the fixed stars.
Introduction
Over the last decade of research into anomalous cognition (AC), a new term for extrasensory perception or ESP, considerable progress has been made toward understanding the experimental factors needed to ensure that the effect is observed. In fact the question of existence can now reasonably be said to have been answered positively (Utts, 1996.) In contrast, little headway has been made in understanding the mechanism of the information transfer in physical terms. Currently there are no known physical parameters, which unambiguously modify AC performance, and the discovery of such a variable would be a first step to elucidating the physical mechanisms involved.
From a physics point of view, a puzzling feature of anomalous cognition is that there is no evidence that performance falls off with the distance between receiver and target over separations up to several thousand kilometers (Puthoff and Targ, 1976; Dunne et al., 1989). More problematic still, the evidence for precognitive AC is strong and performance in this situation is comparable to that in real-time protocols; Dunne et al., (1989) show that effect size in their database is independent of the interval between remote viewing session and target definition over a range of ±150 h. Recently, a theory has been developed by May et al. (1995), which explains another class of parapsychological experiments involving attempts to "influence" random systems, in so-called micro-PK experiments. Their model proposes that the results of these experiments are due to a weak precognitive information channel as opposed to a force-like interaction. Thus in looking for some underlying mechanism that might explain all these data, it appears that precognition is a good possibility: the notion encompasses micro-PK effects and precognitive AC results. Data from real time protocols can also be explained by precognition if it is assumed that the signal source is the eventual observation of the correct answer.
Given these properties of the putative physical carrier responsible for anomalous cognition, it is not obvious where one would look amongst known physics for a model or for an extension of fundamental theory that would allow for these effects. It has been suggested that the non-local correlations of quantum mechanics might be used to explain AC (Walker, 1975), but the fact that these correlations do not permit causal signaling rules them out as a mechanism. In searching for a model, knowledge of a physical variable, which modified the performance of the AC channel would be extremely useful.
It is outside the scope of this paper to review the research on physical modulators of AC, but mention will be made of the two most prevalent in the literature. There is weak evidence that performance is enhanced by screening electrical fields with Faraday cages (Tart, 1988) and that it is improved during periods when the geomagnetic field is relatively quiescent (Spottiswoode, 1993). More attention has been paid to the latter effect, but the correlation of AC with the geomagnetic field fluctuations, if it exists at all in laboratory data, is very small. For instance, in the extensive collection of trials examined in this paper the correlation between the ap geomagnetic index and AC effect size is small (Spearman's p:-0.05, n:2,483, p:0.01) though in the hypothesized direction. The possibility that performance is affected by a globally averaged parameter like the geomagnetic indices suggest that it might be fruitful to broaden the search for a physical variable describing the environment of the receiver, such as electric or magnetic fields, to the larger scale.
Consider how the data of anomalous cognition might have been approached if, instead of emerging from a protocol based in the psychological sciences, these signals had appeared as sporadic bursts of information from a complex physical experiment. In that case, the effort to find the source of the unexpected signals would have progressed from local sources of noise to an examination of whether the noise was correlated with activity outside the laboratory. A useful technique for achieving this would be to examine whether the sporadic noise were correlated with local time, which might indicate that power fluctuations, ground vibration or other human activity tied to local time were responsible. Failing that, it would be natural to see if the noise were correlated with sidereal time, indicating a cosmic origin. Pulsars were in fact discovered in just this manner. This paper asks this latter question of the AC data and thereby takes a first step in addressing the question of whether performance is dependent upon the receiver's orientation relative to the fixed star background.
The Anomalous Cognition Data
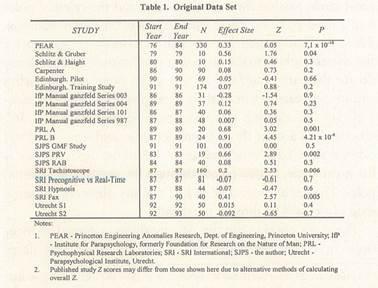
To search for a potential physical correlate of AC functioning requires either large numbers of prospective studies or the retrospective examination of existing data which was collected for other reasons. As collecting high quality anomalous cognition trials is time consuming and expensive, there is a motivation for using existing data where possible. The author had already assembled a database of free response data for another purpose and a subset of these data were suitable for this study; from now on, this will be referred to as the original data set. This original data set comprised results from 22 different studies, which utilized either remote viewing or the ganzfeld protocol and for which exact times, dates and locations of the trials were known. The 1,524 trials in these studies were collected in various laboratories by different experimenters over the last 20 years and are shown in Table 1. Most of these studies have been published in peer reviewed journals, conference proceedings, or laboratory reports. It should be emphasized however, that this collection is not exhaustive of remote viewing and ganzfeld experimentation. The criteria for inclusion in the original data set were merely that the laboratory was able to provide data at the trial level with time, location and score, and that the experiment was of a free response design. The criterion of free response was established in order to collect data with the highest possible effect size and thus maximize the efficiency of the search for a physical correlate. It should be noted that the division into studies was based purely upon the way the experimenter presented the data. In several cases data from a single protocol was presented as a number of experiment series, or studies, while in fact the publication they may have been presented as a single experiment. In some cases the division into series may correspond to a division by receiver, in others to a division by time period.

The contributing laboratories included most of the major centers where free response AC work has occurred. One of the data sets used here, that from the Princeton Engineering Anomalies Research (PEAR) group, has been subjected to some methodological criticism (Hansen et al., 1992; Bobyns, Y., 1992). However the effect size and associated 95% confidence interval of the PEAR data fall within the range reported by other free-response investigations (Utts, 1996b; Radin, 1996). Therefore, their data were included in the original data set.
This paper examines a relationship between AC performance and the receiver's orientation relative to the celestial sphere and therefore the appropriate celestial coordinate system is briefly reviewed. Directions in the sky are conventionally measured with respect to a coordinate system defined by the earth's rotational axis and equatorial plane. The celestial equator is the projection of the earth's equator onto the sky and the declination of an object is defined as the angle north, or south, of this great circle. An object's right ascension, or RA, is defined as the angle around the celestial equator between the great circle passing through the object and the celestial poles and a fixed point on the celestial equator, the vernal equinox. Thus, declination and RA comprise a coordinate system for the celestial sphere in the same way that latitude and longitude do for the earth's surface. At any given point on the earth's surface the stars return to their same positions after one sidereal day has elapsed, this day being approximately 3' 56" shorter than a solar day.[5] At any location and time, the local sidereal time (LST) is defined as the RA of the meridian that is the great circle, which passes through the zenith and celestial poles. Thus at a same value of LST for any observer, the same strip of sky will be directly overhead.
The trials comprising the AC database occurred at locations in North America and Europe at times and dates determined by the scheduling of those experiments and entirely unconnected with the purpose of this study. As such they occurred mostly during normal working hours, at various times of the year and therefore covered the whole range of LST values. However, the range of latitudes at which these experiments occurred was quite limited, nearly all the data being taken between 32 and 55 degrees North. Thus the range of declination was similarly restricted. This study therefore sought to examine whether there was any relationship between LST and AC performance.
Method
The received data was first filtered to eliminate cases where the local time was omitted or location information was either absent or very approximate. One entire experiment was removed from the original data set since reliable time information for each trial was not available. This winnowing reduced the data to 1,468 trials from 21 studies for the original data set. SLT values for all trials were calculated from the longitude and given local time of each trial. It should be noted that the time data given by the various experimenters is probably that of the start of each AC trial and may differ from the time of the actual mentation by a few minutes to as much as a quarter of an hour. The majority of trials occurred in laboratories in cities and towns and the longitude for these trials was taken from the values for the city given in an atlas. Local times were corrected for daylight savings time and used to calculate LST by means of the program Xephem version 2.9. As a check, LST values for several randomly chosen points were hand calculated to confirm the accuracy of the software.
The AC score data for the trials was delivered from the various experiments in one of two forms. In some cases an effect size for each trial had been calculated from a quasi-continuous measure used in the experiment. These values were used in this analysis without further processing. In other cases, the trials had been assessed by a ranking procedure in which either the receiver, in the ganzfeld experiments, or an Analyst, in the remote viewing experiments, had rated the receiver’s description against the actual target and a number of decoy targets in a blind judging procedure. These trials therefore were scored as a rank, where a value of 1 indicated that the actual target was rated as the closest fit to the receiver’s description, 2 as the second closest fit, and so on. These ranks were converted to trial effect sizes by means of the formula:

Where rMCE is the mean chance expectation rank, rOBS is the observed rank and N is the number of targets used in the ranking procedure. In a few experiments the scores were reported both as quasi-continuous scores obtained from receivers estimating their preference for the target on a scale and as rankings. In these cases the effect sizes calculated by the experimenter from the continuous measure were used rather than computing an effect size from the rank since it is likely that the continuous measure contains more information about the degree of match between description and target than does the rank.
Results—Original Data Set
The original data set had an overall mean effect size of 0.148 (n:1,468), corresponding to a Stouffer's Z:5.99, (p 7 x 10⁻⁹), while individual study effect sizes ranged from –0.28 up to 0.56. These data were collected into 1-hour wide bins of LST and the mean and standard deviation of the effect size data for each bin were found. An increase in the mean effect size for trials occurring between 13 and 14 h LST was observed. The data are shown boxcar smoothed in Figure 1 where the mean effect size for data points within a 2-hour wide window, moving in 0.1-hour steps, is plotted. When calculating these and subsequent smoothed plots the data set was padded with two copies of itself where the time values were 24 h later and 24 h earlier than the actual time. Thus the averaging occurred over a 2-hour window also for points at the ends of the plots. The dashed line in Figure 1 is the average effect size and the error bars correspond to (1 standard deviation (SD).
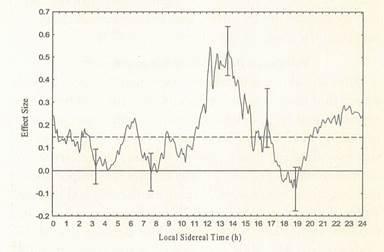
The local sidereal time corresponding to maximum effect size was estimated by computing the centroid of the subset of the data comprising the upper half of the 12 h to 14 h peak and gave a value of 13.47 h. To assess the significance of this deviation from the average effect size of the whole data set, various values of time intervals around 13.47 h were taken and the main effect size of these subsets compared to that of the remainder of the data. The results are show in Table 2 where the gain is calculated as the ratio of the effect size within the chosen time range to the effect size for the complete data set. The t values shown compare the data in the subset around the peak with the remainder of the data. For instance, the trials, which occurred within ±1 hour of 13.47 h, showed an average effect size of 0.507 (n:83) as compared to the complete data set effect size of 0.148, an increase of effect size by a factor of 3.42.
Table 2. Original Data.

It appears therefore that the trials occurring within ±3.0 hours, or less, of 13.47 h are significantly different from the remainder of the data and the observed effect size increases the closer the trial time to 13.47 h.
Validation Data: Collection and Results
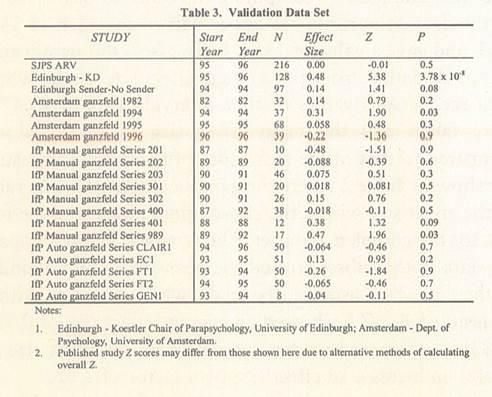
After the above analysis was completed, it was hypothesized that there was an approximately three to four times enhancement in anomalous cognition effect size for trials occurring near 13.5 h local sidereal time. In order to test this hypothesis against a new set of data, laboratories were contacted with a request for any further free response data meeting the same criteria as used for the original data set. Table 3 shows an additional 23 experiments, which were received comprising 1,015 trials. This data set also shows evidence of AC with an overall effect size of 0.085 (n:1,015), yielding a Stouffer's Z:2.70 (p:0.004)
NOTES:
1. Edinburgh Koestler Chair of Parapsychology, University of Edinburgh; Amsterdam Dept. of Psychology, University of Amsterdam.
2. Published study 2 scores may differ from those shown here due to alternative methods of calculating overall Z
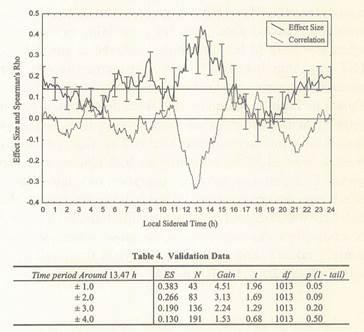
These new data were processed through the same analysis as used with the original data set and a smoothed plot of the validation data, using a 2-hour averaging window as before, is shown in Figure 2 along with the original data set for comparison and ±1 SD error bars. The validation data set also has a broad peak in effect size near 13 h and the LST for maximum effect size was found to be 13.47 h, identical to the value found from the original data set. The effect sizes as a function of window width around 13.47 h for the validation data are shown in Table 4.
Results–Combined Data Sets
Given that the effect sizes and gains shown here for the validation data set are close to those from the original data set and that the LST values corresponding to maximum effect size are not different, it seems reasonable to conclude that the hypothesized peak in effect size has been confirmed in the validation data set. The data sets were therefore combined and the analysis repeated for all the data taken together. In this case the overall effect size is 0.122 (n:2,483) for a Stouffer's Z:6.09 (p:6 x 10¹⁰). Using the same methods as before, the LST for maximum effect size was found to be 13.47 h. The complete data set is plotted with a 2-hour wide averaging window and ±1 SD error bars in Figure 3, with the mean for the whole data set dashed. In a Monte Carlo test the effect sizes were randomly permuted with respect to the time data and the means of all 2-hour wide windows with centers spaced at 0.1-hour intervals were computed. In 10,000 such runs 14 produced a window mean effect size at some value of LST, which was greater than or equal to that seen in the actual data. Thus the probability of finding an effect size peak of the magnitude observed at any value of LST was estimated to be 0.0014. The increase in effect size observed in time windows centered on the maximum is shown in Table 5. As can be seen from these data, it may be possible to increase effect size in AC experiments as much as four-fold by timing them near 13.5 h. The width of the 13.5 h peak was -±1.25 h, measured at half height above the mean. This plot also shows a suggestion of a minimum of effect size occurring near 18 h. It is worth noting that although the data used here are very disparate, both in terms of study effect size and protocol, the subset which were accidentally taken within ±1 h of 13.47 h yield an overall significance of Z:5.20, p:1 x 10⁷(n:124).
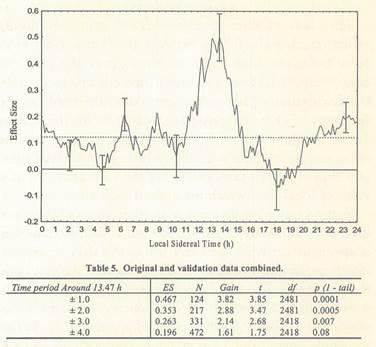
Table 5. Original and validation data combined.
Replication across studies
To check whether the 13.5 h effect replicated across these studies, the effect size in the region of 13.5 h, and outside this time interval, was calculated for each study. Owing to the small numbers of trials in many of the studies, 15 of the 41 total studies failed to have any data falling in the 13.5 h peak, taken here as 13.47 ±2 h, while one experiment had all its data on the peak and none elsewhere. This study contributed 10 trials with a mean effect size of 0.147. Of the remaining 26 studies, with data both on and off the peak, 18 had a mean effect size on the peak greater than mean effect size for the remainder of the data (p:0.02). There is evidence from other types of parapsychological research that receivers at times significantly miss targets and it is worth noting that 25 out of the 26 studies with data on and off peak had a greater absolute magnitude of effect size on the peak (p:4 x 10⁷).
Possible Artifacts
The trials in these studies occurred primarily during office hours, 81% falling between 0900 and 1700 local time. Since the trials occurred throughout the year, the conversion to LST for each trial time effectively smeared the distribution of trial times approximately evenly across the range of LST. One possible explanation for the peak at 13.5 h would be provided if two things were true: that the effect size in this data was dependent on local clock time, and that the trials responsible for the LST peak fell at a value of local time which maximized their effect size.
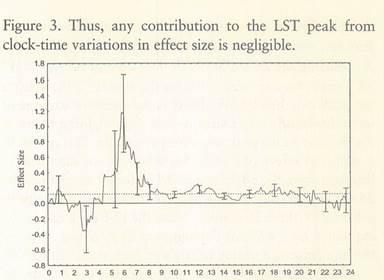
Figure 4 shows the distribution of effect size as a function of local clock time with the mean of the whole data set dashed. It is apparent that while the effect size in this data is approximately independent of clock time over most of the day, there is an increase in effect size at 6 h; however, this is due to only 4 data points, 3 of which are from one experiment (PEAR) which had a relatively high average effect size of 0.33. In fact the whole region from 3 A.M. to 8 A.M. contains only 18 trials and with such a small number of data points no reliable estimate of the behavior of effect size versus clock time in this period can be made. Four trials from this period fall in the 13.37 ±2 h LST peak and cannot significantly influence the statistics of the 217 trials comprising this region of LST. Apart from this early morning period, the clock-time distribution is statistically flat.
As an alternative way of looking at the impact of the variations in effect size with local time, the data was normalized to remove the variation with clock time. This was achieved by subtracting from each trial's effect size the difference between the overall mean of the data set and the mean for the data in the 1-hour clock time bin containing that point. This normalized data set therefore had a uniform effect size when plotted against clock time in 1-hour bins. When plotted against LST it produced a plot, which was virtually indistinguishable from the un-normalized plot shown in Figure 3. Thus, any contribution to the LST peak from clock-time variations in effect size is negligible.
Another possible artifact could be created by an interaction between experiments of differing effect size with restricted ranges of LST values. Due to the slow drifting of LST versus solar time at approximately four minutes a day, an experiment which was scheduled to collect data at the same time every day for, say, a month would produce a data set that all fitted within a two hour slot of LST. If this were an experiment which, for other reasons, produced a high effect size, and where the scheduled times fell near 13 h LST, then the apparent increase of effect size observed at that value of LST would be explained by the arbitrary timing of such a high effect size experiment.
Before addressing this potential artifact, it is worthwhile clarifying some assumptions implicit in this retrospective analysis. It is being assumed that the effect size in an anomalous cognition trial is a function of several parameters: ES:F(LST,R,E,X). Where R is the type of receiver, expert or novice, E is the experimenter, X represents all other unknown sources of variance and F is an unknown but fixed, function. It is also being assumed that in any one experiment R and E were held constant and that R, E and X are not functions of LST. Under the null hypothesis of no LST effect it is presumed that the variation in effect size between studies is due solely to differing values of R, E and X. Utilizing the 26 studies with data on and off the 13.47 ±2 h peak, the expected value for the average effect size on the peak can then be calculated as the weighted average of individual study effect sizes, where the weighting factor is the number of on-peak trials for each study. This results in a weighted effect size of 0.154, which is not significantly different from the effect size of 0.148 for all the data in the 26 studies. In contrast, the observed effect size on the peak is 0.342 for these 26 studies. Thus, the LST peak cannot be explained by fortuitous combination of R, E and X, or by the happenstance timing of trials in each study. Since LST is a linear function of local solar time and the day of the year, there remains the possibility that some undiscovered systematic relationship between effect size and these variables might be responsible for the observed peak.
Discussion
Evidence has been given to support a relationship between the local sidereal time, at which an anomalous cognition experiment occurs, and the resulting effect size. The primary association is an approximately four-fold enhancement in AC effect size at 13.5 h LST. This association was found in one large data set and confirmed in another, each set comprising AC experiments with a range of free response protocols, from different laboratories and investigators. It is likely that the increase of effect size for AC trials occurring at 13.5 h LST is real, replicable across different laboratories and occurs in the diverse protocols of the ganzfeld and remote viewing experiments.
The discovery of this effect was motivated by the search for a physical parameter, which unambiguously modulated AC performance. What classes of mechanism are suggested by the LST effect found here? The prima facie implication is that a causal relationship exists between an unknown influence at a fixed RA in the sky and AC functioning. Such an influence must originate from outside the solar system since within the heliopause the interplanetary space environment is dominated by solar and planetary effects which would not be locked to a fixed RA. Similarly, all known solar system objects have varying positions in the sky; only objects as remote as Neptune and Pluto have moved less than 3 h of RA during the data collection period of this analysis. As to the nature of the influence at fixed RA, there are a wide range of signals potentially available to the appropriate detector at the earth's surface, which are locked to sidereal time. Most of the electromagnetic spectrum from gamma rays through low frequency radio have known cosmic sources. There are also particle fluxes from discrete sources. It may be possible to single out amongst all these emissions a factor at 13.5 h RA, which is associated with the effect described here.
A noteworthy feature of the 13.5 h effect size enhancement is the narrowness of the peak, which was ±1.25 h to half height. As was noted earlier, the trial time data used in this paper may differ from the actual time of the receiver's mentations. Such errors would broaden the peak and the actual effect may therefore be more time sensitive. This argues against the hypothesis that the increase in effect size is due to a region of the sky simply being above the horizon, since if this were the case the peak would be much wider. If the LST effect were dependent on the altitude of a source, then one would expect the width of the peak to be dependent on latitude. Interestingly, when the 13.5 h peak is examined for data taken at high latitudes versus low latitudes there is a suggestion that the peak is narrower for the high latitude data, but this analysis is confounded by the fact that particular laboratories and protocols are being selected by the latitude division. Further work in this direction must await a data set collected with accurate timings of the receiver's mentations, using a consistent protocol and over a wide range of latitudes.
Another implication of this LST effect is that some property of the earth is important to AC functioning. For instance, one class of models that would be consistent with the LST effect would posit an AC-enhancing signal from a direction in space associated with RA:13.5 h and that this signal was at least partially blocked by the earth. An alternative class of models would postulate a signal from a direction opposite to 13.5 h RA acting as an AC inhibitor, though this would result in a broader peak than observed. While it is clearly impossible to reach any conclusions about the mechanism of this effect it would seem that any model must include the earth as a causal part of the mechanism, either as an absorber or reflector. In this regard it is interesting to note that there is evidence that AC performance does not decrease with the distance between target and receiver, at least up to separations of several thousand km and these long-range tests demonstrate that no difference in AC performance is made by interposing the earth between receiver and target.
Assuming that this effect replicates in prospective tests, it will have some important consequences aside from its impact on theory. Parapsychology has struggled to establish its main effect, anomalous cognition, in part because of the small effect size seen in these protocols. The fourfold increase in effect size produced by timing trials at the optimal value of LST will make a considerable difference in designing proof-oriented experiments as well as increasing the statistical power of any experiment looking for other moderating factors.
Much further work needs to be done to elucidate this effect. Prospective tests of the relationship between AC effect size and LST need to be undertaken and in designing these it would be useful to collect data at a range of times around the 13.5 h maximum so that the exact shape of the peak can be found. It may also be important to collect AC data at a wide range of latitudes to see if AC effect size is related to the declination of the zenith at the site of the trials. Evidence of a maximum in effect size versus latitude would suggest that a limited region of the sky, bracketed in both RA and declination, were responsible for modulating anomalous cognition performance.