The following is reprinted with the permission of the Author, S. James P. Spottiswoode, Cognitive Sciences Laboratory, Palo Alto, California. It was originally submitted to The Journal of Parapsychology, in 1998.
GEOMAGNETIC FLUCTUATIONS AND FREE
RESPONSE ANOMALOUS COGNITION:
A NEW UNDERSTANDING
James Spottiswoode
Cognitive Sciences Laboratory, Palo Alto, California
Abstract
Efforts to establish whether a correlation between anomalous cognition (AC) performance and geomagnetic fluctuations (GMF) exists have met with mixed results, a negative correlation being seen in some studies and not in other comparable ones. Confirming this observation, in a large database of 2,879 free-response trials the Spearman's p correlation between the ap geomagnetic index and AC effect size was -0.029 (p:0.06). However, a large increase in the magnitude of the correlation was found at approximately 13 hours Local Sidereal Time (LST), the longitudinal-like astronomical coordinate for the portion of the celestial sphere that is directly overhead at the time of the viewing. This sharp increase of correlation may be connected with an earlier result: that the AC-effect size increases by 380% within ±1 hour of 13.5 LST. The correlation observed here for trials which occurred between 11.2 h and 14.8 h LST was -0.192 (N:256, p:0.002) while the correlation was effectively zero (p:-0.01, N:2,623, ns) elsewhere. The maximum magnitude correlation of -0.33 (N:134, p:0.0001) was observed in the 12.9 (1 h LST period. The negative correlation peak was confirmed in both the ganzfeld and remote viewing protocols and was homogeneously present in those individual studies with trials in the relevant sidereal time interval. This finding allows an understanding of a previous anomaly in the literature: the varying correlations to GMF found in different studies. For instance one large remote viewing study showed near zero overall correlation since few of the trials occurred in the critical time period. In another case a comparable study had a large correlation of -0.22 and by happenstance all the trials were conducted near 13 h LST.
Introduction
For some years there has been speculation that anomalous cognition (AC) performance may be correlated with global geomagnetic field (GMF) fluctuations. This idea arose from the work of Persinger (e.g. 1988) who found that anecdotal cases of putative AC occurred on days when GMF fluctuations were significantly lower than on the preceding and following days. Many workers have investigated whether this interesting observation could be extended to laboratory anomalous cognition, but with mixed results. Tart (1988) and Persinger & Krippner (1989) found an association between high scoring AC trials and low GMF fluctuations, while Haraldsson and Gissurarson (1987) and Nelson & Dunne (1986) did not. In an unpublished meta-analysis this author collected 1,468 free response trials from 21 studies reasoning that the effect, if it existed, would be most easily detected in a large database with high effect size; in fact the overall correlation was a disappointing -0.0002 (Spearman's p, N:1,468, ns).
The first step to understanding the physics of anomalous cognition will probably be the discovery of physical variables that unambiguously modulate the effect. In searching for a new approach to the problem of finding such physical variables the author was led to consider whether the orientation in space of the subject might be a factor. Recently it has been shown that there is a relationship between free-response effect size and the Local Sidereal Time (LST) at which a trial occurs (Spottiswoode, 1997). In a database of 2,483 free response trials with a mean effect size of 0.122 overall, those trials that occurred within -±.1h of 13.5 h LST showed a 380% increase in effect size. In light of this, it was considered worthwhile revisiting the correlation between anomalous cognition performance and geomagnetic fluctuations but including LST as a filtering variable.
Method
Data Sets
The data consisted of 51 free-response studies comprising 2,879 trials, with a mean effect size of 0.140 and resulting Stouffer's Z of 7.503 (p:3.1 x 10⁻¹⁴). These records were elicited in response to a request for formal experiments (i.e. excluding exploratory trials) that were of free-response design and for which trial time, date, location and score were available. The data falls into two broad groups of protocols. The first includes most of the ganzfeld work done since the 1980s, comprising the complete data from The Psychophysical Research Laboratories, and partial data from The Institute for Parapsychology, the Amsterdam Psychology Department, the Utrecht Institute for Parapsychology and the Koessler Chair at Edinburgh University. The other major grouping consists of remote viewing trials and consists of the work of the Princeton Engineering Anomalies Research, a partial set of data from SRI International and Science Applications International Corporation, experiments by M. S. Schlitz and remote viewing experiments by the author. An exception to this division by protocol is Carpenter's work, which was obtained in a psychotherapeutic setting. The PEAR remote viewing experiments have been subjected to some methodological criticism (Hansen et al, 1992; Dobyns, Y., 1992) but they are included here since the effect size observed is comparable to that seen in other laboratories using a similar protocol.
This data set is not exhaustive of free response experimentation, though it likely comprises more than 80% of all such work done in the U.S. and Europe during the last two decades. Rather the data collection effort is part of an ongoing research effort to elucidate physical factors in AC and it is expected that more trials will be added as they are excavated from archives.
Analysis Technique
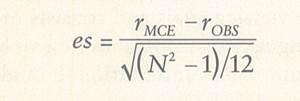
Each trial's time was corrected for daylight savings time, where appropriate, and converted to Universal Time Coordinated (UTC). Geographical coordinates for the trials were obtained from the gazetteer of the Rand McNally International Atlas and this data, with the UTC timings, were used to compute the local sidereal time of each trial. Geomagnetic index data for the op index was obtained from the National Geophysical Data Center as the "Lenhart" data files. The anomalous cognition data was delivered with a time for each trial and a score, given either as ranking made from within a number of choices, or as a trial z-score or effect size. In those cases where a trial effect size was given it was used directly, but when only a ranking was available, it was converted by the standard formula to an effect size:

Where rMCE is the mean chance expectation rank, rOBS is the observed rank and N is the number of targets used in the ranking procedure.
In the case of many of the ganzfeld trials, such as those using the auto-ganzfeld protocol, the mentation period commenced after a relaxation, or induction tape lasting 15 minutes had been played. In those experiments where this was known to be the case, the stated trial time was adjusted forward by 0.25 h.
The ap< index is reported for 3 hour intervals of universal time and the correlation coefficients reported here were calculated between the ap index for the 3 hour interval encompassing the trial and AC effect size. In all cases the rank order based, Spearman's p correlation function was used, rather than Pearson's r to allow for the statistical properties of the ap index (Spottiswoode, 1993).
Results
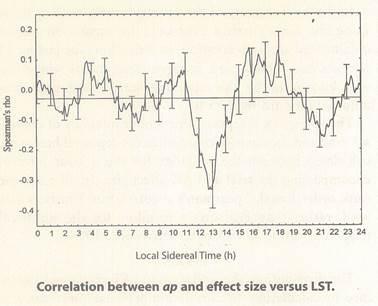
The distribution of correlation in LST space was examined by calculating the correlation between effect size and ap in 2 hour wide windows of LST. This calculation was repeated for windows spaced 0.1 h apart for all values of LST from 0h to 24 h. To ensure that windows with their centers in the 0 to 1 h and 23 to 24 h time intervals had a complete set of trials, the LST data was padded with two copies of itself, with the sidereal times advanced and retarded by 24 hours. Figure 1 shows the resulting correlation data plotted against the window center time. The overall correlation of the data (p:-0.029, N:2,879, p:0.06, 1-tailed) is shown dashed. The error bars show the estimated standard deviation of the correlation coefficients (Hedges & Olkin, 1985) calculated as:


The correlation between AC and ap geomagnetic index turns out to be strongly dependent on the region of sidereal time considered and there exists substantial correlation near the 13 h point where the maximum effect size was found. The maximum magnitude correlation of -0.33 (N:134, p:0.0001) occurs at 12.9 h, in approximate agreement with the maximum of effect size for this data at 13.3 h. Elsewhere in LST space there is little correlation. Taking as the correlation region the period between 11.2 h and 14.8 h LST, where the correlation shown in Figure 1 crosses zero, the correlation in this "in-band" was -0.192, N:256, p:0.002, whereas the correlation outside was -0.010 (N:2,623, ns). It is interesting to see how this pattern replicates across the individual studies in the database. Table 1 shows the correlations observed in those studies that had five or more trials occurring within this in-band, in order of increasing standard deviation of the estimated in-band correlation.