2
FROM EMERGING TO EMERGED
It is striking how much has changed in just a decade, but also how little the original BRICs framework has altered. In all my analysis of world economies, amid all the information and hype, I have stayed focused on the benefits of an expanding, more productive workforce. While the 2001 paper turned out to be the beginning of years of research and analysis on those themes, and my colleagues and I have subsequently refined them, the framework itself has stayed the same.
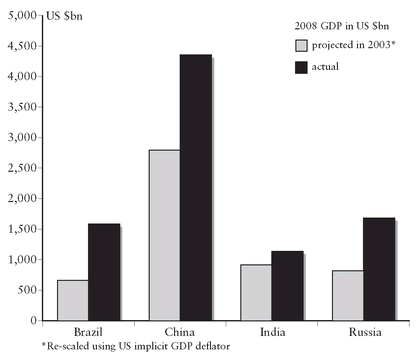
The BRICs have outperformed even our most optimistic scenarios, and on three occasions we have revised the paths first set out to 2050. The aggregate GDP of the BRIC countries quadrupled during the decade following my original paper, from $3 trillion to close to $12 trillion. In hindsight I should have been even bolder in my predictions.
Even though I had always known it from my basic economics training, I had not fully appreciated the simple but critical importance of demographics and productivity. In this chapter I lay out how we thought about both these factors as the BRIC story started to become more influential.
THE POWER OF DEMOGRAPHICS
I wasn’t the only one who didn’t pay enough attention to demographics. In European business and policymaking circles, I often hear people talking enviously about growth in the United States versus Europe, or with astonishment at the growth in India and China. A lot of it is due to the demographics. Simply applying the most credible estimates of long-term demographic trends, especially for the working population, is the intellectual cornerstone of the argument for the BRICs’ potential.
Between them, the four BRIC countries are home to close to 3 billion people, not far off half the world’s population. In some ways, it shouldn’t be that much of a surprise that anyone should think they would be the potentially largest economies; the world’s largest populated nations probably should have the biggest economies. Certainly, in order for their people to enjoy the wealth that many throughout the rest of the world enjoy, they would need to have big, successful economies. As the late Angus Maddison, a recognized expert on the history and analysis of economic growth and development, has shown, the two most populous countries, China and India, in the past constituted a much bigger share of global GDP. In his pathbreaking analysis of economic history, Maddison showed that China dominated the world between the tenth and fifteenth centuries in terms of both size and wealth.
1 For centuries until then, India was the dominant economy and, at times, the two countries’ combined share of global GDP was above 50 percent.
Why couldn’t it happen again? I believe it will.
Of course, the four countries are very different. Not all of them will necessarily succeed. China and India are the two huge nations, with populations more than four times the size of the United States. If China’s and India’s working populations could ever be as productive individually as America’s, then in simple terms they would be four times bigger economically. Brazil and Russia have much smaller populations than China and India, with around 180 million and 140 million, respectively, but this is more than any country in Europe, and indeed more than the 125 million or so in Japan. In its most simple sense, this means that they could be bigger economies.
When I was studying geography and economics at university in the mid-1970s, the United States had a population of around 200 million. Today it is 300 million. This fact alone goes a good way toward explaining why the United States has grown so much more than Europe. More working people make an economy easier to grow, unless of course they are extremely unproductive (as can be the case in many developing economies). More people produce more output. More people earn wages and income, which is the basis for their consumption. This is a pretty straightforward fact of economic life—and one that is essential to consider when thinking about the BRICs.
THE POWER OF PRODUCTIVITY
The other essential driver of growth is productivity. The more a group of workers can produce with a given set of inputs, from time to materials, the faster their economy will grow. Assuming that workers in developed countries are already highly productive, for reasons ranging from more advanced technology to better infrastructure and health care, workers in less developed countries have a lot more opportunity to catch up to them if they can fulfill their potential.
The scale of the opportunity for productivity growth is much larger in developing countries than in developed ones. The economics profession frequently complicates this fact, but it really is this straightforward. Countries with young and expanding labor forces, which are becoming increasingly efficient, will show the largest gains in real GDP. The major reason the United States outperformed Europe economically from 1980 to 2010 was that it had more people entering the workforce and working longer hours. Americans were not dramatically more productive; there were just more of them working harder. As I looked at the BRICs, it seemed likely that a similar pattern would emerge in these four countries, on an even more dramatic scale.
In the November 2001 paper, I showed via simple extrapolation that as soon as 2010 the combined GDP of the four BRIC countries was likely to become a bigger share of the world’s GDP under almost any assumptions. I presented four different scenarios for how the decade could evolve, and demonstrated how the BRICs’ combined GDP was likely to increase to anywhere between 9 percent and, more probably, over 14 percent of the world total. It seemed quite clear to me then that, under any of the four scenarios, they should play a bigger role in global decision making. In fact, it seemed so obvious that I wondered why no one else had thought of it.
Many people have quizzed me about the thinking behind the BRIC thesis, and on a basic level I often find it amusing that it is considered so profound. Four big populations becoming more productive and engaging with the rest of us in a way they hadn’t previously: if they carried on doing the same, they were going to be big, plain and simple.
My colleagues Dominic Wilson and Roopa Purushothaman had helped to push the BRIC concept firmly into the mainstream with their 2003 follow-up paper “Dreaming with BRICs: The Path to 2050.” What they did so effectively was to compare the BRICs in 2050 to the then current world economic superpowers. “If things go right,” they wrote, “in less than forty years, the BRIC economies together could be larger than the G6 in dollar terms. By 2025 they could account for over half the size of the G6. Of the current G6, only the U.S. and Japan may be among the six largest economies in U.S. dollar terms in 2050.” Their vision of a transformed world economic order seized people’s attention.
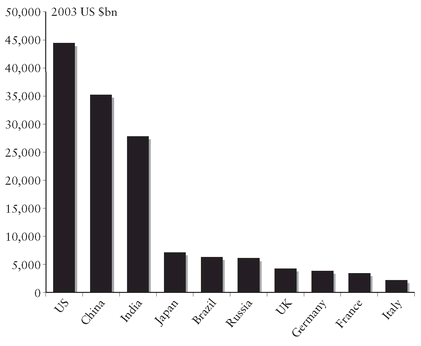
A simple chart they produced showing what they expected to be the largest economies in the world by 2050—with China first, followed by the United States, India, Japan, Brazil, Russia, the UK, Germany, France and then Italy—was downloaded from the Goldman Sachs website ten times more often than any other document. It started to appear in corporate planning presentations everywhere. It propelled the reputations of both its authors, giving a huge boost to Dominic’s reputation and making Roopa a superstar in India, and was the beginning of my transformation from being a forex guy to being at the center of frequent fascinating discussions about the world economy and its development.
“Dreaming with BRICs” broke GDP growth down into three components: growth in employment, which depends largely on growth in the working-age population; growth in the capital stock, or the accumulated capital available for investment; and technical progress, a measure of productivity. Translated into nominal U.S.-dollar GDP, a final major determinant of GDP growth is an appreciating currency in real (inflation-adjusted) terms. The research here made use of a foreign exchange model I had developed in 1995, the Goldman Sachs Dynamic Equilibrium Exchange Rate (GSDEER), to explain how currencies move. The model assumes at its basic level that the strength of a currency will reflect its relative purchasing power and relative productivity. I found that GSDEER explained much of the yen’s appreciation through the 1980s and 1990s. It would probably contribute to the future of the BRICs too, if they were productive. Today a middle-income worker in India still cannot afford what a middle-income worker in America can. As India develops, though, these differences should erode, and Indians will be able to use their rupees to buy a similar amount of goods and services to their U.S. counterparts.
To forecast as far ahead as 2050, we did not simply take the past and extrapolate into the future. Instead, we tried to create a dynamic model to reflect the changes countries go through as they develop. For population, we used the long-term projections from the United Nations to estimate the age and size of the working population. This in turn allowed us to predict the number of people whose income would enable them to pay for goods and services, to buy houses, and to support those less fortunate, less able, or too young or too old to work. The model suggests that each of the BRICs will follow a different pattern. Russia’s demographics often seem as bleak as Japan’s or Italy’s, with an aging population and a low fertility rate. China’s seem currently comparable to those of other developed European countries. In contrast, those of Brazil and especially India seem very encouraging, and by the end of 2050 their working populations should make it considerably easier for them to grow at faster rates than either China or Russia.
Some observers often latch onto the cheerless demographic profiles of China and Russia, add to this evidence their rigid political systems and easily conclude that neither has a promising economic future. As I will discuss in more detail in the next chapter, these arguments miss some important and quite basic factors. Both China and Russia have undergone immense political changes in the past thirty years, and their movement away from rigid communist systems has released their labor forces to share in the challenges and benefits of the globalized world. Moreover, in the case of China, one must consider not just its population, but the changes in the way they live, notably a marked migration to the cities. Urbanization on the scale we are seeing in China is unprecedented and providing a stimulus to growth at least comparable to that of the industrial revolution in the United Kingdom.
The BRIC growth projections for each country vary because the four do not have comparable demographics. The profile and size of their working populations will change over time and, with it, their growth rates. It was by blending these projections with our assumptions on the speed of productivity convergence for each of the BRICs that we ended up with decade-by-decade growth profiles for each of them. None of the BRIC countries needs to sustain growth at the level of the past decade for them soon to become collectively bigger than the G7. Even with relatively modest GDP growth rates assumed for each, they will be collectively bigger than the United States before the end of 2020. From 2000 to 2010 China grew at an annual rate of more than 10 percent. That is unlikely to repeat in the coming years, but it needs to grow at “only” 7 to 8 percent per annum for its GDP to match that of the United States by 2027.
Those countries with older populations and consequently low fertility rates tend to be those with the slowest real GDP growth. The demographics of Japan and many of the larger continental European countries will exhibit more and more of those tendencies. In the next few decades to 2050, aging populations in much of the G7 will pose tremendous social challenges requiring considerable changes: less generous state pension fund provision, longer working hours and an increase in retirement age. The global credit crisis of 2008 and its aftermath have accentuated the need for these changes, as the fiscal positions of these developed nations have become so weak. The International Monetary Fund has published some excellent work on these problems, especially for many of the developed G20 countries. Seen against the costs of aging and health care, the amount governments spent on trying to halt the economic slump after the crisis appears quite manageable. These kinds of problems will doubtless affect the BRICs eventually, but not in the near future, which offers yet another reason to believe in their capacity to grow.
There are, of course, significant differences between the BRICs. In Brazil, China and India, we projected that a growing labor force would be a more important contributor to growth than in Russia, whose labor force is assumed to decline.
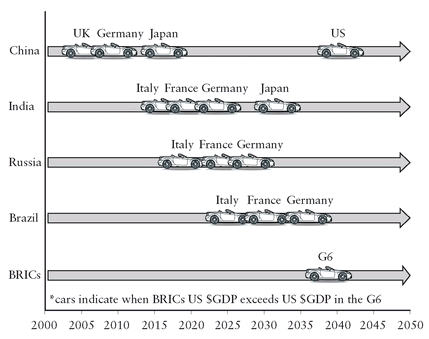
One graphic from the 2003 paper, reproduced here, depicts GDP growth as a race, indicating when the BRICs would be poised to win. The chart uses race cars to illustrate when the GDP of the four BRICs, individually and collectively, would overtake the members of the G6.
China, we predicted, would soon overtake Germany, then Japan, and eventually the United States by 2039. India might be the world’s third largest economy within thirty years. By 2050, only the United States and Japan, of the current G6, would still be among the world’s six largest economies. The other four would be the BRICs. As soon as 2040, we wrote, the combined GDP of the BRICs would exceed that of the current G6, a prospect that makes nonsense of the existing world economic and social order.
OVERTAKING THE G6:
When BRICs’ U.S.-Dollar GDP Would Exceed That of the G6
Source: Dominic Wilson and Roopa Purushothaman, “Dreaming with BRICs: The Path to 2050,” Goldman Sachs Global Economics Paper No. 99, October 2003
Given how the BRICs have surpassed the expectations of the race car chart, perhaps we used the wrong cars—or didn’t fill them with enough gas.
Of course, some of this could have been said many times in the past, so we decided to look back. If anyone had undertaken a similar exercise at various points in history, then presumably they might have reached similar conclusions to the ones we were making. How would the future have looked in 1960? We applied our methodology to eleven developed and developing countries (the United States, the UK, Germany, France, Italy, Japan, Brazil, Argentina, India, South Korea and Hong Kong), starting in 1960 and projecting their GDP growth for the next forty years as the available data allowed. We were encouraged by what we found. In general, the growth rates projected by our model turned out to be surprisingly close to what actually happened. The model was very accurate with the developed countries, it overestimated growth in countries where government policy impeded development, such as India, Brazil and Argentina, and underestimated growth in South Korea, Hong Kong and Japan. Those that had become both bigger and more successful economies had combined improving demographics with rapid improvements in productivity. Those that hadn’t been so successful had the benefits of the larger population but struggled to improve productivity.
The exercise helped broaden the base of our analysis even further by forcing us to consider the conditions for growth. Why had some countries managed to improve productivity when others hadn’t? For the BRICs to follow the growth paths we had laid out, we felt they needed some key ingredients: a stable macroeconomic background, supported by sound macroeconomic policies that were designed to keep inflation low and public finances in good order; strong and stable political institutions; openness to trade and foreign direct investment; adaptation of modern technologies; and, finally, high levels of education.
The main sensitivities in our model were the rate at which the BRICs would catch up to the developed world’s productivity levels, the investment rates in each country, and the demographics. We acknowledged that forecasting so far into the future carried all kinds of risks, and that any amount of bad policy or bad luck might make our forecasts redundant. But we decided that, on balance, our projections led to some important conclusions. We foresaw a radical rebalancing of the world economy, with growth in the BRICs offsetting the graying and slowing down of today’s advanced economies. We could see the patterns of world investment changing, with a huge demand for investment capital in the BRICs and the evolution of large savings pools in these countries, with dramatic implications for capital markets everywhere. Rising incomes, we believed, would accelerate growth in all kinds of industries as consumption patterns changed, which in turn would transform the demand for commodities. Global companies could benefit enormously from the growth of the BRIC consumer, but would be faced with fresh strategic choices between investing in countries that had the largest GDPs per se and those with the largest GDPs per capita, a question of the biggest versus the richest. And there were the regional consequences, with the BRICs’ neighbors looking set to profit from their ascent and accumulation of geopolitical influence.
The dramatic changes we were predicting were perhaps best summarized by the question with which readers were challenged at the end of the report: “Are you ready?”
GROWTH ENVIRONMENT SCORES
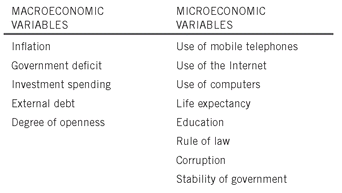
By 2005, when Dominic, Roopa and I, together with another colleague, Anna Stupnytska, wrote our next major review of the BRICs, we had evolved our understanding and measurement of their growth prospects even further by introducing a measure called the growth environment score (GES). We drew primarily on the World Bank’s World Development Indicators database to develop scores out of ten for thirteen categories. No ranking system like this can ever be perfect, but we felt it gave us a reasonable means of forecasting a country’s chances of converging on the developed world’s income levels. We thought it might keep us truly objective about the path to the future.
Economists believe that higher productivity is critical for sustaining growth and helping to improve welfare. What is not known is exactly what causes productivity to increase. If it were so easy, then growth would be more predictable, achievable and easy to attain. Many countries, developed and developing, might have risen to be on an economic par with the United States.
THE GES INDEX
The GES index consists of thirteen different variables, five macroeconomic in nature and eight microeconomic (see table). We simply average out the scores without giving one variable any more weight than another. To be more accurate, we should probably apply economic tests to each variable to assess its impact on productivity, and from this derive a weighting system. (Whether this would make a big difference to the scores is open to debate.)
Education is perhaps the most important variable in driving the working population to higher productivity. In our scoring system, we originally used a simple measure: average number of years young people spend in secondary education. From 2007 we began using the more accurate measure of net secondary school enrollment, i.e., the share of children of official school age that are enrolled in secondary school. We settled on our standard for its simplicity, comparability and reliability. It was measurable across many countries and seemed a reasonable predictor of economic success. Of the BRICs, Brazil, China and Russia appear to be more successful than India in terms of provision of the most basic education.
Linked to educational attainment is the use of technology, which also leads to faster productivity gains. In our GES index, we measure the use of landline telephones or mobile phones, personal computers and the Internet separately. All are important, but for developing countries mobile phone use may be the most significant. The World Bank has estimated that for every 10 percent increase in mobile phone penetration in developing countries, GDP per capita rises by 0.7 percent. Mobile banking, for example, allows countries to skip entire phases of development, such as the building of a retail banking system, with multiple main-street branches.
Government is another obvious factor in a country’s ability to become more productive, because it is the government that provides the appropriate framework and support system for growth as well as incentives. Nations whose leaders constantly struggle to cope with change or with the implementation of new and different ideas are typically those that have poor productivity performances and low growth rates. Stability, credibility, the rule of law and the absence of corruption are also key to allowing economies to grow. Equally important are macroeconomic factors. A low and stable level of inflation is critical for productivity as businesses are loath to take risks and plan when the future is uncertain. Economies in which governments restrict overall spending to affordable levels and maintain a modest debt also appear to be economies that can maintain higher productivity performances. The degree to which countries participate in international trade is likely to be another important influence on growth.
Classical international development theory suggests that, as countries develop, they raise their productivity performance toward the levels of more developed countries. Helped by international capital flows, especially foreign direct investment, countries are willing to change and adopt or copy best practices and introduce the higher standards of the more developed nations. In this manner, their ability to become more productive increases. Of course, countries see their productivity potential adapt at different speeds, depending on many factors. The GES, calculated on an index from 1 to 10, was our attempt to capture them. The higher the score, the more productive the country. Trying to forecast without taking these social measures into account would have been an exercise in purely theoretical economics.
In 2005, China’s GES ranked highest among the BRICs, followed by Russia, Brazil and India. China performed best on macroeconomic stability and openness to trade and education, but was less strong on corruption and technology. Brazil was less good on education and its government deficit, but better in terms of political stability and life expectancy. Russia’s main weaknesses were political stability, corruption and inflation, while India did well on rule of law but poorly in terms of education, technology adoption, its fiscal position and openness. By 2010 Brazil ranked the highest with GES of 5.5, China second at 5.4, somewhat ahead of Russia at 4.8, with India at 4.0 a distant fourth. As I will discuss in the next chapter, all the BRICs need to improve their growth environment scores or they will fail to reach their potential. A good benchmark would be South Korea, whose GES in 2010 stood at 7.6, a level higher than all the G7 countries except Canada. I’m sure if ten or twenty years from now each of the BRIC countries has such a relatively high GES, their economies will be both much bigger and wealthier.
As a measurement tool the growth environment scores have proved extremely useful. We now calculate them for 180 countries, and they have played a significant role in our thinking about the N-11 growth economies as we defined them in 2005, and which I will explore later.
Having explained how we reached our various projections for the BRICs, I should point out that my only regret is that we weren’t bolder.
Between 2001 and 2010, the BRIC economies’ GDP rose much more sharply than I had thought possible even in the most optimistic scenario. Moreover, their citizens’ wealth showed equally remarkable increases, bringing hundreds of millions of people out of poverty. Their GDP per capita, the best indication of individual wealth, collectively trebled.
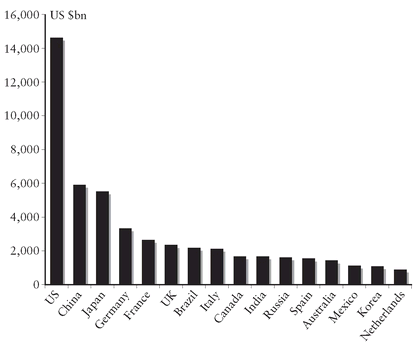
China started the decade as the biggest of the BRICs and has remained so. Brazil was the second big surprise for us, at least in monetary terms. Including it among the BRICs was my biggest gamble, but by 2010 it had overtaken Italy to become the seventh largest economy in the world, with a GDP of $2.1 trillion. I never imagined Brazil could grow so big so fast. Our race car graphic didn’t suggest it would reach that stage until after 2020. India and Russia also surpassed my forecasts for both nominal and real GDP growth.
Some commentators claim that these observations overstate the impact of BRIC growth—that, instead, it was the product of a freakish and unrepeatable set of circumstances: rapid export growth, the commodity boom and unsustainable U.S. demand. Yet if the numbers are viewed from a demand perspective, rather than GDP, and omitting exports, then an even stronger picture of BRIC growth emerges. While there is no doubting China’s remarkable export progress in the last decade, this is not the whole story. More significant is the rise of the Chinese consumer. Even the conservative official Chinese data indicate that personal consumption rose by $1.5 trillion between 2001 and 2011, the equivalent of creating another United Kingdom. China is no longer just a low-cost labor phenomenon. Its people are rapidly rising up the income ladder and spending.
The BRICs’ role in world trade is also expanding faster than we first thought and certainly much faster than world trade overall. Trade within the BRICs has accelerated sharply, largely because Brazil and Russia supply so many of the commodities needed by China and India. This pattern looks set to continue in the next decade and beyond, forcing adjustments to these countries’ foreign exchange policies. BRIC leaders are already discussing alternatives to using the U.S. dollar as their main trading currency.
All Four BRICs Have Grown Larger Than Predicted
Source: Goldman Sachs Global Economics, Commodities and Strategy Research
The Largest Economies in 2010
Source: International Monetary Fund, World Economic Outlook 2010
The Largest Economies in 2050
Source: Dominic Wilson and Roopa Purushothaman, “Dreaming with BRICs: The Path to 2050,” Goldman Sachs Global Economics Paper No. 99, October 2003
The BRICs, notably China and Brazil, have become powerful magnets for foreign direct investment. Moreover, they have also been piling up foreign exchange reserves. By the middle of 2011 China alone held more than $3 trillion in foreign exchange reserves, close to 50 percent of their own GDP, vastly larger than any other country in the world.
The charts here, viewed together, should give a useful snapshot of the extent to which the BRICs outperformed our projections and assumed an ever more powerful role in the global economy. But it would be wrong to conclude that the story of BRIC growth was the same for each country. Each followed its own path, beset by unique challenges and opportunities, driven by its own ambitions and attacked at every step by those who feared, or simply could not fathom, its rise.
