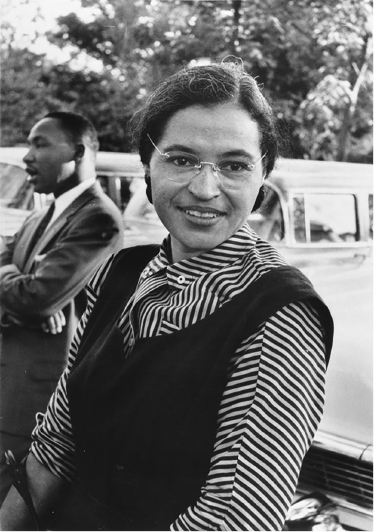
Figure 7.1 “The first lady of civil rights,” Rosa Parks’s refusal to yield her seat on a Montgomery bus highlighted both racial segregation and the critical place of transportation as an essential element of public life. Wikipedia.
It is no surprise that the effective end of US racial segregation began on December 1, 1955, with Rosa Louise McCauley Parks’s arrest for refusing city bus driver James F. Blake’s order to yield her seat to a white passenger in Montgomery, Alabama. Rosa Parks was not the first to refuse to accept the segregation of the public transit system. It was not her name but that of Aurelia Browder on the seminal 1956 Supreme Court decision ruling state policies of public segregation federally unconstitutional.1 But it was the face of young Rosa Parks, whom the US Congress would later call “the mother of the freedom movement,”2 that focused the nation and the world on the systemic inequities of the then-accepted racial segregation of public facilities in the United States. It was her arrest and its attendant publicity that made the 381-day boycott of segregated Montgomery public transit services, then legal under Alabama laws, so powerful an act of protest.
The year before, the US Supreme Court had declared, in Brown v. Board of Education,3 that the old rule of “separate but equal”—promulgated in an 1896 Supreme Court case4—violated the Constitution’s Fourteenth Amendment. As it had been for Homer Plessy in the earlier case, and as it would be for the Campaign for Fiscal Equity (CFE) petitioners in New York City a century later, the argument was ethical: in a society declaring all persons equal, justice requires equality of access and opportunity. With these two 1950s Supreme Court rulings—one in education and the other in public transportation—justice in the United States was redefined.
In moral philosophy, justice trumps all other moral and political objectives. John Rawls called it the first virtue, one insisting on fair and equitable relations between all, and thus equality for all.5 To deny equality is to accept that certain individuals in society will not be as free as others to act according to their best interests. Equality denied attacks the very notion of justice in its refusal of equal individual freedoms as a moral mainstay of society. When that occurs, the dignity of the person is violated, along with the notion of full membership in the community and country in which he or she lives.6

Figure 7.1 “The first lady of civil rights,” Rosa Parks’s refusal to yield her seat on a Montgomery bus highlighted both racial segregation and the critical place of transportation as an essential element of public life. Wikipedia.
What made Rosa Parks’s protest so powerful was that public transportation was assumed to be an essential freedom without which a citizen’s life is necessarily restricted. Citizens need to be able to travel the city in its many parts if they are to participate in its commercial and social activities. When transportation is restricted, so is the citizen. “Urban life is bound up with and predicated on transportation,” Klaus Schafer and Elliott Sclar wrote in 1980.7 “The quality of human life depends on the amount of access we have to one another.” Segregation ensured that equal access was restricted for some. And for individuals who cannot drive (or, if they can, cannot afford an automobile), it is public transit that either permits or inhibits independent access in modern urban communities.
It is in this sense that local and regional transportation is a critical constituent of what Harvey Miller described as “the individual’s [essential] freedom to participate in activities in the environment.”8 One cannot be an equal citizen, free to participate, if one cannot get to city hall, the concert hall, or an employer’s office. This belief in equality irrespective of individual differences led the United Nations, in its Convention on the Rights of Persons with Disabilities, to condemn the “attitudinal and environmental barriers” that hinder the “full and effective participation in society on an equal basis” of persons with mobility limits.9
So Rosa Park’s protest, and the protests of others, exemplified an ethical attempt to right a moral wrong within the segregated United States, where equal justice and equal freedom were withheld from persons of color. Yes, she broke state law and violated the rules of the transit company. But they, in turn, violated a greater moral supposition. The result was certainly distress for her (the arrest), the driver (forced to follow the rules), and the nation at large (she broke the law, but was it a bad law?). The fundamental issue was America’s image of itself and its allegiance to stated moral ideals.
Transportation experts rarely talk about equality and freedom, about morals and their enaction. Mostly they talk about access, “one of those common terms that everyone uses until faced with the problem of defining and measuring it.”10 I use the term here in its most pedestrian definition: universal access means the freedom to go anywhere served by the transportation network. Limited access restricts a traveler’s opportunity range. Inequalities occur when some people are denied access available to others.
Access is different from, but related to, the idea of “accessibility,” the ease with which different elements of a transit system can be entered. A transit system may have great access to the city at large—its many lines and modes linked nicely together. But that matters little if the individual stops or stations are individually inaccessible. Where either access (a limited system) or accessibility (entry to the system at its nodes) is restricted, the accessible space of the city and its potential are diminished. Traveling urbanites must instead drive their own cars, pay for taxis, hire a private driver, or just stay home. Systems that provide universal access and accessibility are by this definition equitable, while those in which access and accessibility are limited can be described as less inequitable. Justice and its attendant freedom hang in the balance.
For many years, urban transit systems have been understood as networks linking places within a city or metropolitan region. At another scale, air and rail services (or buses) link the city at large to the region and then the nation in which it is embedded. Experts talk about network “circulation.” Just as humans are sustained by the circulatory system of the blood, so the circulatory transportation network sustains the urban body.
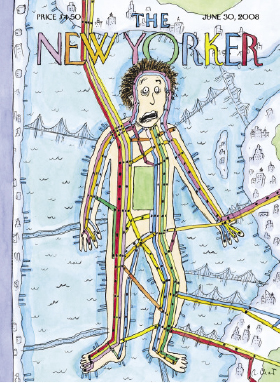
Figure 7.2 This New Yorker cover presents New York City as a body whose circulatory system comprises the rail and subway lines that run through its body. They, in turn, join the city to the greater world, across bridges that are also transit carriers. Courtesy the New Yorker.
It was this idea that made the cover of the June 30, 2008, issue of the New Yorker so intuitively correct (fig. 7.2). In the cover illustration, New York City is anthropomorphized, simultaneously restrained and sustained by the bridges and transit lines that link its varying parts, one to the other, and the whole to the greater world. In the last century, circulation was used as both noun and verb in describing the flow of electricity across a building’s wiring and, by analogy, the electrified city. The idea of urban circuitry across a connected urban network powered perhaps the most famous and certainly the most emulated of all transportation maps, Harry Beck’s 1931 map of the London Underground (fig. 7.3).
First published in 1933, Beck’s spare, color-coded geometry posted the idea of a subway system as universally accessible urban circuitry.11 Indeed, in 1933, Beck made another map of the London Underground using electric circuitry symbols in response to kidding from coworkers that his transit map “merely adopted one of the electrical circuits.”12 Just as electric circuitry ensures a free flow of all electrons in a wiring system, or in the human circulatory system blood cells move through the individual body, so transportation circuitry ensures the equal movement of all persons in and through the city.
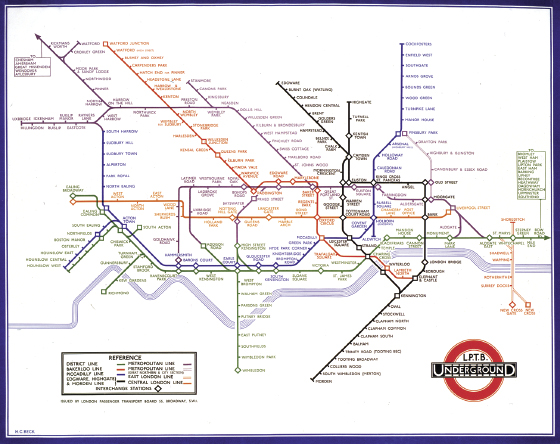
Figure 7.3 The original 1933 version of the London Underground map designed by Harry Beck, a map whose features have been widely copied for use by transit systems around the world. Courtesy London Transport Museum.
For more than eighty years, Beck’s map and its successors have served as “a magic guide to a hitherto totally bewildering city,” wrote Ken Garland in Mr. Beck’s Map.13 “Before them [i.e., Londoners] was an orderly simulacrum for a disorderly, disjointed accumulation of urban villages, only barely discernible from one another on the ground, yet possessed with all the pride and exclusiveness of true communities.” The mapping of the underground made those true communities part of one greater entity. In a real way, the Underground is London, its imaging a map of the city whose accessibility at every point is the presumed right and indeed the birthright of all Londoners.
The system has expanded since Beck’s day. New stops and new lines have added to its reach; ridership has grown exponentially. At the end of the first decade of the current century, Transport for London supported 124.6 million passenger trips along its twelve, color-coded lines, each trip beginning and ending at one of the Underground’s 333 stations. Some stops connect travelers to the national rail system and thus provide access to the nation at large. Heathrow Airport and Paddington Station connect travelers to the Continent and the greater world.
All of this is true for many Londoners and most visitors, but not in full measure for me in 2001, 2009, 2012, or 2014. Because I was hobbled by arthritis and walking with a cane, the high, narrow steps leading into and out of many stations, and the long corridors joining different lines at shared stops, were not mere impediments or minor inconveniences but barriers limiting my travels. If I can’t safely navigate the stairs and walkways, then I can’t get to the Underground’s trains. And even when I can, on a good day, the effort typically is exhausting and sometimes dangerous if, when I am tired, my balance wavers.
Nor am I alone. Struggling mothers wheeling baby carriages can be found waiting at a station entrance until a passerby offers to help lift the carriage down to or up from platform level. At many stops, persons in electric scooters and wheelchairs are simply out of luck, as are those with other challenges that make even slow progress so dangerous and taxing they prefer to stay home.
If equality of access is an essential freedom, as civil rights activists (and signatories to the UN Convention on the Rights of Persons with Disabilities) proclaim, then the lack of accessibility to the London Underground presents a freedom denied, an injustice that isolates the mobility-limited user in and from the city.
The average Londoner experiences something like this during the occasional transit worker strike. “It’s difficult to explain what a nightmare London can be without the Tube,” wrote Jennifer Quinn in a 2014 obituary for Bob Crow, the longtime leader of Britain’s National Union of Rail, Maritime, and Transport Workers. “Londoners sometimes just choose to stay home during a strike, rather than face the hassle of trying to get around a huge city with chaos on public transportation, which nearly 50 per cent of commuters use to get to work.”14 Those who cannot navigate the Underground’s above-ground entrances and lower-level walkways know that “nightmare” on a waking, daily basis. Many simply give up the game and, as do Londoners during a labor action, just stay home.
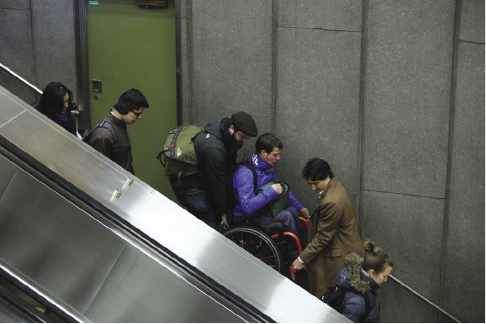
Figure 7.4 In 2016 Canadian Prime Minister Justin Trudeau was photographed helping to carry a wheelchair user down an inoperable escalator at a subway station in Montreal. Adam Scotti, official photographer for the Prime Minister.
I use London here as an example of the general problem that exists for mobility-restricted travelers in many cities. In the United States, Boston’s MBTA and the New York City Subway have few elevators or lifts permitting mobility-limited entrance to the system. In other cities like Toronto, older streetcars have steps too steep for all but the aggressively able. The resulting inaccessibility also excludes people riding scooters or traveling in wheelchairs from using public transportation.15 Even where there are elevators from the street to an underground or elevated transit station (or lifts on buses), they are often nonfunctioning. A 2009 survey of the Chicago elevated transit system found that more than 40 percent of the elevators that in theory provided accessibility in fact were inoperative.16 So, too, were supposedly accessible doors and turnstiles.
In New York City, only 92 of the 425 stations—21 percent of the total—are wheelchair accessible. Of course, that assumes the elevators at those stations are working and, on an average day, 25 of the elevators at those 92 stations are out of service for a median time of four hours. That means, in effect, that at most 22 percent of the 21 percent of accessible stations can be accessed by persons with mobility deficits.17 “I often wheel off a train only to discover that the sole elevator to ground level is out of service,” Sasha Blair-Goldensohn wrote in the New York Times. The options are then to try another accessible station, often stops away, or hope folk will help carry him and his chair up the steps.
In a 2008 survey of US citizens over sixty-five, more than 20 percent of respondents reported staying home because of the limits of local transit systems.18 Melanie Rapino and Thomas Cook call this a kind of spatial entrapment measured by a progressive reduction in accessible space or the necessary addition of travel time to get from one place to another.19 For her part, Carol Thomas calls passenger exclusions on the basis of accessibility barriers an “impairment effect” that produces what Rob Imrie and Clair Edwards described as “disabled spaces,” areas of the city that become off-limits to those with restricted mobility.20 In 2002 Alison Porter named the result “transit disability,” a state defined by system barriers rather than a person’s physical capacities.21
For those in the disability movement, it has long been doctrinal that the problem is not solely this or that person’s potentially limiting characteristics but society’s refusal to accommodate individual differences.22 The movement began in the 1970s in Great Britain, due in large part to the efforts of members of the Union of the Physically Impaired against Segregation (UPIAS).23 Since then, the definition that has become generally accepted is, as the United Nations Convention on the Rights of Persons with Disabilities declared, that “disability results from the interaction between persons with impairments and … barriers that hinder their full and effective participation in society on an equal basis with others.”24
Racial segregation created an unjust limitation on personal freedoms based on a person’s pigmentation, making it a “disability.” Social segregation resulting from the systemic exclusion of persons on the basis of their physical or sensory characteristics similarly imposes inequitable and thus unjust limitations on the promised freedoms of affected persons to interact equally in and with the city.25 That sense of exclusion, of diminished citizenship, constitutes the very essence of moral stress and distress: an attack on one’s sense of self as equal based on a fundamental failure of justice’s fairness ideal.
None of this is evident in maps of the modern Underground freely distributed in folding, pocket-sized editions by Transport for London at Tube stations and at the concierge’s desk in most hotels (fig. 7.5). These maps, and those on the system’s web pages, promise a justly equitable, universally accessible travel network of fourteen train lines in a wholly integrated network linked, at forty-five different transit stations, to national and international marine and rail transit systems.
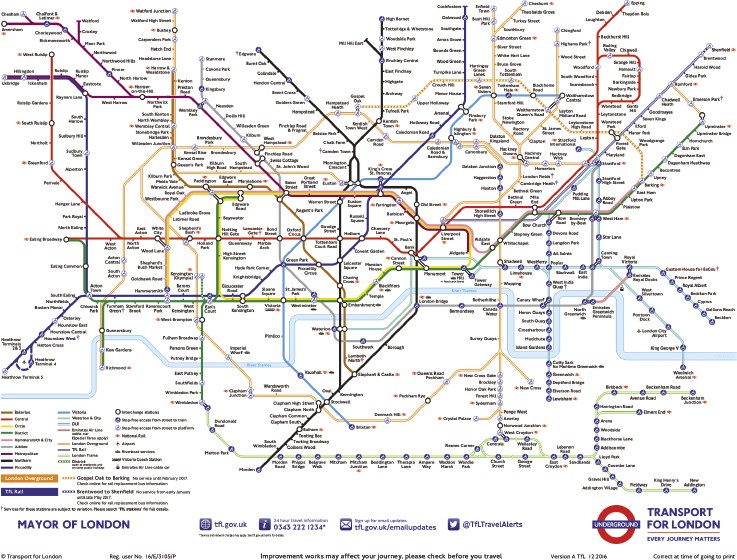
Figure 7.5 The official map of Transport for London promises a fully integrated, accessible opportunity for travel by all Londoners everywhere. Courtesy Transport for London.
What a map! The inheritors of Mr. Beck’s vision have done him proud. In its current version, there are a total of 376 line segments, each connecting at least two of the 333 transit stations, one to the other. Some of those stations permit access to two or more different lines. Even where a station accesses only one line, however, it will of necessity connect to at least one other station, and from there another until it reaches a junction where a traveler can switch to a different transit line again.
Enter anywhere, the map promises, go everywhere. The diameter of the system, its length at its farthest two points, is forty-nine stations, stretching from the Piccadilly Line’s Heathrow Terminal stations at the system’s extreme southwest to the Upminster station on the District Line at the extreme northwest.
The mapped network is embedded in an economic landscape of nine concentric oval zones, each lightly shaded and numbered consecutively in the map. Zone 1 is the city center (Parliament, Westminster Abbey, etc.); zone 9 is the exurban periphery. Costs increase as a traveler crosses from one zone into another. Across this economic surface, the map promises equitable access for all who can pay the cost of the trip. Poverty aside, the map presents a promise of equality and universality in a London available in its many parts to all city residents and visitors.
John Pickles would call this an over-coded territory, one whose signs and symbols promise an organized, thoroughly accessible, hierarchical environment.26 It is over-coded because the actuality may be experienced as chaotic and complex. Some, for example, Bieke Cattoor and Chris Perkins, think it has to be that way.27 The result permits a kind of visual argument whose form and grammar are intuitively understood. The result screams, “Here is a system, accessibly open and well connected in its many parts.”
The heart of the map is the moral declaration that underpins the complex realities proposed in its construction. Wherever you want to go, there’s a Tube stop ready for you nearby. “There is general agreement that everybody deserves ‘equity of opportunity.’”28 That is what the map promises, and after all, that moral declaration is asserted not only in the United Nations Convention on the Rights of Persons with Disabilities but also in Britain’s Equality Act 201029 and, separately, Britain’s 1995 Disability Discrimination Act, which was replaced by another, similar act in 2010.30
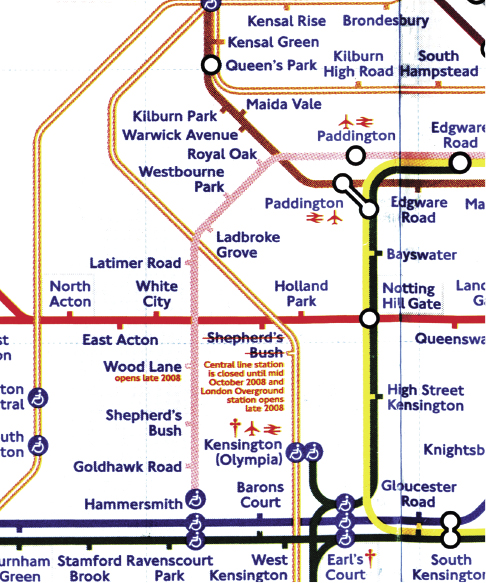
Figure 7.6 This detail from the Transport for London map shows the presence of “special access” stations, symbolized by a stick figure in a wheelchair, promising system accessibility at a minority of stations.
As if to emphasize these fine sentiments, across the mapped surface one finds 104 “special access” stations whose elevators provide accessibility for those with mobility restrictions. In the map, these appear as value-added locations. But for the mobility-restricted traveler who can enter (or leave) the system only at a “special access” station, 229 of the total 333 Underground stations are, in fact, inaccessible. That drastically reduces the opportunity surface for the mobility-limited user. Inaccessibility, in other words, denies access in a way hidden by the map.
The number of stations between the Heathrow Airport terminals to the map’s southwest, for example, and the Central Line’s Epping station to the northeast shrinks by approximately 75 percent to ten accessible stations from the forty-one mapped for nonrestricted users. Access to the National Rail system at forty-five Underground connections available to the normal user was reduced by 29 percent to thirty-two “special access” rail connections. That meant slightly more than 71 percent of all National Rail connections in the city are inaccessible, off-limits to the “special access” traveler.
To chart that reality, I made a map reflecting a mobility-limited opportunity surface that included only wheelchair-accessible “special access” stations (assuming all elevators were in fact working) and the links between them. The accessible city shown in figure 7.7 is radically diminished. Points of entry are severely restricted; so, too, are potential destinations. Even if one lives near a “special access” station, there is no reason to enter it unless the destination sought is near another station that is similarly accessible. As a result, whole lines are erased from the mobility-limited map as, one by one, inaccessible stations and their links are removed. The Metropolitan line north of Paddington Station and the District Line south of Earl’s Court are gone. There is no point of entry or exit. The Circle Line that rings the inner city virtually vanishes, as well. Only the stops at Westminster, Bank/Monument, Liverpool Street, and St. Pancras remain. Where did the lines go? You can’t ask Britain’s most famous fictional detective, Sherlock Holmes, because there is no stop at Baker Street, where his office is now a museum.
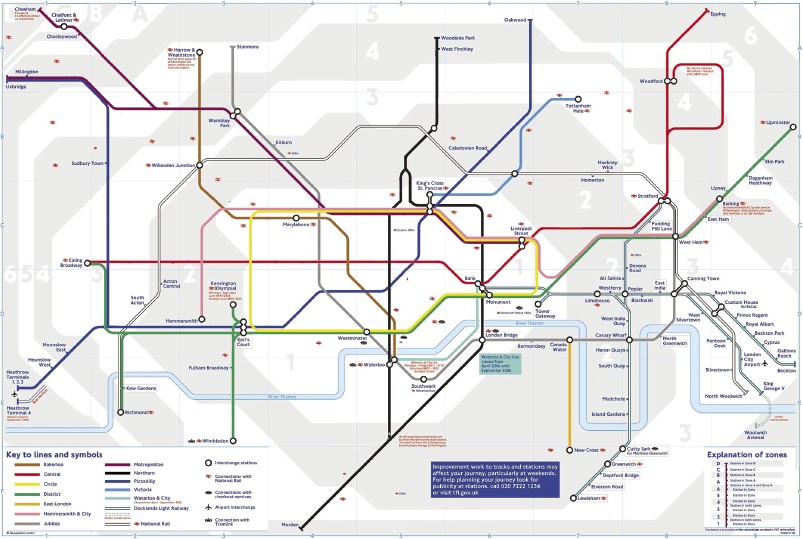
Figure 7.7 The author’s map reconfigures the standard London transit map to reflect its reality to the mobility-limited traveler. Only stops accessible to wheelchair users, and the links between them, are included in this map.
Also removed from the map are most of the not necessarily accessible Underground stations linking the London Underground to the National Rail system. The standard map’s symbols promising National Rail access are retained but moved off-center from their original locations. They float instead as symbols of promises withheld in the empty space of the mobility-restricted map, symbols not of connectivity but of inaccessibility.
The mobility-restricted map is startling in its bareness, its opportunity surface drastically diminished. Its argument can be distilled into a set of quantitative descriptors teasing out the numeracy of exclusion. To do this, I asked for help from three transportation geographers: the University of British Columbia’s Ken Denike; Simon Fraser University’s Warren Gill; and Ray Torchinsky, who, for a time, taught transportation geography at SFU.
To quantify the effects of mobility limits, we first defined a direct connection as a single network link joining any two stations. Distances between any two stations were then considered additively, with an optimal shortest path described, in turn, as the fewest number of network links required to go from any a to any b. In considering the relative location and potential importance of different stops, and thus of regional differences in the city, we divided stations into two groups: inner stations in the central city (zone 1), and outer stations in the increasingly peripheral economic areas (zones 5 and 6). Zone 1 is the center of government—Metropolitan and National—and the area in which one finds London’s most famous tourist sites, including the Houses of Parliament and Westminster Abbey.
Table 7.1 Transit access: The number of accessible stations

“Special access” Tube stations are distributed unevenly across the city with paucity in the dense central area compared to outlying suburban regions.
The simplest measure of relative accessibility is the percent of stations open to potential travelers. Table 7.1 concludes that, overall, access for mobility-limited travelers was available at only 31 percent of all London’s Underground transit stations during our study period. In the critical central area of the city, however, the percentage dropped to 15.5 percent, reflecting an uneven geographic distribution of “special access” stations. To state our findings declaratively: mobility-limited travelers were barred from more than 70 percent of the Underground network overall, and more than 85 percent of the network stations in the center of the city.
Table 7.2 Trips between accessible nodes

Of the total number of possible trips available to average London Underground travelers, approximately 92 percent are inaccessible to travelers requiring lifts and other access advantages.
An even greater reduction in travel opportunity was described by calculating the number of “seamless trips” available to the mobility-restricted Londoner. These are trips that do not require the inclusion of alternate travel modes (bus, ferry, taxi, etc.).31 Table 7.2 concludes that fewer than 10 percent of all seamless trip possibilities (9.69 percent) available to the normal user were available to the mobility-restricted user overall. In the critical zone 1 at the core of the city, only 2.18 percent of possible trips can be accomplished seamlessly.
To better describe the effect of these reductions, we next calculated the number of trips between nearby stations available for the “special access” traveler (Table 7.3). For this we used one-link nodes as a measure of the coarseness or fineness of the urban network and thus of the travel opportunity space available to the mobility-restricted traveler. Simply, we used the number of nodes joining one link to another. If there was only one missing link, perhaps the mobility-restricted traveler could limp, crutch, or roll the distance. But where multiple stops were inaccessible, the likelihood of this was minimal.
Table 7.3 Trips between nearby stations (accessible nodes and nodes within one link of an accessible node)

Even where access is defined by the “nearness” index of a station, the opportunity surface available to the mobility-restricted traveler is severely diminished.
These findings were again divided into those for the core city (zone 1) and then for the city at large. Using this one-link measure, we found that only 21 percent of trips within the central area and 29 percent of trips between the center and outer areas were available to mobility-limited travelers. For the normal traveler, of course, accessibility and thus access would be 100 percent.
The reason why special access stations cluster along newer, outer segments of the network is simple. Older stations were built before concern for the mobility-restricted traveler was common. Newer stations built to serve the periphery are more likely to have elevators, escalators, and other mobility assists. To test for the degree of clustering exhibited by the distribution of accessible stations in London, we measured the average distance in transit links that must be traversed by mobility-limited users to reach a single accessible station from any other station (table 7.4). The resulting mean nodal accessibility degradation index (MNAD), developed by Torchinsky, is independent of both network size (number of nodes) and the relative number of accessible versus inaccessible stations. Using the cumulative frequency distribution for the full set of random iterations, we generated and analyzed a series of 100,000 random test distributions. The result is computationally similar to a first-order, nearest-neighbor statistic but differs in that nodes are separated into two subsets, and the distance measure is made from nodes in one subset (special access) to the nearest node in the other subset (all access).
Table 7.4 Mean nodal accessibility degradation index
| Average Links to Accessible Node | Percentile, Random Distribution | |
|---|---|---|
| Full Network | 1.40 | 97.7 |
| Central Area | 1.64 | 93.8 |
| Outer Area | 1.34 | 98.5 |
Mean nodal accessibility measuring expresses the average distance in links that must be traversed to reach a single accessible station from all other stations. For normal travelers, the average is 1.0.
The MNAD index can be interpreted as the average distance, in terms of network links, a mobility-restricted traveler needed to reach the nearest accessible node to his or her origin or destination. An index value of 1.40 meant a trip for mobility-limited travelers between any two rail stations in London would require, on average, at least three additional sequential rail links to get where they hoped to go. That is, there is the equivalent of a three-stop penalty for the mobility-restricted traveler compared to the normal traveler.
To test the conditional probability of the randomness of the distribution of accessible stations within the central and the outer areas, a second series of 100,000 random distributions forced the total number of accessible stations in the two areas to coincide with the observed number. The last column in table 7.4 presents the percentiles achieved in this simulation. The result again distinguishes, at a 95 percent confidence level, the diminished distribution of accessible central-city and out-area nodes available to the mobility-restricted user.
Some say none of this truly limits mobility-restricted travelers’ access to London. Those with sufficient monies may travel in taxis or drive personal cars. For those who cannot afford either or, like me, cannot drive (my low vision does not permit it), there are always buses. After all, Transport for London maintains a comprehensive and accessible bus network. At rush hour, the double-decker buses are typically overfull, and even if passengers can get onboard, those using canes and crutches are unlikely to find seats. Persons in wheelchairs may have to wait at an outdoor stop until a less crowded vehicle eventually arrives.
Even were occupancy unlimited, are city buses equivalent to the Underground? Is one travel mode equal to another? We compared travel times for the average Londoner with full access to the Underground to the travel time a mobility-restricted traveler would require accessing only “special access” transport services. To generate these two travel time profiles, we chose Heathrow Airport Terminal 3 as a destination and calculated travel times to it from all other Underground stations. Where the Underground was unavailable, bus travel was substituted and, in several cases, rail and marine ferry if they were shown to be the best accessible options.
Calculating relative travel times for all resulting origin–destination pairs was accomplished using Transport for London’s online “journey planner.” By 2014 the program we first used had been updated in a new online version.32 The systems, old and new, both gave shortest-time travel options for all normal and separately mobility-restricted travelers. To generate comparisons, we entered the name of an Underground station in the “traveling from” box and entered Heathrow Terminal 3 in the “traveling to” box.
For all trips, we first queried the fastest travel option among all available transit modes for an average Londoner at 11:00 on a weekday morning. That start time is during a relatively slack transportation period, chosen to avoid comparisons during heavy commuting hours. Buses, if needed, are far slower during morning and evening rush hour commute times. Trip-planning parameters included “average” walking speed and a limit of ten minutes for pedestrian travel between stations or nodes (marine, rail). Then, using the “advanced options” button (now called “I need step-free access”), we calculated the same trip separately for mobility-restricted users unable to use escalators or stairs. Typically between four and six options were returned, all leaving within forty minutes of the 11 a.m. start time. These were averaged to give a recorded travel time (including waiting) between each of the 332 station locations and the airport station. Rolling or walking speed was self-assessed in the trip planner as “slow,” and a maximum of four minutes pedestrian travel time was entered as a limit.
Table 7.5 “Special access” and normal user travel times to Heathrow Airport
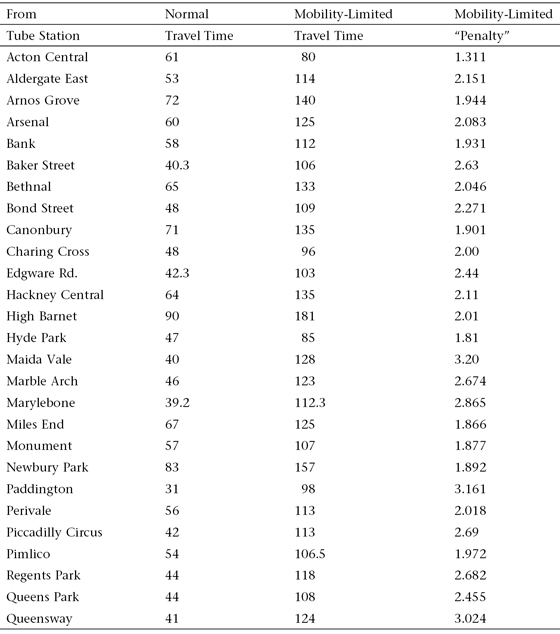
This table is a representative list of observed time differences between Heathrow Airport and London Underground stops.
Not surprisingly, while most of the trips for the average traveler used the London Underground, those for mobility-limited Londoners relied primarily on bus and in some cases rail (mostly from Paddington Station). The number of steps required to get to Heathrow from anywhere in the city increased markedly (as the MNAD index predicted) for the mobility-restricted traveler.
On average (Table 7.5), it took the mobility-restricted transit user at least twice as long to get from any Underground location in London to Heathrow Airport. Columns 1 and 2 are the travel times for average and mobility-restricted users respectively. Column 3 is a simple ratio in which the first column is divided by the second. Thus a ratio of 1.5 presents a trip half again as long for the mobility-restricted user, a ratio of 2.0 means twice the travel time, and so on. The average time differential in this sample set of origin–destination pairs was 2.6:1. Calculations using the full set of travel times generated for all 332 transit stations to Heathrow Airport resulted in a system-wide travel time differential of a bit more than 2:1. Were the same test run during rush hour, when traffic flows slow markedly, the time difference would likely have been far greater. After all, the Tube’s great advantage is that its trains run not simply underground but on tracks that avoid the gridlock of rush hour commuting.
But …
A simple test of fairness and equality (and thus of justice) is this: Would the average person accept the restrictions that are placed on another? Would white bus passengers in Montgomery, Alabama, have accepted directions to sit only in the back of the bus and yield their seats to African American or Asian travelers? Would an Upper West Side Manhattan parent accept the condition of the schools that were the norm for students from, say, Harlem? Would Buffalonians who live in the suburbs of Amherst, Kenmore, or Williamsville accept for their children the school quality that existed in downtown Buffalo? If the answer is no, then the resulting inequality is clear. This kind of question (what if it were you?) lies at the heart of John Rawls’s principle of justice “behind the veil,” where one makes choices without knowing one’s own precise circumstances.
Would the average Londoner accept without complaint a transportation system that required that he or she spend at least twice the travel time as his or her neighbor? Would he or she accept a system that largely barred him or her from travel on an Underground that was wholly accessible to that neighbor? The answer, based on the vociferous response to transit stoppages in the city, is no. The average Londoner would protest strongly, saying his or her access to the city and its opportunities—and thus freedoms—was being unfairly restricted.
Contemporary transportation researchers largely ignore these problems.33 If you can’t get there from here, they assume, another similar and more accessible “there” will somewhere be available. A clothier is a clothier, and if one won’t do, then another will. Similarly, a doctor’s office in one place is no different from one elsewhere. Issues of equality, freedom, and inclusiveness are thus avoided. This “place-based fallacy,” as Harvey Miller called it, assumes not only that alternate locations will be more or less equally available, but also that they will be commensurable.34 One church, doctor, or clothier is the same as any other. They aren’t, however, not really. And where 70 percent of the network, including 80 percent of the urban core, is inaccessible, the reduction is simply too severe to suppose that easy alternatives exist.
The analyst’s shrug seems to be based on the tendency, at least in the North American literature, to talk about access and accessibility in terms of automobile drivers who may have to drive a bit farther but are otherwise less obviously inconvenienced by mobility barriers.35 Analysts whose models seek to “measure space-time accessibility benefits within transportation networks” typically take little account of needs of, and restrictions on, special user groups.36 They simply assume the automobile is a universally accessible means of travel, the road system an equitable urban network. A small literature exists on travel barriers and opportunities for the sight limited, thanks to the work of the blind geographer Reginald Golledge, but this work is limited, largely experiential, and not system analytic.37 The few who have attempted a general address of mobility limits have done so through theoretical computer models of such stunning complexity that their applicability remains untested.38
In the standard mapping and in the professional’s analytics, justice problems are buried in assumptions of normalcy. They assume we are all like electrons in the electrical grid, equally capable of transiting the system in all its parts. We are not, of course. The severe reductions resulting from limited accessibility present what the public health writer Barbara Starfield described, in another context, as a “vertical inequality” resulting when “people with greater needs are not provided with greater resources.”39
Equality, equity, and freedoms acknowledged or denied are the result of both built and social environments that either promote or inhibit personal and professional opportunities.40 Certainly the result is not simply distressful but also stressful for the mobility-limited Londoner. It was for me as I planned my travel in the city around the system and my own mobility limits. At the heart of that stress lie the moral declarations that are ignored, the ethical injunctions that are unmet. For me, the map became a kind of tease, if not a lie. More generally, the built environment reflects the social priorities of the society in which they are constructed, enacting the ethics of that society’s moral vision. And here equality and freedom fell by the wayside in my struggles with city transit.
The creators of the London Underground did not have equity and universality in mind when they built the first lines and their stations. They did not think about access for persons on crutches or in “basket chairs,” the wheelchairs of old. Harry Beck did not think about these things when he first mapped the Underground as a kind of circuit board across which equally able Londoners might travel. The map that resulted deserves the overused descriptor “iconic.”41 In its clear, objective posting of transit lines dotted with transit stops, it has been the model for similar maps around the world.
The map (fig. 7.5) is “objective” in its mapping of Transport for London’s Underground system, correctly relating the system’s lines and nodes. Equally objective, however, is the map of London’s Underground from the perspective of the mobility-restricted user (fig. 7.7). The first assumes a normal traveler with money to buy a ticket. The second takes accessibility as a critical determinant rather than a given and then refuses to include Underground stops and lines unavailable to mobility-restricted citizens.
Transport for London mapmakers might say, with a shrug, that this isn’t their problem. They were hired to create a map of the transport network as it physically exists, not to critique its limits. They are functionaries doing what they’re told. Thinking about equality, freedom, and justice is not included in their job descriptions. Nor is it the necessary brief of transport analysts and planners. They are, they could say, adding elevators where they can, when the money is available. It’s an old system, after all, and things take time.
It is easy for functionaries to assert, as did one of the participants in the Regina workshop, that objectivity carries no ethical quotient, that morality is an ideal without a footprint. When as functionaries we take this position, we lose the opportunity to promote the moral values (equality, freedom, justice for all) that as citizens we purport to embrace. And that morality is clear in the laws and international agreements signed by Great Britain that promise equality of opportunity to persons of difference (I do not use the word disabled). We ignore our morality and its ethical injunctions until, perhaps, demands for redress make clear the limits of the work we have proudly produced. We ignore them until we sit in a wheelchair at a bus stop at rush hour or wait at the top of a Tube station we cannot access.