From the olfactory receptor cells, the pathway to smell perception in the brain passes through a series of regions: the olfactory bulb, the olfactory cortex, and the orbitofrontal olfactory cortex. The first processing steps take place in the olfactory bulb. Because of its critical role in forming the smell image that is the major component of flavor, we will take several chapters to explain how it works.
The Olfactory Bulb
As its name implies, the olfactory bulb is shaped like an incandescent light bulb, sticking out in front of the frontal lobe of the brain. In comparison with the visual pathway, which starts in the retina and progresses through the thalamus to the visual cortex, it is as if the olfactory equivalents of all these structures are compressed into just the olfactory bulb. A big challenge is understanding all that goes on inside, and this requires getting familiar with the cells.
Figure 7.1 shows the olfactory pathway in a representative mammal such as the rat. When smell molecules bounce in and out of a receptor binding pocket in an olfactory receptor neuron (orn), all an individual cell “knows” is how much the features of the smell molecules have tickled its binding sites. Again, the greater the tickle, the more the cell responds by generating impulses. The code that it sends on to the olfactory bulb is therefore in the form of frequency of impulses in the olfactory nerves (on), which does not tell much about which smell it is. This means that the code for smell molecules, the code the brain reads, must lie in the differences between the responses in the different cells.
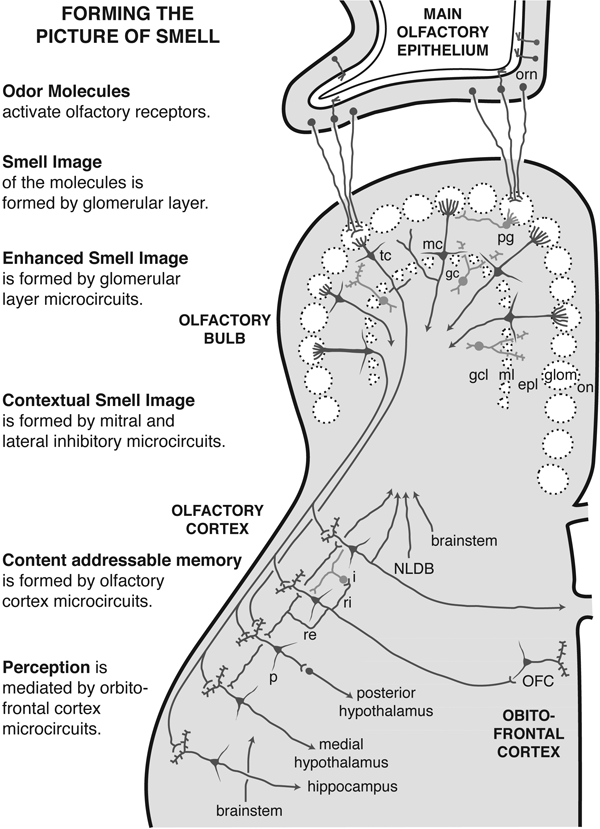
FIGURE 7.1 The smell pathway
On the left, the series of operations to process the smell input from reception in the nose to perception in the cerebral cortex. On the right, the successive stages of the smell pathway that carry out these operations. In the olfactory epithelium, the main type of cell is the olfactory receptor neuron (orn).
In the olfactory bulb, the main types of cells are the mitral cell (mc); tufted cell (tc); periglomerular cell (pg); and granule cell (gc). The cells lie in different layers: olfactory nerve (on); glomeruli (glom); external plexiform layer (epl); mitral cell body layer (ml); and granule cell layer (gcl). In the olfactory cortex, pyramidal cells receive input from the olfactory bulb and connect to interneurons. Central fibers extending out to modulate the olfactory bulb cells arise in the nucleus of the horizontal limb of the diagonal band (NLDB). The orbitofrontal cortex (OFC) is represented by a single pyramidal cell to conserve space.
In the olfactory bulb, the fibers from the several thousand receptor cells, all containing the same type of olfactory receptor, converge on a single site, called a glomerulus (glom). Depending on the species of animal, there are up to a thousand or so of these sites, each receiving its unique input. Connecting to each module within the olfactory bulb are some large cells called mitral cells (mc), named so because early histologists thought their cell bodies looked like a bishop’s cap, or mitre. The mitral cells send their fibers on to the olfactory cortex. Together with smaller and more numerous versions of the mitral cells called tufted cells (tc), they provide the straight-through pathway. There are also numerous interneurons, cells with short branches, that are involved with local processing of the straight-through pathways. At the glomerular level they are called periglomerular cells (pg), and at the level of mitral and tufted cell output they are called granule cells (gc). Not shown, for simplicity, are parallel pathways that pass through the accessory olfactory bulb, often associated with pheromone reception, and a modified glomerular complex for special odor cues.
Through the pattern of its input and the interactions between its neurons, the olfactory bulb creates the code for representing the stimulating molecules.
How the Olfactory Bulb Represents Smells
The story starts at Cambridge University with Edgar Adrian, one of the great physiologists of the nervous system. After being a leader in the pioneering advances of the 1930s in the physiology of other sensory systems, he launched into a study of the olfactory system, the last major work of his career. He selected the brain of the hedgehog for his first study in 1943, showing electrical responses to natural odor stimuli. This was an era when biologists often chose species on the basis of behavioral considerations, whereas today there is an increasing focus on a few species available for genetic engineering. No one could doubt that the hedgehog burrowing through the ground lives primarily by its sense of smell!
One of Adrian’s recordings became famous because its caption read: “Odor of decayed earthworm.” The story goes that, in looking for a natural stimulus with which to test the hedgehog, Adrian found the shriveled remains of an earthworm in a dark and dank corner of his basement laboratory. By the time of these studies Adrian was a famous scientist with many administrative duties, yet he did all his experiments himself (and saved money by using natural stimuli).
Adrian next recorded from the olfactory bulb of the anesthetized rabbit. He put his electrodes in various parts of the olfactory bulb while stimulating with different odors. He found that the cells in different parts responded differently to different odors. We can do no better than quote from his paper of 1953:
So far then it looks as though Acetone molecules will produce an excitation coming mainly from the front part of the organ and from the particular groups of receptors in that area which have this specific sensitivity to it. A strong concentration may bring in other groups but, owing to the structure of the organ, there will always be critical regions where the concentration is only just strong enough to excite and here the specific effect will show itself. And there will also be critical times. At each inspiration the amount of material which enters the nose will increase progressively to a maximum and at the beginning and end of each inspiration the concentration is near the threshold value. The physical and chemical properties of the substance will therefore determine the time course of excitation. For instance, a large spike unit may have a specific sensitivity to Xylol. As the concentration of Xylol in the air is increased, other units will begin to come in during the later part of the discharge. With pyridine and eucalyptus the smaller spikes appear first and the large ones come later on. The result is that the photographic reproduction of the discharge has a characteristic shape for each substance, and this shape is reproduced with remarkable constancy each time the substance is presented to the nose.
The result is that the electrophysiologist, looking at a series of these records, could identify the particular smell that caused each one. We must not conclude that the brain identifies the smell by the same criteria but we can at least see how a great variety of smells might be distinguished without the need for very great variations in the receptors.
The basic concept that odors are encoded by spatial patterns and by their timing dates to this work of Adrian. Remarkably, he suggests how this differential encoding can come about “without need for very great variations in the receptors.” As we have seen, very small differences in the molecular structure of the receptors accounts for their ability to respond differentially to specific features of the odor molecules. But Adrian knew the limitations of the knowledge he had at the time. His speculations were limited to the different shapes of multiunit recordings from assorted regions rather than being about actual mechanisms; he did not actually specify that these were “spatial patterns” in the olfactory bulb. He even cautioned against concluding that the brain recognizes smells in the way he could from looking at the different recordings from the different regions.
During my graduate work on the physiology of the olfactory bulb, I made the pilgrimage from Oxford to Cambridge to visit Adrian and discuss my experiments on the cells in the olfactory bulb and how they might relate to his studies. My adviser, Charles Phillips, cautioned me that Adrian was well known to be shy of visitors. Adrian courteously listened to my eager account of my work, but after a while he explained he was urgently needed elsewhere and began to make motions as if, literally, to run away. Our interview ended on the staircase of the old physiology building on Downing Street. My last question was what he thought was the most important problem to be solved in understanding the neural basis of olfaction. Over his shoulder came the reply: “Look to the glomeruli.” With that, he disappeared. They were prophetic words.
A New Method for Mapping Brain Activity
Following Adrian’s studies, electrophysiological studies made little progress in characterizing further the responses produced by different smells in the olfactory bulb. The problem was that, in contrast to the situation in vision and somatosensation (touch), where the experimenter knows where to put the electrode in a particular part of the sensory field in order to record from cells responsive to the stimulus, in olfaction we didn’t know where to look; we had no a priori knowledge to guide us about where a given odor might be mapped in the olfactory pathway. So although the pioneering studies of Vernon Mountcastle at Johns Hopkins University in the somatosensory cortex and David Hubel and Torsten Wiesel at Harvard Medical School in the visual cortex were our inspiration, their electrophysiological approach to characterizing the mapping of sensory responses in the brain could not be used effectively for revealing the central representation of smell.
The breakthrough came from a visit by Ed Evarts, of the National Institute of Neurological Disease and Stroke in Bethesda, Maryland, to our department at Yale in 1974. Evarts was a leading investigator of the motor cortex. During his visit, I explained our experiments on the olfactory bulb and how difficult it was to know where to look for responses to different odors. Evarts responded that we might be interested in a new method that Frank Sharp, a postdoctoral student in his laboratory, was working on. It was a method being developed in the nearby laboratory of a leading biochemist, Lou Sokoloff. Sokoloff had joined with a great pioneer in the biochemistry of the brain, Seymour Kety, and an outstanding young pharmacologist, Floyd Bloom, to develop a method for mapping activity in the brain based on where the brain uses its energy. The method was based on the fact that nerve cells are exquisitely dependent on oxygen and glucose for their immediate energy needs when they are active; this is why we faint if there is an interruption in blood flow to the brain. The energy is required not for the flow of charged ions across the cell membrane that underlies the impulses or synaptic potentials (electrical changes due to the flow of ions at synaptic connections between nerve cells), but for the membrane pumps that pump back the ions to restore the ionic equilibrium across the membrane.
Sokoloff and his colleagues proposed to track this energy by using a slightly modified form of glucose, an isotope that lacks an oxygen on the number two carbon atom in the molecule; hence the name 2-deoxyglucose (2DG). 2DG is taken up like glucose by active cells but cannot be metabolized further. In large doses it therefore blocks metabolic activity, but if given in small doses (called tracer amounts) it shows where glucose is taken up without interfering significantly with it. The Sokoloff method involved injecting the substance into an experimental animal, stimulating in the desired way for 45 minutes, and processing the tissue by exposing slices of it to X-ray film to register where the radioactivity was located.
The early results with the method had demonstrated mapping of the visual cortex in the expected way, giving reassurance that the method should give reliable results in mapping brain areas where the results could not be predicted. The significance of this work was far reaching for all of brain science, because development of the 2DG approach led to positron emission tomography (PET) in humans, opening the way to modern brain scans with PET and functional magnetic resonance imaging (fMRI), and their related methods.
The “Aha” Moment
When Ed told us about this new method, it was still being tested physiologically by Frank. Ed cautioned us that one of the possible disadvantages of the method was that it seemed not to label impulse activity but rather mostly activity at the junctions (synapses) between neurons.
It was one of those moments that change one’s life. I looked at my postdoctoral colleague, John Kauer, and we realized that this was just what we needed. The incoming fibers (axons) of the receptor cells terminate in the glomeruli at a distance from the mitral cell bodies where the impulse response arises. Electrophysiological recordings from the mitral cell body were therefore a long way from the glomeruli, but the 2DG uptake should be right in the glomeruli where the input from the receptor cells makes its connections to the cells in the olfactory bulb. The 2DG method should therefore be well suited to testing our hypothesis that odors produce spatial patterns of activation of the glomeruli. Evarts and Sharp kindly invited us to join them to test this hypothesis.
The First Smell Patterns
I traveled in December 1974 to the National Institutes of Health to perform the initial experiments. For stimuli, remembering Adrian and the earthworm, I wanted to include something realistic, so Frank and I went to a local supermarket to buy some strong cheddar cheese. An advantage of the 2DG method is that it can be carried out in an animal that is awake, so we put it in a loose holder with its nose into an air stream. We did several controls (meaning with no odor) and several with cheese and with the chemical amyl acetate, which has a fruity banana odor. We did the experiments on rats and rabbits, and, not too hopefully, I left Frank to do the work in preparing the slides.
Early in January, Frank called, elated. There were small dots on the films. Could they mean anything? I asked. Yes, he exclaimed; they were the clearest activity he had seen with the method. Are you sure? I persisted. Yes, he repeated; you should have seen Ed dancing around the laboratory when he saw the dots!
John and I soon returned together to do more experiments, which also gave more positive results. There were sites of increased density on the X-ray films, meaning increased nervous activity, over limited parts of the glomerular layer. So rapidly did the story emerge for us in 1975 that we had to delay our paper to let the paper by the Sokoloff group on the 2DG method come out first. In our first report by Frank Sharp, John Kauer, and me, we wrote:
It appears that there may be a specific pattern of metabolically active sites within the bulb associated with odor stimulation by amyl acetate. This implies that a specific topographical pattern of neuronal activity might be associated with processing of this odor information. Preliminary results obtained with other odors (e.g., camphor, cheese) suggest that there may be differential spatial patterns associated with different odors or odor groups.
The idea that spatial patterns might play a role in olfactory processing is not new; it originated with Adrian and has been the subject of various subsequent studies. The present method recommends itself for direct analysis of this question.
We noted the advantages of the method: that it shows activity throughout the entire system (indeed, the entire brain) and does not interfere with the responses (as an electrode may do poking an active cell). In addition, it can be applied to an animal that is awake and behaving, and it can reveal activity in response to very weak stimuli. All these advantages applied as well to PET and the other methods of functional brain scans in humans.
To get an overview of the activity patterns and compare them with one another, in 1979 our lab, led by William Stewart and John Kauer, developed a pattern mapping procedure based on the fact that the olfactory bulb is approximately like a sphere except for the part where it is attached to the brain. We adapted a “projection” used for world maps, with coordinates reflecting longitude and latitude. It is called the Molweide projection; you can look it up in any world atlas.
In neuroscience terminology, this produces what are called flat maps. Our results showed activity foci within the glomerular layer, characteristic for a given odor. Taken together, the foci are overlapping but different for different odors. We therefore advanced the hypothesis that the odor discrimination postulated by Adrian could be based on discrimination between glomerular spatial activity patterns. The 2DG results also showed that, at the lowest odor intensities (at threshold for human perception), only one or a few foci were present, each focus presumably representing one or a few glomeruli. When odor intensity increased, so did the extent of activated glomeruli. This suggested that the activity patterns could also encode odor intensity.
Given these promising results, it might be supposed that many other laboratories adopted the method to confirm and extend the idea of odor patterns. However, there were several obstacles. The isotope was expensive, which put the method beyond the budgets and resources of most laboratories. The method required tedious histological procedures. And it required the use of radioactivity, which most physiology or psychology laboratories are not set up to deal with.
In the first extension of the method, Leslie Skeen of Delaware worked with Sharp to obtain evidence for pheromone stimulation of the olfactory bulb in the primate. André Holley and his colleagues in Lyon, France, soon adopted the method and supported and extended our results. They pointed out that the different patterns with different odors meant that odor recognition might fall under the general category of “pattern recognition” in the visual system, an essential idea mentioned in the previous chapter, and which has become a central concept for the neural basis of smell perception.
Archives of Smell Images
The basic findings with the 2DG method have been greatly extended by Michael Leon and Brett Johnson at the University of California, Irvine. (Their Web site contains an archive of more than 500 odor images. These and others can be accessed through SenseLab.)
Beginning in the 1990s, a number of new methods have been introduced for analyzing the activity patterns in the olfactory bulb. Many of them are summarized in an article by Fuqiang Xu, Charles Greer, and me published in 2000. (An archive for fMRI patterns can be found on the SenseLab Web site.) Just perusing Leon’s or the SenseLab sites gives you the essential impression of how endlessly variable these spatial patterns are, reflecting the endless variety of smell molecules. The brain uses these patterns to create our smell perceptions.