Incorporating Social Network Analysis into Traditional OD Interventions
A Case Study
SINCE THE Hawthorne Studies in the 1920s and 1930s, organizational researchers have recognized the importance of social interaction in the process of changing organizational behavior. This understanding has led to greater focus on the role of social relationships in organization development. According to Cross and Parker (2004), for example, social networks influence organizational outcomes by fostering collaboration, promoting knowledge sharing, and providing access to new, innovative ideas. Moreover, the changing nature of work, we suggest, has increased the importance of this perspective. As organizations design matrix structures, create virtual teams, forge alliances, and outsource functions, they are placing their faith in relationships to get work done.
In particular, informal social relationships have been identified as critical levers of organizational success. Unlike formal reporting structures or prescribed working relationships, informal social relationships are ad hoc relationships that are self-generated and self-managed by organizational members. The networks of these informal relationships within an organization often exist outside the boundaries of organizational charts, work processes, and standard operating procedures, yet are critical to business effectiveness. Cross and Prusak write, “Increasingly, it’s through these informal networks—not just through traditional organizational hierarchies—that information is found and work gets done,” (2002, p. 105).
OD practitioners have only recently begun to consider informal social networks in their practice, however (Bunker, Alban, & Lewicki, 2004). According to Krackhardt and Hanson:
Many executives invest considerable resources in restructuring their companies, drawing and redrawing organizational charts only to be disappointed by the results. That’s because much of the real work of companies happens despite the formal organization. Often what needs attention is the informal organization, the networks that employees form across functions and divisions to accomplish tasks fast. These informal networks can cut through formal reporting procedures to jump start stalled initiatives and meet extraordinary deadlines. (1993, p. 111)
The lack of attention to informal social networks, we propose, creates an organizational blind spot. Fortunately, methods such as Social Network Analysis offer a way for organizations to identify, analyze, and affect this critical component of organizational life.
The purpose of this article is to introduce Social Network Analysis and to describe how the method can be integrated with other forms of OD to transform organizations. The paper begins with a brief overview of Social Network Analysis. It then describes the case of a Fortune 500 consumer healthcare company that integrated business process redesign and Social Network Analysis to increase the organization’s ability to create innovative new products. Finally, the paper describes key learnings stemming from the case.
Social Network Analysis
Social Network Analysis (SNA) is a tool for identifying, analyzing, and assessing the networks of informal social relationships that exist within an organization. Some practitioners distinguish Organizational Network Analysis (ONA) from Social Network Analysis. ONA is an adapted form of SNA used specifically in business contexts. We use the term SNA in this article because the term is more widely used and because the techniques and concepts applied in this article are drawn from the SNA literature. For more information on the distinction between SNA and ONA, please see Anklam, Cross and Gulas (2005).
SNA provides an X-ray of the organization’s informal communication patterns, illuminating the way in which organizational members actually work and interact with one another.
Because informal social networks are crucial to organization effectiveness but are often overlooked, the information garnered through SNA often identifies new challenges or opportunities for performance improvements. For example, SNA might show a lack of collaboration between two departments that depend on one another. Alternatively, it might identify individuals with critical expertise whose knowledge is not being effectively tapped by the larger organization.
Examples of Social Network Analysis Questions
Typically, online or paper-and-pencil based surveys are used to collect the data needed for Social Network Analysis. The survey questions are designed to provide information on the existence of absence, as well as the quality, of the relationships in question. While typical social network questions focus on information-sharing relationships, friendship relationships, and resource-exchange relationships, the type of social relation that could be investigated is bounded only by one’s imagination and the specific research question.
Examples of SNA survey questions include:
• Who do you communicate with on a weekly basis about New Product Development?
• Who do you contact for career-related advice?
• Who do you rely on for information or problem solving to do your work?
For more information on social network questions or how to conduct a social network analysis, see Cross and Parker (2004).
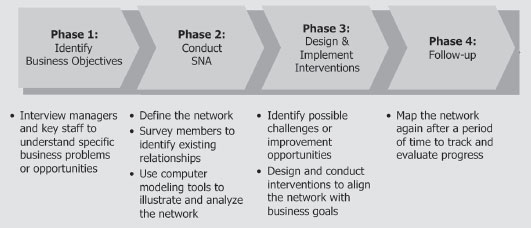
Figure 39.1 provides an overview of the four phases usually involved in a SNA.
Phase 1: Identify Business Objectives
The purpose of the first phase is to clearly identify the project’s business objective. This typically entails meeting the project’s sponsors to understand what is expected of the project. This business objective anchors the project and determines the appropriate type of SNA to be used.
Phase 2: Conduct SNA
The second phase consists of conducting the SNA. This phase entails defining the specific relationships of interest, such as information-sharing or friendship, and identifying the people, teams, or departments to include in the analysis. Also included in this phase is data collection. While data can be collected in a variety of ways, including observations or examination of archival records such as email traffic, surveys are the most popular technique for collecting social network data (please see the sidebar for examples of SNA questions). Finally, this second phase requires the usage of computer software to analyze and illustrate the social network. During this portion of the project, SNA measures, such as density, are calculated and evaluated in the context of the organization’s business objective to identify performance improvement opportunities.
Phase 3: Design & Implement Interventions
Phase Three entails sharing the SNA results with the client and working with them to design and implement the appropriate OD intervention. The specific intervention depends upon the business objective and results of the SNA but could entail individual coaching, team building, or even a large-group intervention including multiple organizational functions.
Phase 4: Follow-up
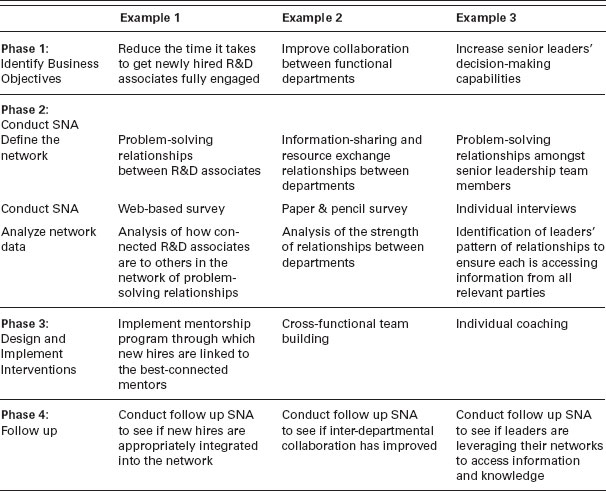
Finally in Phase Four, the network is mapped again to track progress and to make midcourse corrections. Table 39.1 provides three examples of how a SNA project might unfold given three different business objectives.
Case
In 2005, a Fortune-500 consumer healthcare products organization, Global Health Products (name changed), established a goal of increasing sales through the use of innovative product packaging. The company’s consumer research indicated that packaging was growing in importance to consumers and Global Health Products wished to capitalize on this trend. Additionally, in a market cluttered with advertising, the company believed that a product’s on-the-shelf packaging represented the only opportunity to communicate with 100% of potential consumers.
Despite its best efforts, Global Health Products had difficulty achieving its goal. Efforts to create innovative packaging routinely resulted in long product development delays and costly rework. In one extreme example, not only was the project delayed by over 12 months, but the company ultimately had to discard millions of dollars of manufacturing equipment and product components.
Leaders at Global Health Products believed that the root cause of the problem was a poorly-defined packaging development process. To address this issue, Global Health Products asked us to define a new process for the development of product packaging.
Initially, we believed that the project was a relatively straightforward process redesign effort in which we would interview key stakeholders, map a new packaging development process with clearly delineated roles and responsibilities, and create a set of performance-support tools to aid employees in executing the process.
As we began our stakeholder interviews, however, we became concerned. Our interviews suggested that the R&D and Manufacturing departments were not collaborating effectively. This was a significant concern because the design of effective packaging requires that the two departments work together closely. R&D needs to ensure that the packaging protects the integrity of the product formulation while Manufacturing needs to make certain that the packaging can be produced cost effectively. Only by integrating the expertise of both departments could Global Health Products develop reliable, cost-effective and innovative packages.
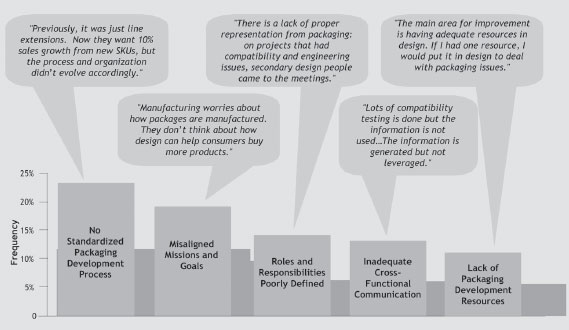
As can be seen from Figure 39.2, however, the biggest themes stemming from the stakeholder interviews included misaligned missions and goals between R&D and Manufacturing; and inadequate cross-functional collaboration.
This suggested that the company’s problem would not be solved simply by reengineering the packaging process.
We needed a way to improve the underlying relationships between the R&D and Manufacturing departments. Since both functions were reluctant to engage in what they regarded as “soft” team-building activities, we decided to conduct a SNA. Although SNA is a tool that can be used to improve relationships, the methodology is quantitative and appeals to those with a preference for “hard” numbers. After briefing them on the nature of SNA, our clients were more open to the suggestion that we take a closer look at the nature of their working relationships.
We began by identifying the specific type of relationships in which we were interested. In this case, it was the sharing of information related to packaging development. In SNA, identifying the appropriate network of individuals from whom to collect data is a critical step. Unlike marketing research, where data from a sample of the population can be sufficient for analysis, SNA requires data from the entire population; otherwise central members can be omitted and result in an inaccurate model of the network. We therefore surveyed all key stakeholders in the R&D and Manufacturing departments to determine who contacted whom regarding packaging development. Finally, we processed the data and used SNA software to illustrate and analyze network characteristics.
What we found was interesting. The analysis confirmed the dramatic lack of cross-functional communication between R&D and Manufacturing. As can be seen in Figure 39.3, the only confirmed relationship between the two departments existed between Warren and Sam (names changed). Confirmed relationships are those in which one party reports that he or she communicates with a second party, and the second party confirms that the communication does take place.
This lack of cross-departmental communication helped explain the organization’s inability to develop innovative packaging. Networks such as this one, which lack cross-functional communication, tend to be very efficient at completing isolated, repeatable tasks but typically struggle with collaborative work.
A second insight gleaned from the SNA was the tremendous variability in the degree to which the R&D team was contacting different members of the Manufacturing team. Recall from Figure 39.2 that one of the key interview themes was that the Manufacturing team was under-resourced. The SNA provided an alternative hypothesis. It suggested that the issue might not be a lack of resources, but instead an uneven utilization of Manufacturing team resources. As can be seen from Figure 39.4, some members of the Manufacturing team were contacted three times as frequently as their peers.
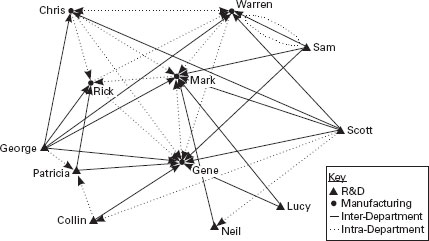
FIGURE 39.3 Confirmed Cross-Functional Initial Communication Between R&D and Manufacturing
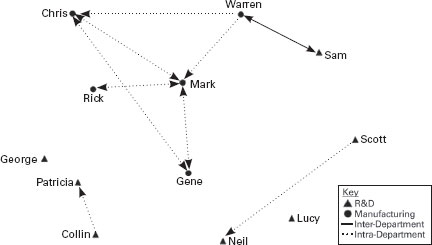
Individuals were asked to indicate who they contact for information regarding packaging development. Circles represent members of the Manufacturing department and triangles represent members of the R&D department. Dashed arrows represent confirmed intra-departmental communication, with the originator at the unmarked end and the receiver at the arrowhead. (e.g., in the network map above, Scott contacts Neil and Neil has confirmed that Scott contacts him). Solid arrows represent confirmed inter-departmental communication. Note: In the figure above, spacing between the nodes is not intended to convey information. Visual clarity was the objective for the spacing between the nodes. For more information on how network diagrams are created, see Hanneman and Riddle (2005).
Moreover, Gene, the most contacted member of the Manufacturing team, had been frequently identified in our stakeholder interviews as a bottleneck in the packaging development workflow. An examination of the relationships focused on Gene suggests why that may be (see Figure 39.5). Although most of the R&D team members indicated that they contacted Gene for packaging development, Gene did not confirm that these individuals sought him out. This discrepancy suggests that Gene was unaware of R&D efforts to seek his assistance (Figure 39.5). A process reengineering project on its own would have been unlikely to identify the reason for this bottleneck in the workflow.
Our SNA provided value to the project in a number of important ways. First, we used the data from our SNA to convince our clients that their failure to develop innovative packaging was caused as much by a lack of cross-functional communication as it was by an inadequate process. In addition, the social network maps had a transformative effect, helping leaders of the R&D and Manufacturing teams to visualize the ways in which their existing interaction patterns and lack of communication were undermining the organization’s goal. As a result of this insight, the teams’ leaders agreed to engage both the R&D and Manufacturing teams in a series of collaborative workshops to co-develop the packaging development process. Without the SNA results, it is uncertain that the department heads would have embarked on those collaborative efforts.
FIGURE 39.4 Initial Frequency of Contact by Manufacturing Team Member
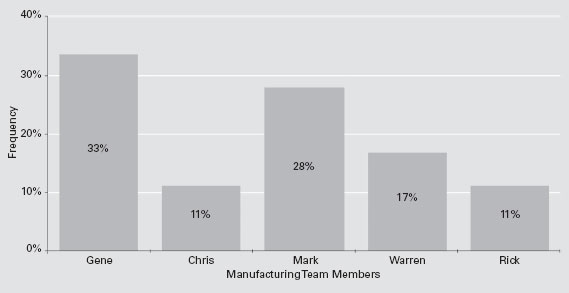
The bar chart shows the frequency by which R&D team members indicated that they contact one of the above five members of the Manufacturing department regarding packaging development. Data regarding both confirmed and unconfirmed communications were used for the above charts. We can see that the distribution is uneven since R&D team members seek Gene three times more than either Chris or Rick.
FIGURE 39.5 Initial Confirmed and Unconfirmed Ties for Gene
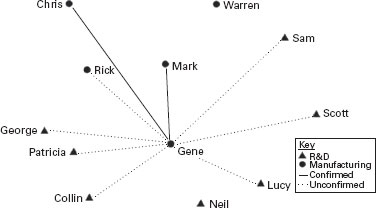
Only the communication indications directed toward Gene have been shown. The circles represent members of the Manufacturing department and the triangles represent members of the R&D department. Solid arrows indicate confirmed communication ties while dashed arrows indicate unconfirmed communication ties. The network above shows that while individuals such as Sam and Patricia indicated that they had contacted Gene regarding packaging development, Gene did not confirm that these individuals had sought him. Gene confirmed that only Chris and Mark had sought him. The contrast between the confirmed and unconfirmed communication ties illustrates Gene’s unawareness of his status as a central point of contact for packaging development, exacerbating the challenges already associated with cross-functional collaboration.
During these collaborative workshops, the members of R&D and Manufacturing interacted with one another to share information and solve the thorny issues of roles and respective responsibilities during packaging development. While the workshops produced an agreed-upon packaging development process, the biggest success was the relationship forged between the two teams. According to one VP, he was amazed at seeing the positive interaction between the R&D director and Manufacturing director when they co-presented the new packaging development process.
A second way in which the SNA contributed to the project’s success was by providing a means to quantify results. At the start of the project, the R&D and Manufacturing teams were barely communicating about packaging development. A SNA map at the end of the project’s design phase showed a very different picture. Figure 39.6 shows a dramatic 22-fold increase in confirmed cross-department communication relationships compared to the initial network (Figure 39.3).
We were also able to quantitatively show how utilization of Manufacturing resources had changed after the end of the project’s design phase. Figure 39.7 shows the sharp decrease in variance in the utilization of Manufacturing resources. Prior to the project, Gene in Manufacturing was contacted three times more frequently than his colleagues (see Figure 39.4). But after the project, the difference between the most frequently and least frequently utilized manufacturing resources was 1.2-fold (see Figure 39.7).
Ultimately, the SNA contributed to the overall success of the project. After piloting the new packaging development process, Global Health Products rolled-out the new process across the entire organization. An analysis of archival Project Management data on previous packaging failures indicated that the initiative would reduce new product cycle time by as much as three months.
FIGURE 39.6 Post-Project Confirmed Cross-Functional Communication Between R&D and Manufacturing
At the end of the project’s design phase, individuals were asked to indicate whom they contact for information regarding packaging development. Circles represent members of the Manufacturing department and triangles represent members of the R&D department. Dashed lines represent confirmed intra-departmental communication, with the originator at the unmarked end and the receiver at the triangle end of the line. (E.g., Scott contacts Neil). Solid lines represent confirmed interdepartmental communication. The dotted oval at the top right of the figure highlights the only confirmed inter-departmental communication that had existed initially. This network map illustrates the dramatic increase in inter-departmental collaboration.
FIGURE 39.7 Post-Project Frequency of Contact by Manufacturing Team Member
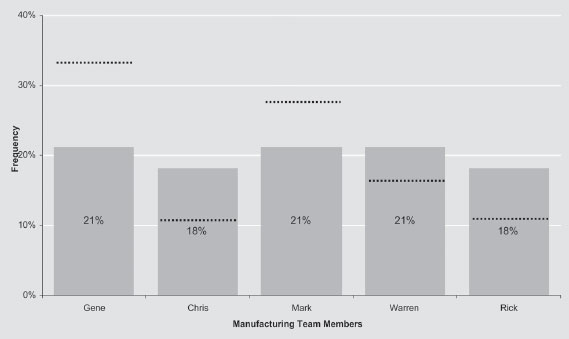
The bar chart shows the frequency by which R&D team members indicated post-project that they contact one of the above five members of the Manufacturing department regarding packaging development. The dotted line marks the pre-project frequency of contact. Post-project frequency of contact percentage values are listed on the bar charts. The bar charts reveal that utilization of Manufacturing resources became more evenly distributed post-project.
Key Learnings
Our experience integrating SNA into our OD projects has led us to several conclusions. The first is that SNA is highly complementary with other forms of OD. In particular, SNA provides a way of quantifying organizational phenomena. OD work is often criticized as a touchy feely, “soft” discipline from which tangible, quantifiable results are difficult to obtain. While this criticism may be unwarranted, the network metrics provided by SNA allow OD researchers and practitioners to show “hard” numbers. In our project with Global Health Products, this quantification helped convince our clients to let us involve a greater number of R&D and Manufacturing personnel in the process redesign workshops.
SNA also provides a new lens—the lens of social relationships—with which to view the organization. This perspective often provides new information, which informs our projects and improves the solutions we develop. For example, in the case of Global Health Products, had we not conducted a SNA, we may have incorrectly concluded, based on our stakeholder interviews, that the Manufacturing department was simply understaffed. Instead, we were able to show that the lack of capacity was the result of an unbalanced workload as opposed to a lack of resources.
SNA is not a silver bullet, however. Like traditional organizational surveys, SNA is one tool that can provide valuable insight to an organization. What really matters from an OD perspective is how that insight is applied to change the organization. In the case of Global Health Products, the real change took place in the interactions between R&D and Manufacturing team members during our facilitated collaborative workshops. It was during these sessions that participants shared ideas, co-developed solutions, and most importantly, built and strengthened relationships for ongoing work.
Finally, the integration of SNA into projects brings with it important ethical considerations. For example, unlike traditional survey techniques, SNA does not lend itself to respondent anonymity. For the data to be meaningful, the person analyzing the data needs to know the respondents’ identities in order to record relationships between two people. While the scope of this article does not allow for a complete discussion of SNA’s ethical considerations, we urge interested readers to see Borgatti and Molina (2003).
Conclusion
As described throughout this article, social relationships have taken on an increased importance in the workplace. SNA provides a means to illuminate these relationships and assess the extent to which they are helping or hurting the organization’s efforts to achieve its goals. As a result, SNA is a valuable tool for the field of OD. By integrating SNA into their practice, OD practitioners can gain valuable insights and help transform their client’s organization. While the case we describe focuses on integrating SNA and business process re-engineering, the interested reader need only rely on creativity to find additional SNA applications.
References
Borgatti, S. P., & Molina, J. L. (2003). Ethical and strategic issues in organizational social network analysis. Journal of Applied Behavioral Science, 39(3), 337–349.
Bunker, B.B, Alban, B. T., & Lewicki, R. J. (2004). Ideas in currency and OD practice: Has the well gone dry? Journal of Applied Behavioral Science, 40(4), 403–422.
Burke, W. W. (2002). Organization change: Theory and practice. Thousand Oaks, CA: Sage
Cross, R., & Parker, A. (2004). The hidden power of social networks. Boston, MA: Harvard Business School Publishing.
Cross, R., & Prusak, L. (2002). The people who make organizations go—Or stop. Harvard Business Review, 80(6), 104–112.
Hanneman, R., & Riddle, M. (2005). Introduction to Social Network Methods. Online textbook. Department of Sociology, University of California, Riverside. http://faculty.ucr.edu/˜hanneman/nettext.
Krackhardt, D., & Hanson, J. (1993, July-August). Informal networks: The company behind the chart. Harvard Business Review, 71(4), 104–111.
For Addition Information, See Also:
Cross, R., Liedtka, J., & Weiss, L. (2005). A Practical Guide To Social Networks. Harvard Business Review 83(3), 124–132.
Ehrlich, K., & Carboni, I. (2005). Inside Social Network Analysis. IBM Technical Report 05–10.
Hanneman, R., & Riddle, M. (2005). Introduction to Social Network Methods. Online textbook. Department of Sociology, University of California, Riverside. http://faculty.ucr.edu/˜hanneman/nettext.
Kleiner, A. (2002). Karen Stephenson’s Quantum Theory of Trust. Strategy + Business (29), 2–14.
Laseter, T., & Cross, R. (2006). The Craft of Connection. Strategy + Business (43), 26–32.