1
THE PRE-TRUMP BUILDUP OF TRADE DISCRIMINATION
SCALE, DRIVERS, AND EFFECTS
SIMON EVENETT
The implementation of President Donald Trump’s America First trade policy, which by mid-2020 had imposed import tariffs on approximately $300 billion of trade, was regarded by many analysts as a defining moment for the multilateral trading system. Some contrast brazen US unilateralism with policy choices in the years before, often crediting world trade rules with reining in protectionism. Paul Krugman, for example, has argued: “The world trading system is actually a quite remarkable construction—a framework that has consistently produced a high level of global cooperation. It has been pretty robust in the face of severe shocks—notably, the world did not see a resurgence of protectionism after the 2008 financial crisis” (Krugman 2018).
But is this true? Did governments refrain from discriminating against foreign commercial interests during and after the worst global economic crisis in three-quarters of a century? For those who only associate protectionism with tariff increases, the answer is clear: there was no resurgence in protectionism. But as every economics student who has taken an international trade class knows, tariffs are not the only policy instrument available to governments to discriminate against foreign commercial interests.
Much is at stake. There is the reputation of the World Trade Organization (WTO) to think of. Coming on top of the failure to conclude the Doha Development Agenda and the breakdown in the Appellate Body, a finding that WTO rules did not prevent widespread discrimination against foreign commercial interests during the crisis era would cast a darker cloud over the state of global cooperation on trade policy. An alternative perspective is that it may have been too much to expect an incomplete trade rulebook to rein in the behavior of desperate governments.
A finding that there has been widespread resort to trade discrimination might also call into question our understanding of both unilateral trade policy choice (in particular the literature relating business cycles to protectionism) (Rose 2013) and the theory of the WTO. Over the past twenty years the thrust of the latter has been to explain why cooperation between governments happens under the auspices of the WTO (Bagwell, Bown, and Staiger 2016). Where does that theory stand if the predominant feature of the past ten years has been unilateral, extensive resort to trade discrimination? Or, put differently, if the past decade has witnessed substantial resort to trade distortions, then how can this be reconciled with a body of theoretical work whose central finding is that governments forgo short-term advantage?
The evidential point of departure in this chapter from other assessments of the crisis-era protectionism that focus on tariff changes and trade defense actions (Bown 2011; Kee, Neagu, and Nicita 2013) is to employ a dataset that contains not only these policy instruments but other trade distortions as well. Those other trade distortions relate not only to measures that restrict imports but also to policies that stimulate exports. Once consideration is given to the gamut of public policies that can discriminate against foreign commercial interests, then the scale of commerce affected changes markedly from the low percentage points of trade affected that are reported, for example, in the WTO’s monitoring reports on protectionism.
So as to be clear, I make no claim to have discovered nontariff measures or to be the first to study them. Baldwin (1970) serves as an important reminder that alert trade analysts have long been aware of the potential significance of policies other than tariffs and trade defense. Moreover Bhagwati (1988), among others, showed that resort to voluntary export restraints was the preferred discriminatory response following the sharp downturn of the early 1980s, not tariffs. Furthermore, agricultural trade economists have long been interested in the impact of state-provided export incentives, the importance of which in the contemporary era will soon become apparent.
Despite receiving a mandate from governments to document, measure, and assess nontariff measures in 1969, the United Nations has not been able to deliver reliable data on these state acts. Now that a database is available that contains lots of information of tariffs and nontariff measures, one goal of this chapter is to examine the amount of trade covered by different policy interventions that discriminate against foreign commercial interests. It is therefore possible to see whether focusing solely on tariffs and trade defense actions provides a misleading assessment of the scale of trade discrimination witnessed since the start of the global financial crisis in 2008.
Complicating the assessment of the impact of the WTO on government resort to trade discrimination is the fact that from November 2008 to December 2018 the leaders of the G-20 governments foreswore resort to certain trade policy instruments. The G-20 pledge to eschew protectionism was not a binding, enforceable obligation, unlike WTO commitments. For some, then, the G-20 pledge was cheap talk. However, for others—in particular, numerous political science, international relations, and international legal scholars—such “soft law” can alter behavior. This begs the question whether the pattern of discriminatory policy choice by the G-20 nations differed from those of other nations.
An exploratory empirical analysis of the determinants of G-20 and non-G-20 nations’ resort to trade discrimination is conducted here. This analysis is far from definitive, but given the lack of research on the drivers of trade discrimination, it is a start that other analysts may wish to build upon. Since Eichengreen and Irwin (2010) demonstrated the importance of substitutability between tariff increases and devaluations of the national currency in the 1930s, consideration is given here to the possibility of substitution or complementarity between exchange rate changes as well as fiscal stimulus packages and the resort to trade discrimination.
An implication of the “embedded liberalism” perspective advanced by Ruggie (1982) is that international trade norms—such as nondiscrimination—can be suspended by governments if social or economic order is threatened by a crisis. Here I examine the extent to which the resort to trade discrimination correlates with the change in unemployment at the beginning of the global financial crisis.
I also examine the possibility that WTO obligations might have affected the form rather than the quantum of trade discrimination. Specifically, I present evidence on whether the extent of precrisis tariff binding overhang is correlated with measures of national trade policy once the global financial crisis hit. Taken together, the results of this exploratory empirical analysis shed light on whether G-20 government behavior differs from that of other nations and where it does not.
The emphasis throughout the chapter is on policy choice before President Trump was inaugurated. Given that his election was largely unanticipated, in particular before the second half of 2016, then the policy choices of other governments are unlikely to have been influenced by the expectation of his election and the America First trade policies that might follow.
In the remainder of the chapter I present evidence on the share of goods trade affected by crisis-era discrimination since November 2008. I compare the scale of pre-Trump trade discrimination worldwide with the amount of Chinese exports hit by US tariff increases in 2018, hence putting the first year of the Sino-US trade war in perspective. I present and analyze two sets of comparisons between the trade-related policy choices of the G-20 members and those of other nations.
DATA SOURCES EMPLOYED
The database on commercial policy intervention used in this study is the Global Trade Alert (GTA). Established in June 2009, it seeks to document all public policy changes that alter the relative treatment of domestic in relation to foreign firms around the world.1 Country coverage, therefore, extends beyond the G-20. Identifying changes in public policy implies that the GTA database is best thought of as revealing the “delta” (the change) in public policy toward international business rather than the height or size of any trade distortion or liberalization.
The GTA does not confine itself to a predefined set of trade policy instruments or to those policy instruments covered by WTO agreements.2 Nor does the GTA confine itself to measures that harm foreign commercial interests; liberalizing policy interventions are recorded too. Moreover, governments may discriminate against foreign commercial interests in markets abroad, not just in their home markets. Therefore, where relevant, the evidence includes changes in public policy toward exporters as well.
Wherever possible, official sources are used to document a public policy intervention; this has been the case in over 93 percent of the interventions documented. As of this writing, the Global Trade Alert database includes information on 20,477 different public policy interventions, over 14,000 of which harmed foreign commercial interests.3
The GTA database uses the classifications for nontariff measures developed by the United Nations (UN) Multi-Agency Support Team (MAST). Where possible, nontariff measures, including tariff rate quotas, are assigned to their respective MAST “chapter;” the next section refers to different MAST chapters.4 Later I make a distinction between the more transparent commercial policy interventions and less transparent state actions and use the MAST classification to give a precise definition of the former.
Each entry in the GTA database contains information on the implementing jurisdiction; the dates a measure was announced, came into effect, or lapsed; the policy instrument used; the products or services affected; the sector affected; and a description of the measure.5 From this information, it uses automated means to establish which trading partners are affected by the implementation of a measure. For example, if Switzerland raises the tariff on imported butter, then fine-grained UN trade data (from the UN COMTRADE database) are used to identify which trading partners exported butter to Switzerland in the year before the measure came into force. It assembles so-called support tables for international trade in goods, foreign direct investment, migration, and where possible services trade so that the identification of affected trading partners is subject to the least human intervention possible (thereby reducing the potential for human error).
To avoid including public policy interventions that are likely to have trivial effects on international commerce, the GTA team uses minimum thresholds. For example, trading partners for whom less than $1 million of trade is affected by a foreign state act are not included in reports of policy interventions contained in the GTA database. Moreover, state aid involving less than $10 million of state largesse or less than $10 million of commerce are excluded as well.
For each public policy intervention affecting goods trade in the GTA database, which includes information on the implementing jurisdiction, the product codes affected, and the affected trading partners, it is possible to calculate the total value of international trade that is “covered” or potentially affected by the implementation of that intervention. Given that the implementation of an intervention in a given year could affect the amount of trade in that year, estimates of the potential trade affected must come from prior years.
So as to avoid crisis-era intervention affecting any of the trade-affected calculations, the GTA team uses the global trade flows available at the six-digit level of the UN Harmonized Commodity Description and Coding System for 2005–2007, one to three years before the crisis began, to define the shares of world goods trade affected by each intervention. Data on the total value of global trade in the year before an intervention is implemented, as well as the calculated share of world trade, are then used to estimate the total amount of trade affected by the implementation of that intervention.6
The use of the GTA database in research, business analyses, media articles, and by governments is growing. At this writing in 2020, there are 1,690 entries in the Google Scholar database that mention the GTA and its findings. The GTA database is frequently downloaded from its website.7 In 2016, the International Monetary Fund (IMF) noted that “the Global Trade Alert database has the most comprehensive coverage of all types of trade-discriminatory and trade-liberalizing measures, although it begins only in 2008” (IMF 2016). An independent comparison of available datasets on crisis-era trade policy found that the GTA had the largest country coverage of nontariff measures (Rau and Vogt 2019).
In the exploratory data analysis conducted here, I use three macroeconomic indicators. The data source for each is the World Bank’s World Development Indicators. The first seeks to capture the scale of the fiscal stimulus that a government undertook and is measured by the logarithm of the ratio of final government consumption spending on goods and services at the end of a given period to that at the beginning of the time period in question. The second indicator relates to exchange rate depreciation. Here the specific measure used is the percentage depreciation in the value of a national currency against the US dollar during the period in question. The third indicator relates to the dislocation in a national labor market at the start of the global financial crisis. This is measured as the increase in percentage points of the unemployment rate from 2007 to 2009.
As part of the exploratory data analysis it was necessary to construct a measure of how constrained a WTO member’s tariff policies were by its respective tariff bindings just before the global financial crisis began. Using the WTO publication Tariff Profiles 2008 it was possible to calculate the difference between the mean bound tariff rate and the mean applied tariff rate for all goods for 2007 (or for the latest year available). Of the 123 jurisdictions for which these data were available, 96 had a tariff binding overhang of more than 7 percentage points.
The 7 percentage point threshold is important because it equals the size of the tariff increase undertaken by the United States when it implemented the Smoot-Hawley Tariff Act in 1930. Therefore, 78 percent of the WTO members for which data are available could have raised their tariffs by the same amount as Smoot-Hawley and not broken their WTO obligations at the beginning of the global financial crisis of 2008. Several large emerging markets (but not China) could have done so. Such evidence already casts doubt on the degree to which WTO obligations actually limited resort to trade discrimination at the start of the global financial crisis. Indeed, it would be better to argue that these 96 governments did not raise their tariffs significantly at the beginning of the crisis because they chose to, not because they were prevented from doing so by their WTO commitments.
The discussion now turns to an assessment of the amount of global trade affected by the buildup of discrimination against foreign suppliers of goods since November 2008, the month that the G-20 leaders declared for the first time that they would eschew protectionism.
THE BUILDUP OF CRISIS-ERA TRADE DISCRIMINATION WORLDWIDE
This section summarizes the principal implications of the GTA’s data on the global goods trade that faces policy-induced discrimination. Although the focus of this chapter is on developments before President Trump was inaugurated, data for the years 2017–2019 are also presented for the sake of completeness.
In estimating the scale of world goods trade facing discrimination imposed by foreign governments, it is important to take these factors into account:
- a discriminatory measure may lapse or be removed,
- a measure may be implemented during a year and therefore require some adjustment for duration in force,
- a particular trade flow may face multiple policy-induced trade distortions when competing at home or abroad, and
- state-provided export incentives by other governments may create trade distortions for a nation’s exports to third markets.
Each of these factors has been accounted for in the estimates that follow.
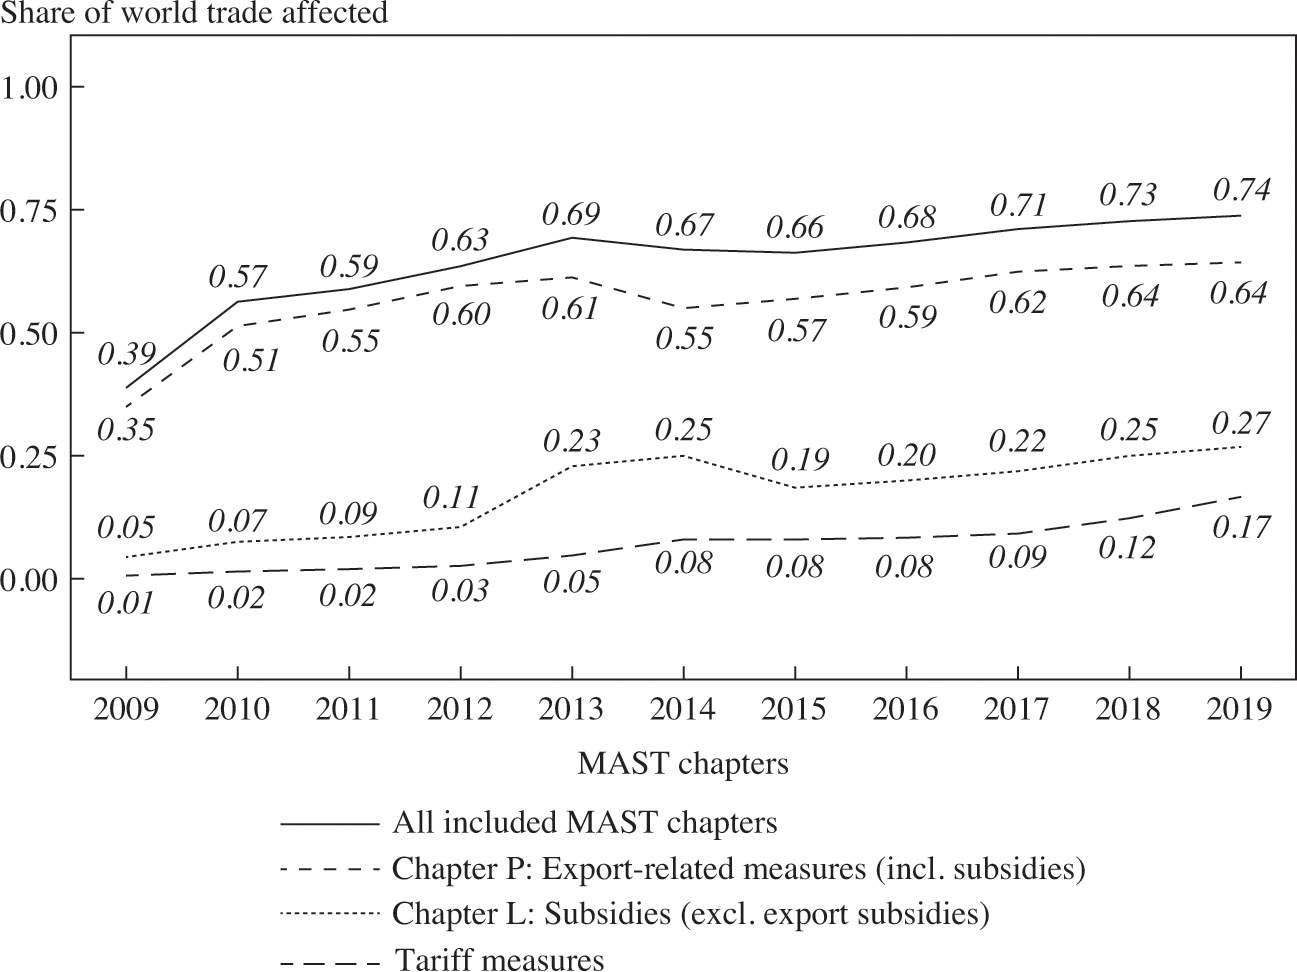
FIGURE 1-1. By 2016, more than two-thirds of global goods trade faced trade distortions implemented since the crisis began in 2008.
Source: Trade shares estimated using information on policy changes from the Global Trade Alert database and detailed international trade data from the UN COMTRADE database.
Note: MAST chapters = classifications for nontariff measures developed by the United Nations Multi-Agency Support Team (MAST).
Figure 1-1 presents, for each year from 2009 to 2019, estimates of the shares of world goods trade affected by every trade distortion in force in a given year (see the line “All included MAST chapters”).8 Given that the GTA started collecting data in November 2008, it should be noted that the shares presented would have been zero at the start. The reported shares therefore reveal how much of global goods trade was affected by the trade discrimination introduced since the beginning of the global financial year and that remained in force during each subsequent year. By 2016, before President Trump was inaugurated, more than two-thirds of global goods trade faced one or more trade distortions that were in effect that year.
The buildup over time in the shares of global goods trade affected by trade discrimination is shown clearly in figure 1-1. There was a huge jump at the start of the crisis era. In 2009, 39 percent of world goods trade competed against trade discrimination that had been implemented in the previous fourteen months (that is, since November 1, 2008). By 2010, the share had jumped to 57 percent, from which it rose more slowly to 69 percent in 2013. A plateau of sorts emerged during the period 2013–2016. After 2016, the share of world goods trade affected rose further, reaching 74 percent in June 2019.
Figure 1-1 also breaks down the total share of world goods trade affected by trade discrimination into three categories of policy instrument: import tariff increases, subsidies to import-competing firms (MAST chapter L), measures that affect exports including export incentives (MAST chapter P).9 There are several pertinent findings.
First, in each year before and after President Trump was inaugurated, the share of world goods trade affected by measures to promote exports is larger than the shares affected by subsidies to local firms and by import tariff increases. From the global perspective, measures to expand exports and grab market share from foreign rivals are on a greater scale than measures to restrict imports.
Notice also that, in 2009, when many policymakers were worried about governments turning inward and succumbing to the import restrictions of the 1930s, in fact over one-third of world goods trade was affected by new export incentives. As policymakers pinched the protectionist balloon in one place, air was displaced, not eliminated.
It is, therefore, particularly unfortunate that so many trade analysts, journalists, and policymakers link trade discrimination or protectionism to import restrictions and falling world trade. Every agricultural trade economist is aware of the effects of export subsidies on global food trade. During the crisis years, that problem spread to manufactured goods trade, the WTO rules on export incentives for such goods notwithstanding.
Second, the fact that the share of global goods trade affected by export incentives fell in 2014 and the share affected by subsidies to local firms fell in 2015 implies that there is nothing inherent in the construction of the GTA dataset that implies these shares must rise over time.
Third, even though tariff increases in 2018 and 2019 received a lot of attention, in fact subsidies to import-competing firms still affect a larger share of world goods trade. Without in any way diminishing the potential resource misallocation and damage done by import tariff increases, taken together with the finding about export incentives, different types of subsidies dominate crisis-era trade discrimination. It may be that such subsidies are harder to detect—perhaps because they can be easier for governments to hide—but that does not deny their potential economic significance.
Fourth, underlying the statistics presented in figure 1-1 are thousands of discriminatory policy interventions documented by the GTA team. This serves as an important reminder that the world trading system can become thoroughly distorted by the accumulation of trade distortions. High-profile protectionist acts, such as Smoot-Hawley, are not necessary for a world trading system to become riddled with distortions.
Fifth, since figure 1-1 does report data on the shares of goods trade affected since President Trump was inaugurated, it is worth noting that the share of world trade affected by import tariff increases more than doubled from January 2016 to June 2019. Over the same timeframe the share of world goods trade affected by export incentives and subsidies to local firms also rose significantly. There is no suggestion that the United States is responsible for all of these changes.
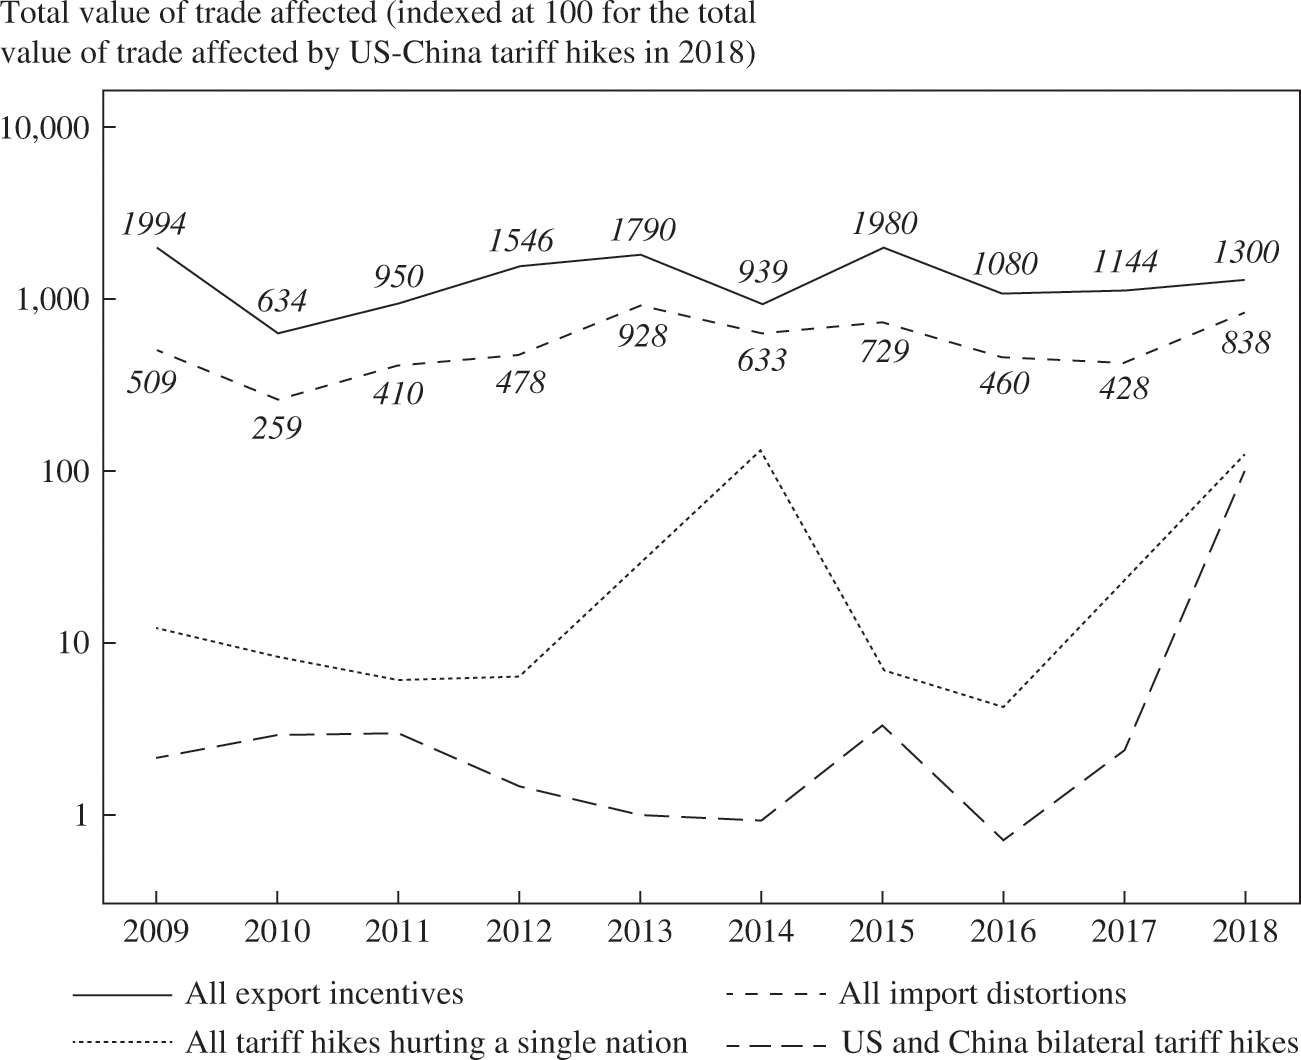
Figure 1-1 can be thought of as revealing the share of world goods trade affected by the stock of trade distortions in force in each year. Another way of assessing the scale of world trade affected by government resort to trade discrimination is to compare the amounts of trade implicated by new trade distortions that are implemented each year. Figure 1-2 presents data on the latter.
Given the interest in the Sino-US bilateral tariff war, rather than report actual amounts of trade affected, each piece of data is benchmarked against the total value of Sino-US trade affected by tariff increases in 2018, indexing the latter at 100. Figure 1-2 presents data for each of the years 2009 to 2018 on the indexed value of trade affected by (a) US tariff increases that target only China and vice versa, (b) all tariff hikes that harm only one nation’s exports, (c) all import distortions implemented in a given year, and (d) all export incentives implemented in a given year. Note also that the vertical axis of figure 1-2 uses a logarithmic scale.
The line at the bottom of figure 1-2 confirms that Sino-US targeting of each other’s exports was unusually high in 2018, indeed at least ten times higher than any year from 2009 to 2017. Targeting with tariff increases of any one nation’s exports, which includes of course US targeting of Chinese exports and vice versa, spiked in 2014. This increase reflects the EU’s withdrawal of trade preferences from Chinese goods, which came into force that year.10 Not all tariff increases have the public profile of those imposed by the Trump administration.
FIGURE 1-2. Trade affected by the Sino-US bilateral tariff war pales in comparison with global totals for annual resort to new import distortions and new export incentives.
Source: Trade shares estimated using information on policy changes from the Global Trade Alert database and detailed international trade data from the UN COMTRADE database.
A key finding in figure 1-2 is the extent to which the trade affected by new import distortions of any kind is, in every year, multiples of the tariff increases associated with the Sino-US tariff war in 2018. In fact, in 2018 the ratio of trade affected by new import distortions that year to trade affected by the tariff hikes between the United States and China was over eight, implying that plenty of other import restrictions were being imposed while attention focused on developments in Beijing and Washington. Another implication is that most policy interventions that restrict or limit imports do not target a single trading partner.
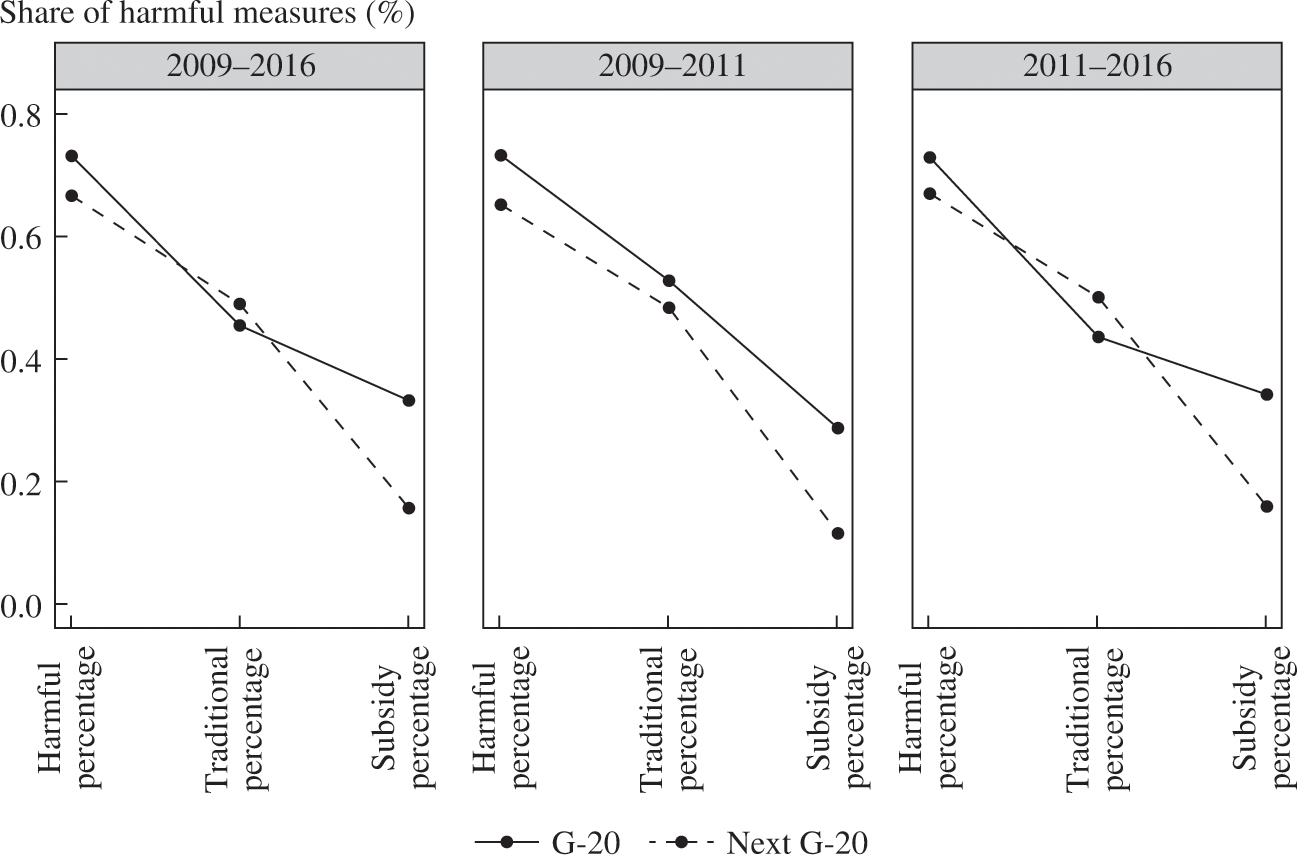
FIGURE 1-3. The G-20 resorted to more trade discrimination and more subsidies than the next twenty largest trading nations.
Source: Global Trade Alert database.
Another striking finding of figure 1-3 is that in every year the implementation of new export incentives has implicated more trade than that associated with new import distortions. The findings imply that in 2009 nearly twenty times as much trade was affected by new export incentives implemented that year than by the trade at risk from the bilateral Sino-US tariff war of 2018.
At least as far as the amount of trade affected is concerned, the findings in figure 1-2 call into question claims that US tariff hikes in 2018 and Chinese retaliation were a defining moment in the development of the world trading system.11 In every year before the Sino-US trade war the amount of trade affected by import distortions and by export incentives was far greater. The prominence of an act of trade discrimination can be a misleading indicator of its global significance.
In sum, well before the Trump administration came into office governments around the world were engaging in trade discrimination. By 2016 over two-thirds of world goods trade was affected by trade discrimination that was in effect that year. Given that the GTA reporting started in November 2008, and allowing for the possibility that some discrimination may not have been documented, then the actual share of world goods trade affected is larger. Moreover, as shown in figure 4 of Evenett (2019), larger and larger proportions of world goods trade faced multiple policy-induced trade distortions. This is the consequence of the more than 11,000 instances of trade discrimination implemented worldwide between November 2008 and December 2016.
The absence of comparable information on the resort to trade discrimination before November 2008 might lead some to argue that it is unclear that the global financial crisis induced countries to increase trade discrimination. If this business-as-usual argument is correct, then it implies that there was sustained trade discrimination implicating significant scales of global commerce before the global financial crisis—in which case, it would be hard to argue that world trade rules reined in trade discrimination in that era as well.
Of course, it would be preferable to nail down the argument with data on commercial policy choice from before November 2008. Even without such data, logic dictates that one cannot simultaneously argue that the WTO was effective in deterring protectionism before the global financial crisis and that there was no fundamental change in trade discrimination after the crisis began.
The foregoing discussion makes clear that G-20 governments pursued an activist trade policy in the post-2008 period, continuing to do so well after the crisis had passed. One can legitimately ask how much the many measures distorted global trade flows, and what the net effect of trade activism has been on the volume of global trade.12 Global trade bounced back relatively rapidly in the immediate postcrisis period, but stagnated thereafter, essentially growing at the pace of GDP. Many of the measures have the effect of stimulating national exports; others reduce the incentive to import. It is important to understand that there are good reasons why the policy response included less in the way of traditional trade-restricting instruments such as antidumping and safeguard actions, as these are less effective than government support in a world where firms increasingly are part of global value chains (see, for example, Gawande, Hoekman, and Cui 2015).
EXPLORATORY ANALYSIS OF THE DRIVERS OF NATIONAL RESORT TO TRADE DISCRIMINATION
This section examines whether certain factors account for the cross-national variation in the relative treatment of domestic and foreign commercial interests. I pay particular attention to the share of a nation’s entries in the GTA database whose implementation harmed foreign commercial interests, and often draw a distinction between policy measures implemented during the initial crisis response (November 2008 to December 2010) and afterward (but before the Trump administration took office—therefore, from January 2011 to December 2016). I do, however, occasionally present data for the entire period November 2008 to December 2016.
Moreover, this section often distinguishes between resort to traditional, more transparent policy instruments and resort to subsidies. The former are taken to include import tariff increases, trade defense measures, and safeguards (MAST chapter D), nonautomatic licensing procedures (MAST chapter E1), import quotas (MAST chapter E2), export restraints including voluntary export restraints (MAST chapter E5), tariff rate quotas (MAST chapter E6), and quantity controls not otherwise specified (MAST chapter E9). For the purposes of the analysis here, subsidies are taken to include subsidies to firms competing in home markets (MAST chapter L), export subsidies (MAST chapter P7), and export credits (MAST chapter P8). Recall that there are other forms of trade discrimination that fall outside these two groups; therefore observing, for example, an increased share of measures that are transparent does not automatically imply that the share of subsidies implemented by the same jurisdiction must be lower.
Recalling also the earlier discussion concerning the factors that may influence the behavior of G-20 governments, I often draw a distinction here between the variation in policy stance between G-20 members and other governments. Indeed, this provides a good starting point for the discussion in this section. First indicators of the resort to trade discrimination by the G-20 are contrasted with those of the next twenty largest trading nations (identified using precrisis trade data for 2007). In figure 1-3 the proportion of harmful measures implemented by the G-20 and the “next 20” is shown for all years and broken down into the initial crisis years and subsequent years.
In comparison with the next twenty largest trading nations, on average the policy mix of the G-20 nations was skewed more toward discrimination than liberalization and more toward the resort to subsidies, both for import-competing firms and for exporters. Resort to traditional instruments of trade discrimination was similar. Breaking out the policy responses between the initial crisis response and subsequent years is revealing. At the start of the crisis the G-20 nations tended to choose more traditional forms of discrimination and subsidies than the next twenty largest trading nations. After that, from 2011 to 2016, the G-20 resorted proportionally more to subsidies and less to transparent trade discrimination, such as tariff increases. Overall, the G-20 policy stance shifted away from more transparent trade discrimination as the crisis era lengthened.
I turn our attention now to other stylized facts concerning the crisis-era commercial policy response of the G-20 members in comparison with that of other nations. In what follows, rather than compute averages across the G-20 members, I treat each G-20 member as a separate observation, as well as all of the other customs territories (referred to collectively as non-G-20), not just the twenty next largest traders.
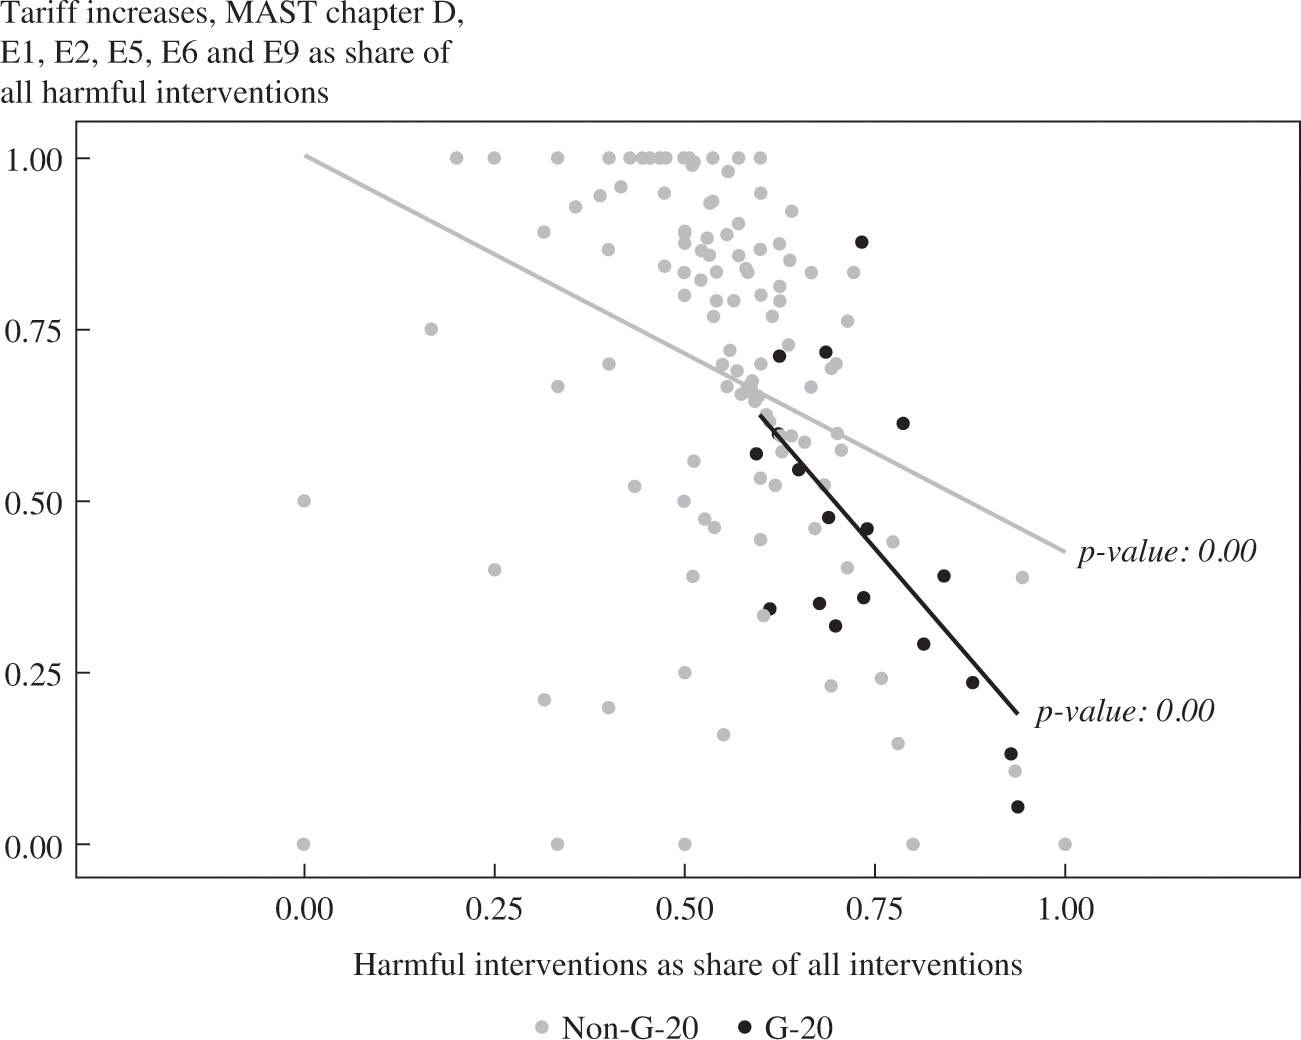
The first hypothesis considered is that governments that resort more to harmful measures also resort to more traditional forms of trade discrimination. For both the G-20 and non-G-20 countries during the entire period November 2008 to December 2016 (and for both subperiods) there is a strong negative and statistically significant relationship between resort to harmful measures and resort to transparent forms of trade discrimination, such as import tariffs (see figure 1-4). The negative relationship is stronger for the G-20 countries than for the non-G-20 countries. This finding is consistent with the claim that governments under more pressure to favor domestic commercial interests choose less transparent measures for doing so.
The second hypothesis is that governments that choose harmful measures also impose more subsidies. This hypothesis is not rejected by the data for the G-20 members and the non-G-20 members for the entire period and for the two subperiods. A positive correlation is found for the G-20 and non-G-20 countries in figure 1-5, suggesting that governments under more pressure to favor local firms did so through subsidies of different types.13 That this is a global phenomenon is significant in light of the criticism that singles out China’s system of subsidization.
The third hypothesis examined is that greater resort to trade discrimination correlates with a higher proportion of imports being affected by such discrimination. Figure 1-6 reveals no such correlation in the data for either the G-20 nations or the non-G-20 nations for the entire period (November 2008–December 2016). However, for the initial crisis phase a positive correlation was found for the non-G-20 nations, which might be related to the earlier finding that for these countries the resort to traditional forms of trade discrimination falls off slowly as the propensity to choose trade discrimination increases. Whatever the reason, figure 1-6 shows a clear difference in behavior between the G-20 and non-G-20 nations, at least as far as the initial crisis response is concerned.
FIGURE 1-4. Governments that resorted more to trade discrimination resorted less to transparent trade restrictions, November 2008– December 2016.
Source: Global Trade Alert database.
Note: For each plot in figure 1-4 an ordinary-least-squares regression was performed on the relationship between the variables on the two axes for the G-20 sample and separately for the non-G-20 sample. The fitted lines are reproduced in each figure, as are the p values for the estimated coefficients.
The possibility that trade discrimination might substitute for exchange rate depreciation was noted at the beginning of the chapter. Here the discussion is broadened to include fiscal policy stimulus, not least because many governments responded initially to the global financial crisis by increasing public expenditure on goods and services in a Keynesian manner. Later, of course, many governments embraced austerity programs, with the opposite implications for government spending (or at least for the growth of government spending).
FIGURE 1-5. Governments were more likely to use subsidies when they resorted to trade discrimination, November 2008–December 2016.
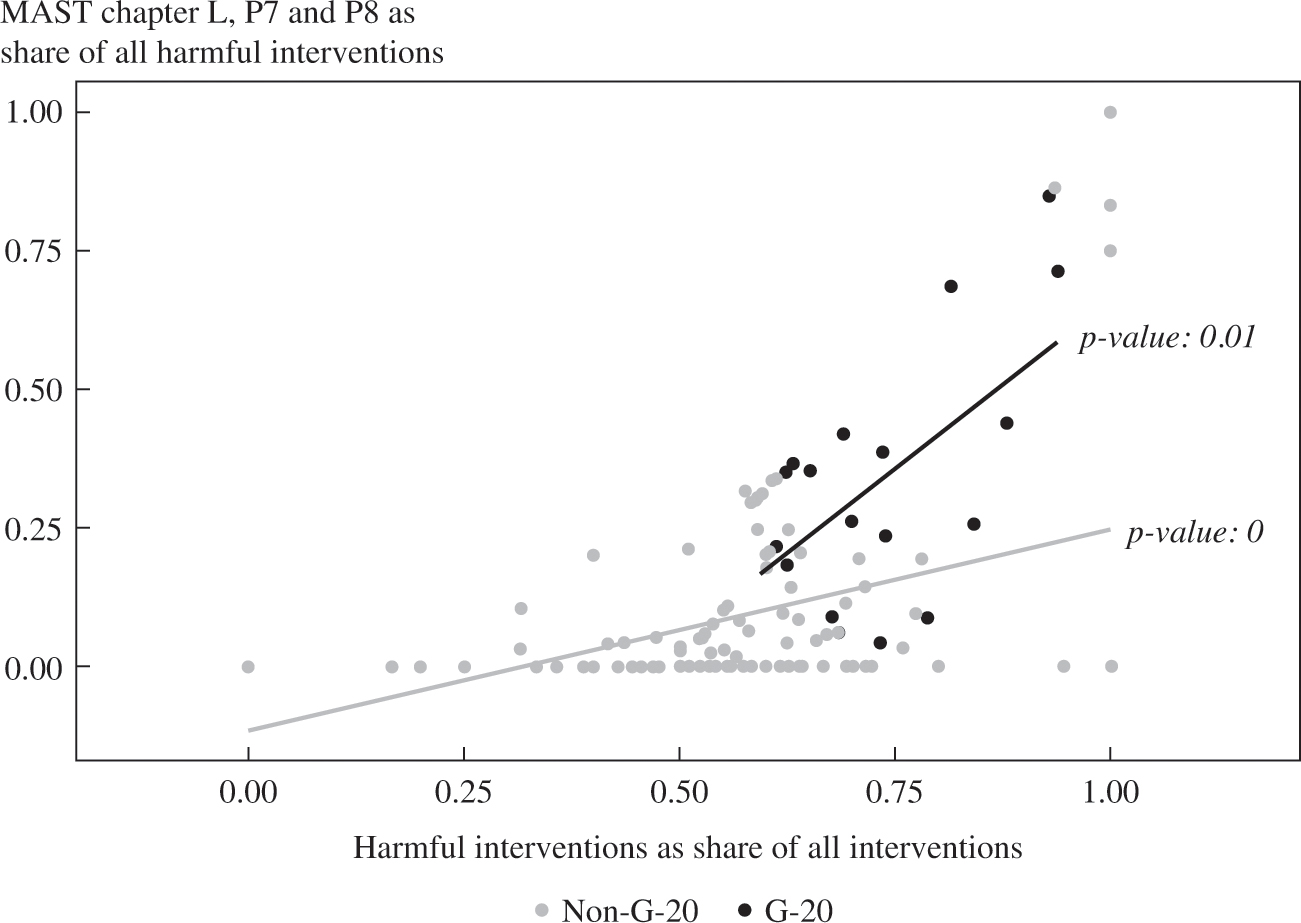
Source: Global Trade Alert database.
Figure 1-7 plots the resort to trade discrimination (as measured by the share of measures implemented that were harmful to foreign commercial interests) against the logarithm of the ratio of government spending on final consumption goods between the respective end year and start year. For both the G-20 and non-G-20 there is a negative relationship between these two variables in the initial crisis response years, November 2008–December 2010, suggesting that fiscal stimulus acted as a substitute for tilting the commercial playing field in favor of national firms. However, the negative relationship is statistically significant only for the non-G20 nations. Moreover, the relationship breaks down for the later years (2011–2016). In sum, as far as fiscal policy is concerned, the substitutability hypothesis cannot be entirely rejected or entirely endorsed.
FIGURE 1-6. Only in the initial crisis response did greater resort to trade distortions result in a higher share of imports being affected, and then only for non-G-20 nations.

FIGURE 1-7. Non-G-20 governments that expanded government spending were less likely to resort to trade discrimination, but the relationship broke down after the initial crisis response.

Source: Global Trade Alert database.
As far as the potential substitutability between exchange rate depreciation and resort to trade discrimination is concerned, if anything, these two policy interventions were complements for the non-G-20 nations during their initial crisis responses (see figure 1-8). Interestingly, no such relationship carries over to the period 2011–2016. Among the G-20 nations there is no strong relationship between these two policy choices during the initial crisis response (November 2008–December 2011) or subsequently (2011–2016). Once again, G-20 behavior appears to diverge from non- G-20 behavior.
To assess whether the initial dislocation in the labor market, as proxied by the increase in the rate of unemployment from 2007 to 2009, may have influenced the resort to trade discrimination, I plotted and analyzed the relationship between these variables (see figure 1-9). The “embedded liberalism” hypothesis of Ruggie suggests that accepted international norms, such as nondiscrimination toward trading partners, may be suspended if a crisis threatens social stability. The initial labor market impact of the global financial crisis differed from country to country, and so it is of interest to see if any clear relationship appears in the data.
The upper panel of figure 1-9 shows that, for the G-20 members, resort to trade discrimination was greater by governments whose economies experienced higher initial increases in unemployment. However, this positive relationship is not statistically significant. Interestingly, for the initial crisis years there is a mild negative relationship between the initial unemployment increase and trade discrimination for the non-G-20 countries, which is at odds with Ruggie’s thesis. As the bottom panel of figure 1-9 shows, there is no apparent relationship between the initial increase in unemployment and the propensity to engage in trade discrimination from 2011 to 2016, suggesting that whatever initial shock there was to national labor markets did not have an enduring effect on commercial policy choice.
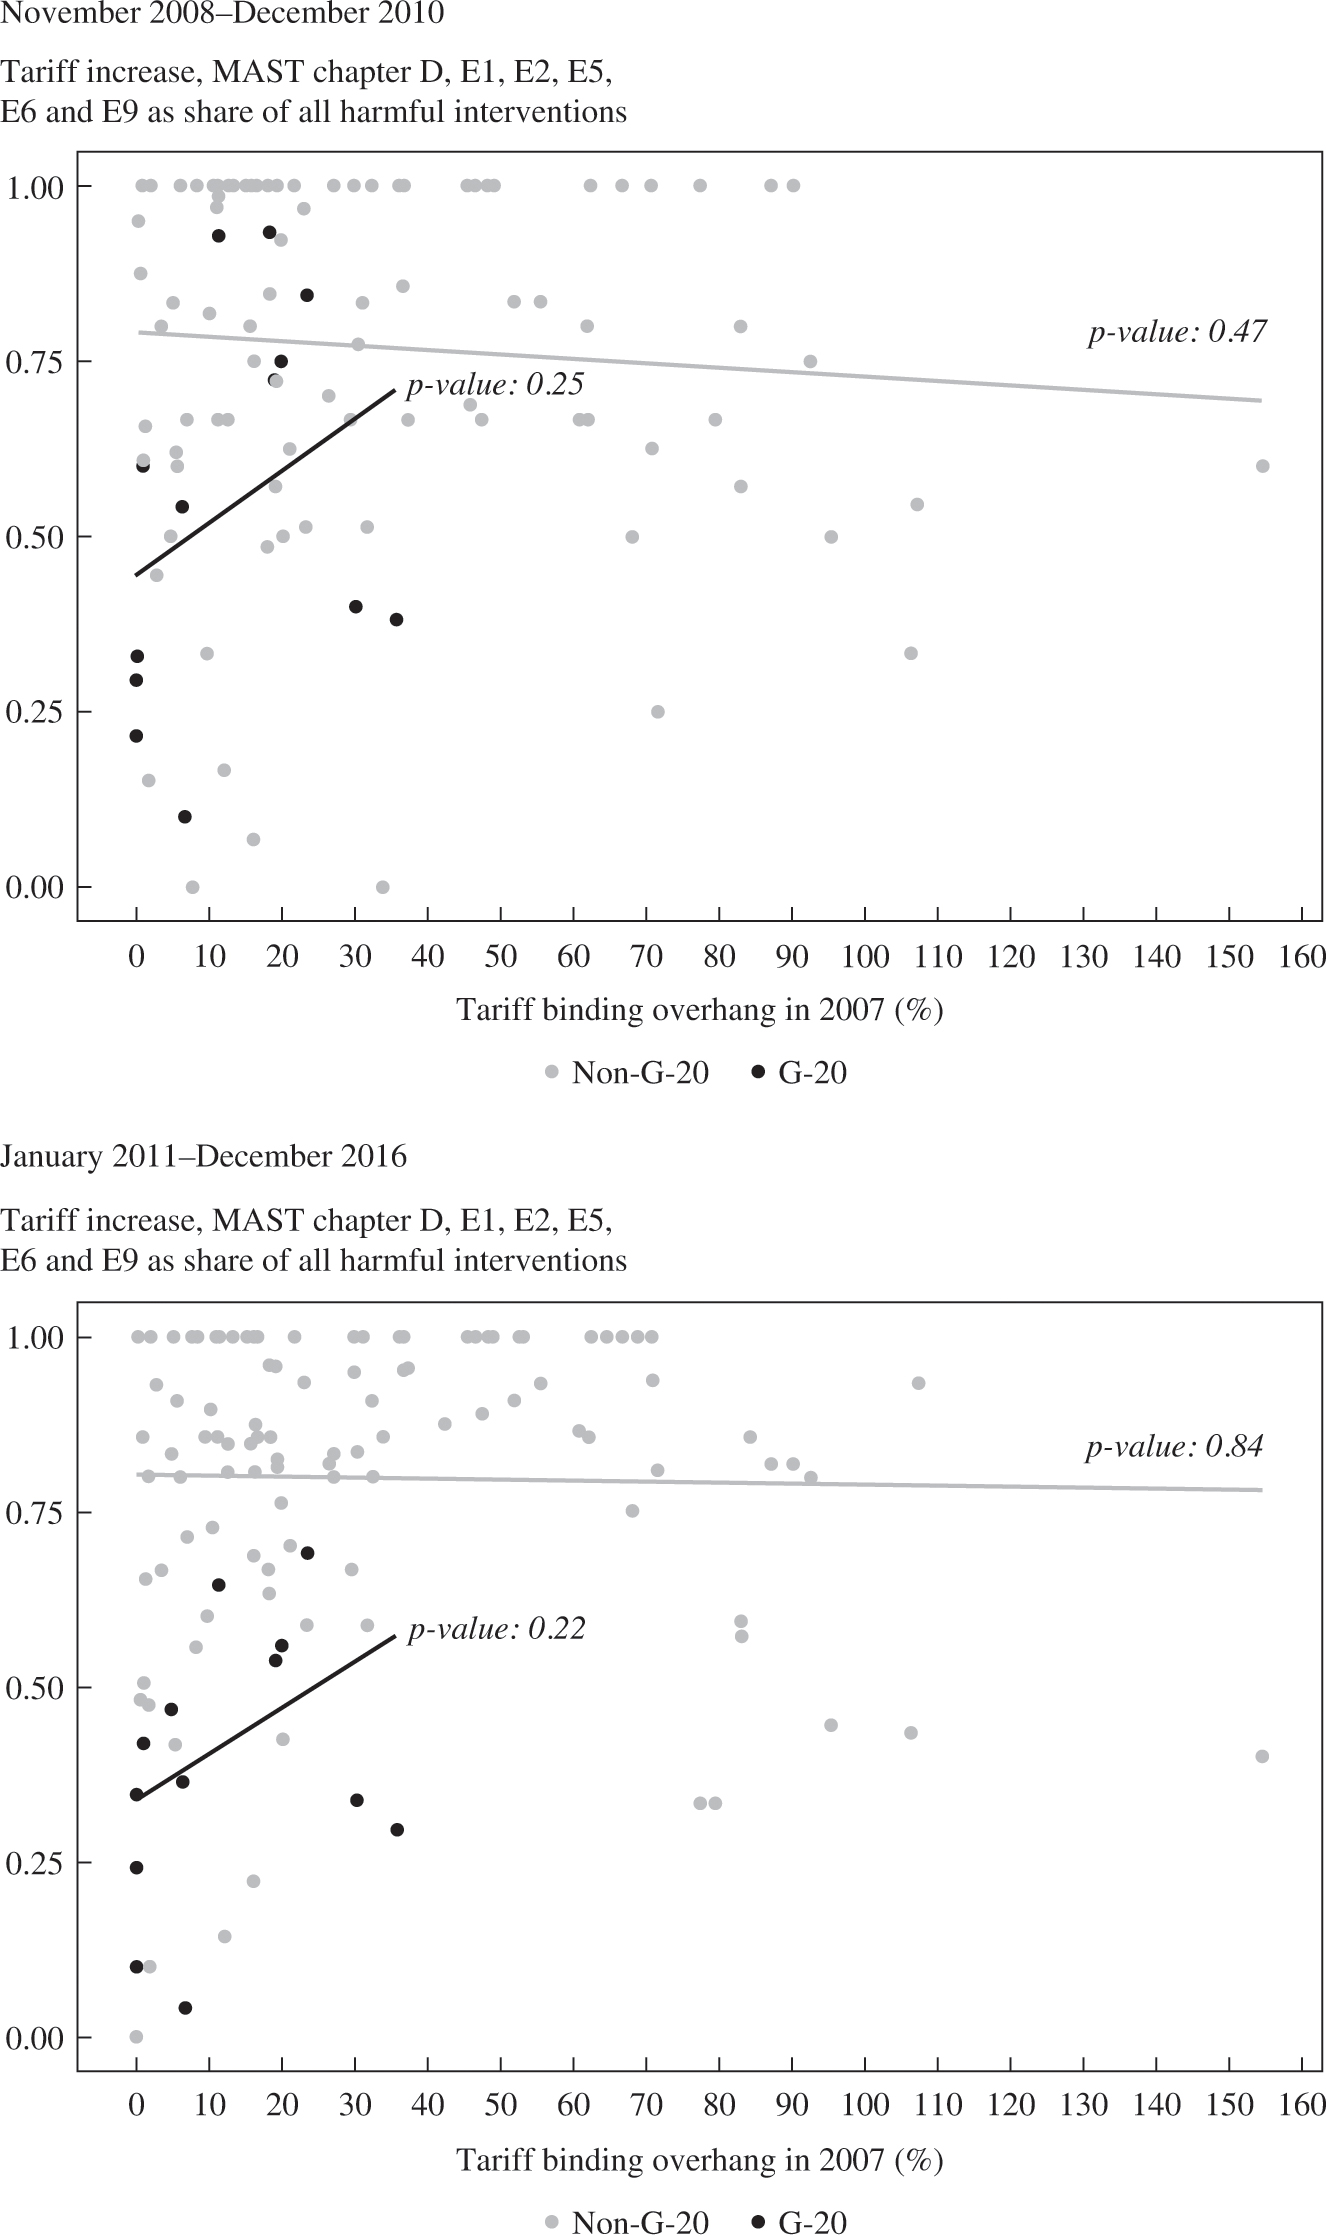
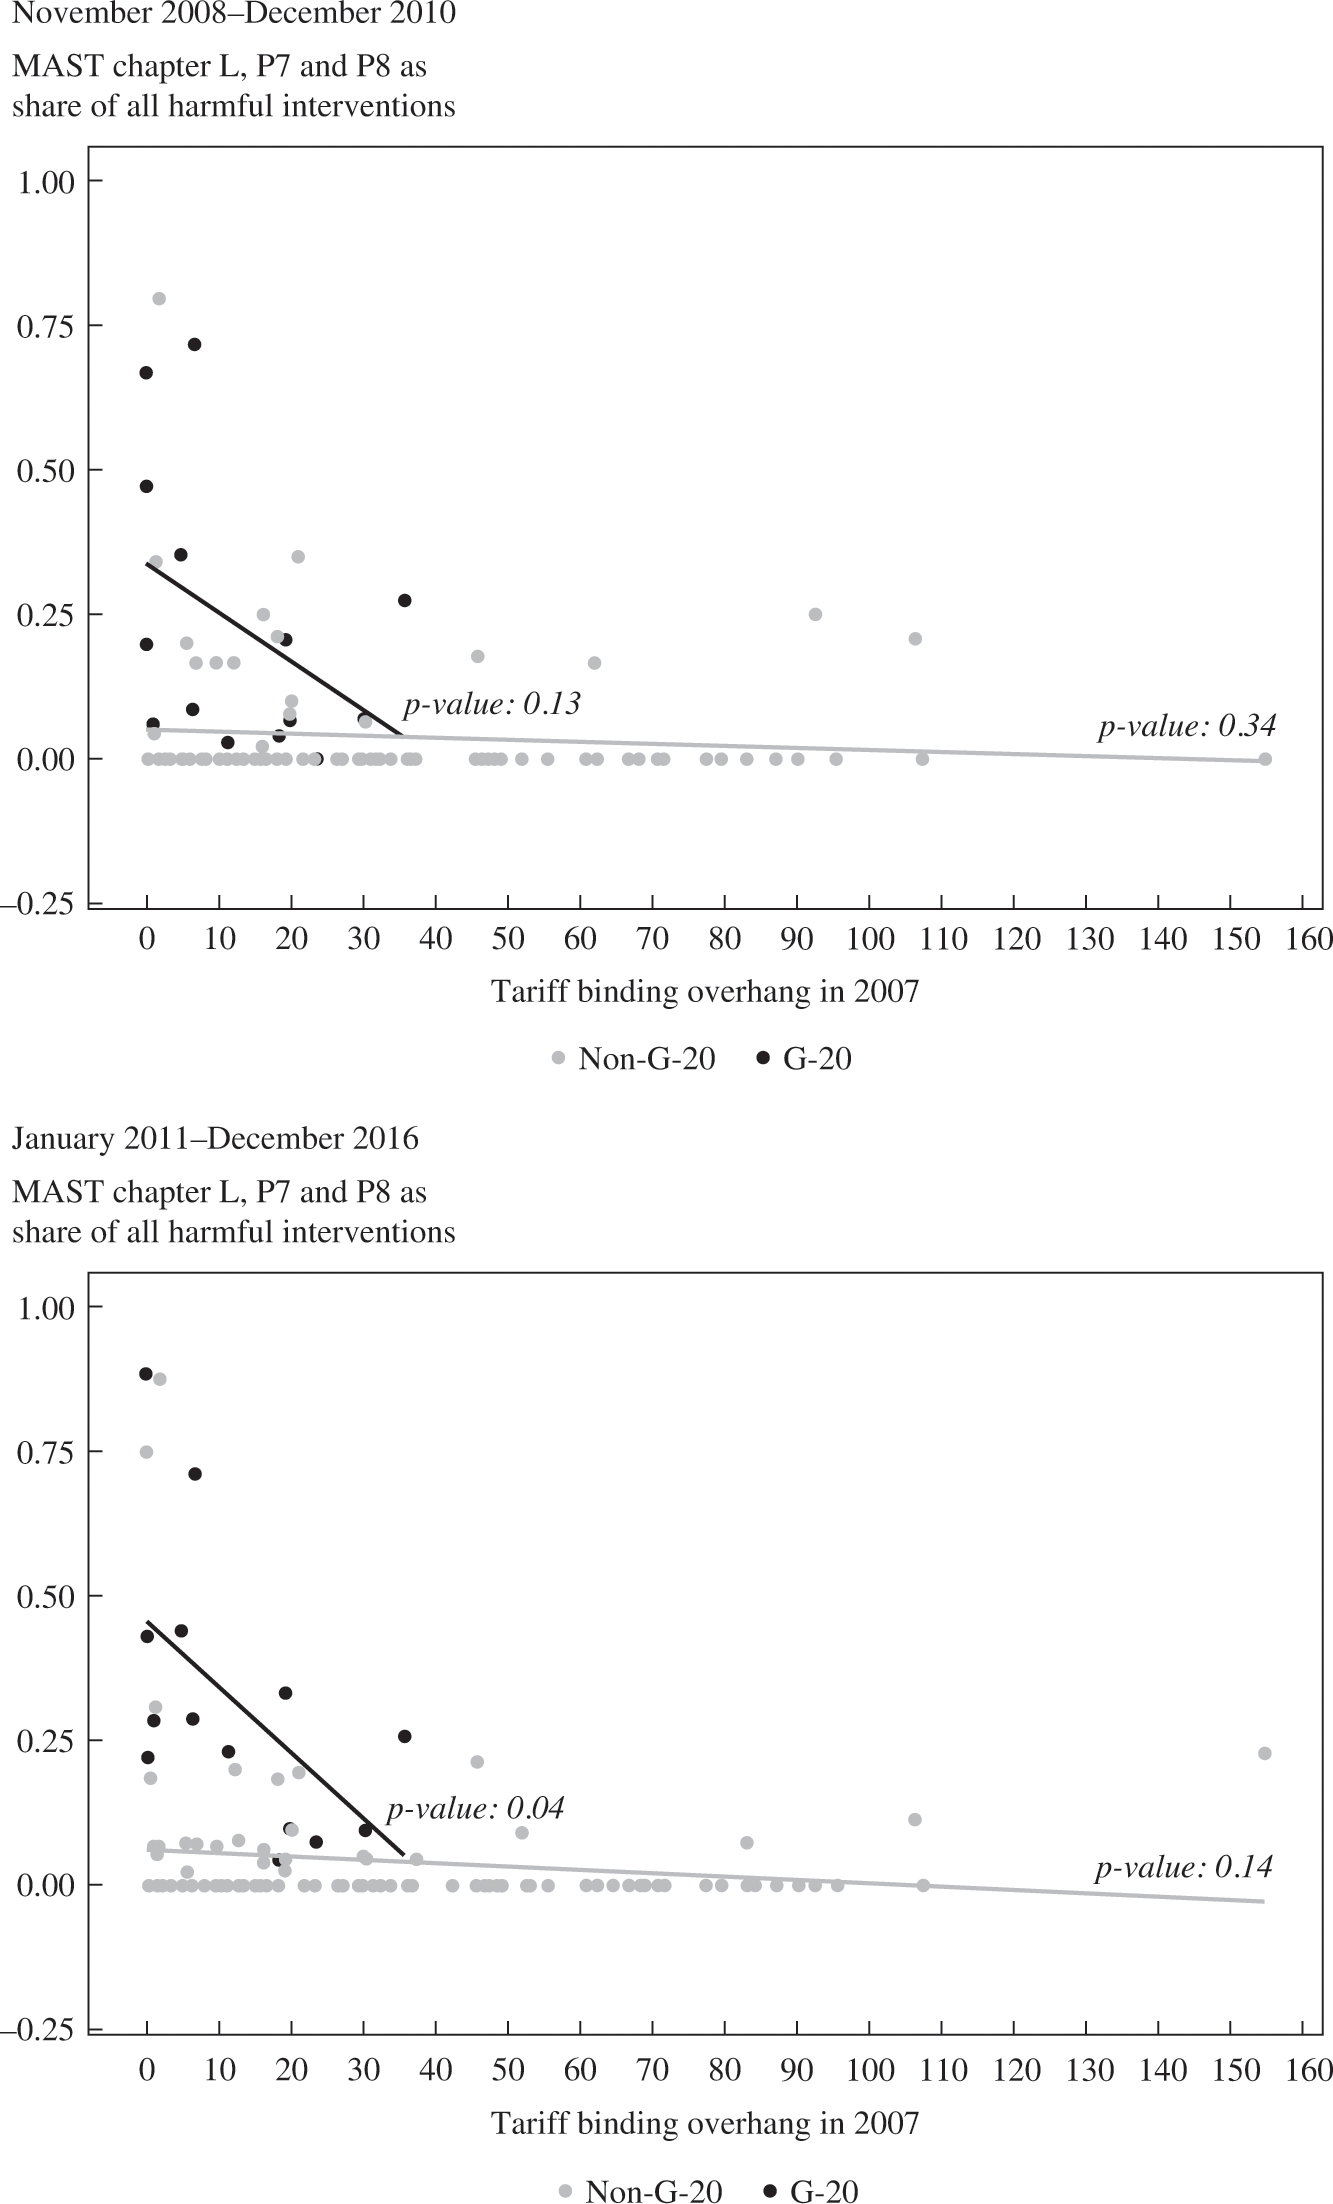
The tightness of a country’s WTO obligations is the final conditioning factor considered here. Much is made of trade rules and their apparent power. Given the substantial differences in the tariff binding overhangs among WTO members before the global financial crisis hit, to what extent did governments with less room for maneuver choose different commercial policy mixes than others? Figure 1-10 plots the propensity to resort to discrimination against the tariff binding overhang in 2007 for the initial crisis years (November 2008–December 2010) and subsequently (January 2011–December 2016).
FIGURE 1-8. For non-G-20 governments, resort to trade discrimination appears to complement exchange rate depreciation, but only in the initial crisis response.
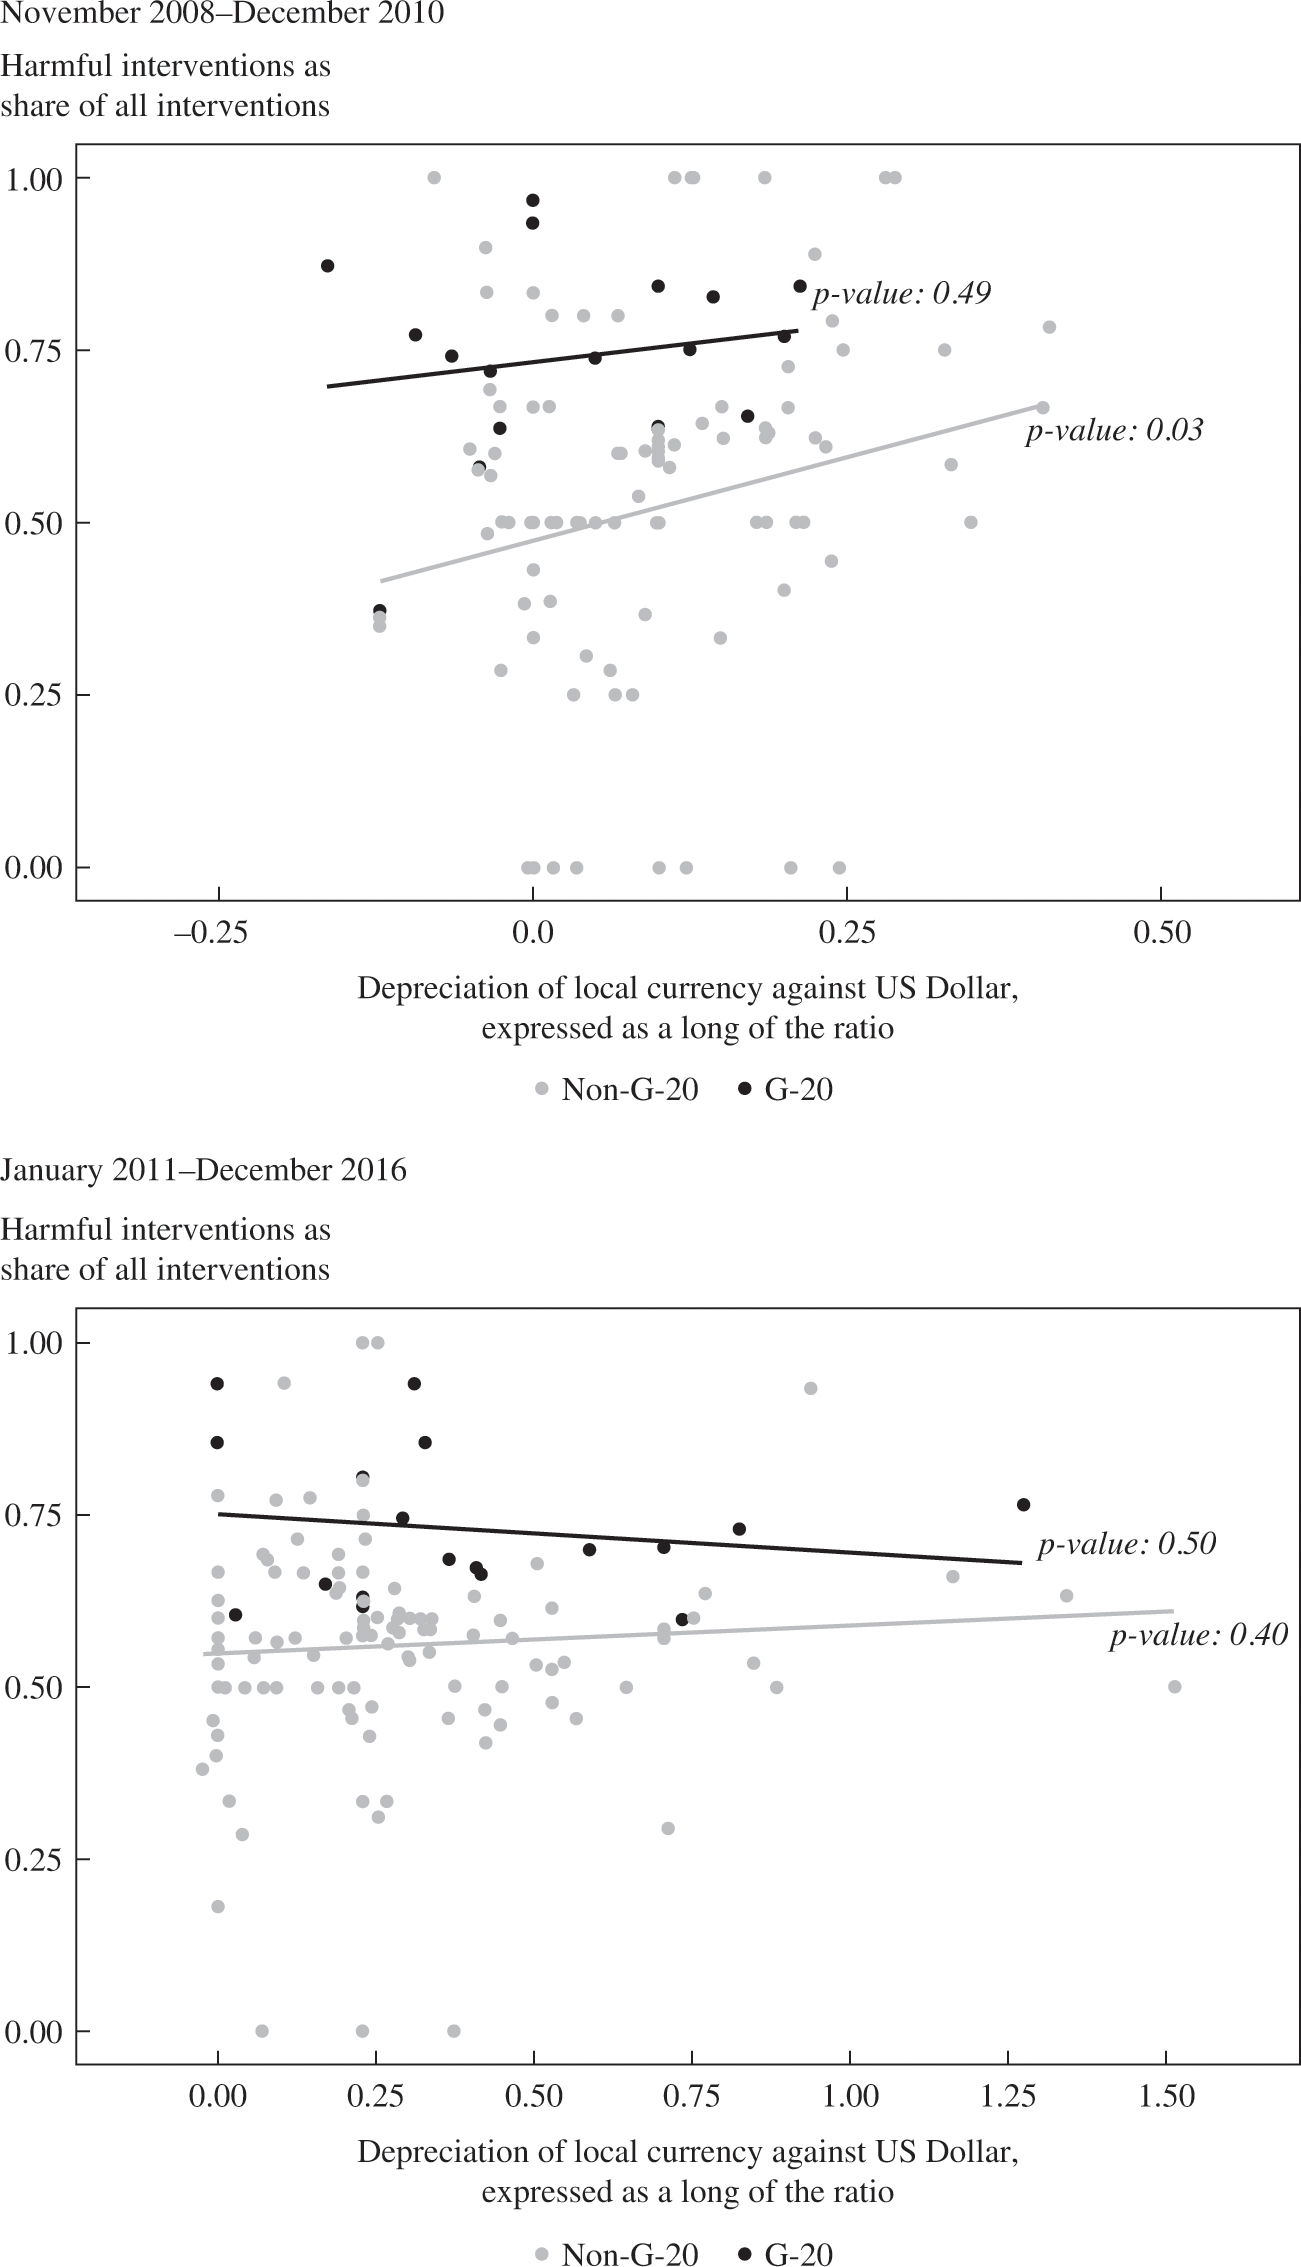
Source: Global Trade Alert database
FIGURE 1-9. Initial increases in unemployment may have affected resort to trade discrimination only in the early years of the crisis.
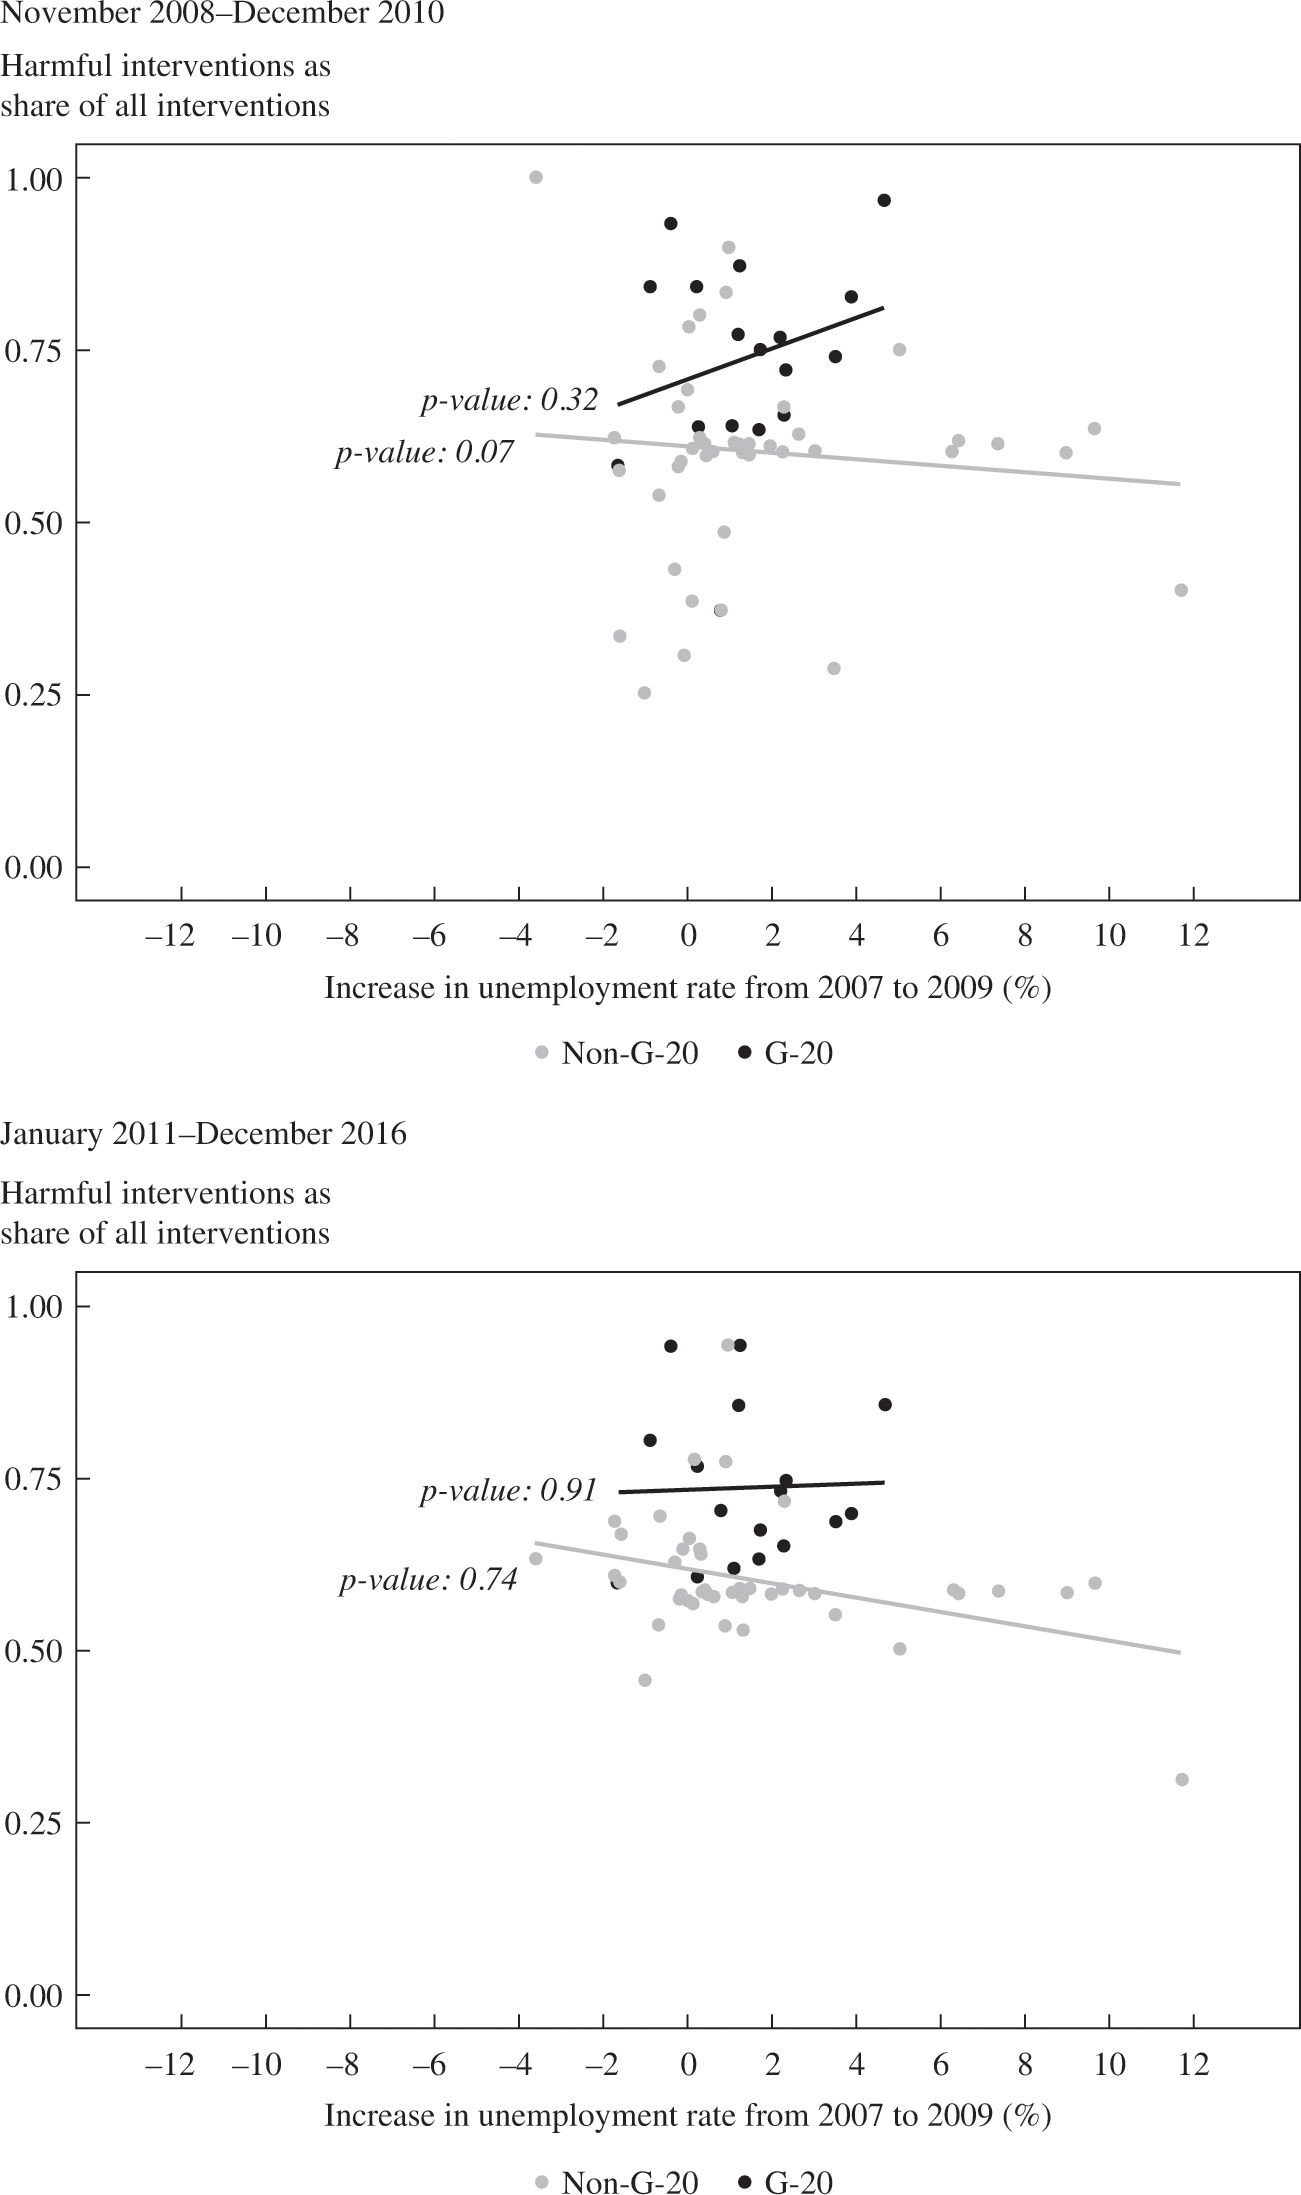
Source: Global Trade Alert database
FIGURE 1-10. G-20 members with smaller tariff binding overhangs tended to resort more to trade discrimination, but only after the initial crisis period was over.

Source: Global Trade Alert database.
Reviewing both panels of Figure 1-10 for non-G-20 countries there is no evident relationship between their commercial policy responses and the tightness of their tariff bindings in either period. This may be because other factors matter or because there are better indicators of the strength of a nation’s WTO disciplines. In contrast, for the G-20 members a negative relationship is found in both periods, implying that the smaller the tariff binding overhang the larger the resort to trade discrimination. However, it should be noted that that relationship is only statistically significant (and only at the 10 percent level) once the initial crisis era passed—that is, for the six years 2011–2016. It would appear that tighter tariff disciplines on G-20 members are associated with, if anything, a mix of more harmful policies toward foreign commercial interests.
Similar correlations were performed for the resort to transparent forms of trade discrimination (see figure 1-11). In both periods there is no apparent relationship between resort to transparent forms of trade discrimination and strictness of tariff bindings for the large group of non-G-20 countries. However, for the G-20 countries there is a statistically insignificant positive relationship, suggesting a weak tendency for G-20 members that have greater leeway to legally raise tariffs to resort to more transparent forms of trade discrimination (of which, tariff increases are one option.)
When it comes to subsidization, however, there is a stronger relationship between the tightness of tariff bindings and the propensity to intervene in this manner to harm foreign commercial interests (see figure 1-12). Although the statistical significance of the relationship is stronger for the years 2011–2016, in both periods those G-20 members that had less room to increase their import tariffs were more likely to subsidize local firms and exporters. Whatever one’s assessment of the effect of WTO disciplines on the quantum of G-20 trade discrimination, this finding suggests that the latitude allowed governments in their precrisis tariff obligations at the WTO affected the form in which they discriminated against foreign commercial interests. Taking the findings of figures 1-11 and 1-12 together, G-20 governments appear to have substituted transparent trade restrictions for subsidies.
FIGURE 1-11. A weak positive correlation exists for the G-20 members between the size of tariff binding overhang and resort to more transparent trade discrimination.
Source: Global Trade Alert database.
FIGURE 1-12. G-20 members with smaller tariff binding overhangs resorted more to subsidies, in particular after the initial crisis period was over.
Source: Global Trade Alert database.
Overall, this exploratory data analysis reveals differences between G-20 and non-G-20 members in the use of trade discrimination and in the form of that discrimination. Monetary and fiscal policy choices appear to have influenced the commercial policy decisions of the non-G-20 members more than the G-20 members, whereas the tightness of precrisis tariff bindings appears to have had more influence on the propensity and form of trade discrimination of the G-20 members than on the non-G-20 members.
CONCLUDING REMARKS
Given the attention that the Sino-US trade war has received, it is no wonder that analysts began examining the causes and consequences of this high-profile disruption to what many regarded as a well-functioning global trading system. Making use of a detailed dataset of public policy interventions collected over the past decade, the evidence presented here shows that the world trade in goods was thoroughly distorted, principally by trade-distorting subsidies, well before the election of Donald Trump seemed at all likely.
Since economic policy analyses require carefully specified initial conditions against which to judge a policy shock, such as imposing tariffs on several hundred billion dollars of Chinese imports, then taking account of how distorted trade was when the Trump administration took office could have material implications for the estimates of that shock. Put differently, modeling the impact of the Sino-US tariff war on the assumption that world goods markets are trading freely, or moderately freely, may be highly misleading.
Another important finding is that steps to stimulate national exports cover much more of world goods trade than steps to restrict imports. The trade policy response to the Great Depression of the 1930s involved significant resort to import restrictions and competitive devaluations. The trade policy response to the 2008 global financial crisis was dominated by measures to promote exports. Like generals, who are often accused of trying to refight the last war, many trade policy analysts appear to have looked for the 1930s policy response and, having found none, prematurely declared victory for the world trading system. There is no doubt that the economics and political economy of export incentives and import restrictions are different, but they are both trade distortions.
That nearly three-quarters of world trade currently faces one or more trade distortions imposed since the crisis began calls into question the effectiveness of current international trade rules.14 Some may be tempted to argue that matters would have been worse in the absence of those trade rules. Surely the riposte is that if distortions to three-quarters of world trade constitute victory, then what constitutes defeat? Still, as the exploratory data analysis revealed, international trade rules may well have affected the form—if not necessarily the quantum—of trade discrimination implemented by the G-20 members.
One of the more interesting findings in the exploratory analysis is related to the differences in the factors that correlate with the commercial policy choices of the G-20 and non-G-20 countries. These differences are worth exploring further. Was G-20 policy choice different because these economies were larger, in absolute or relative terms? Or was there something about the dialogue among the G-20 members that altered their resort to trade discrimination? If so, what mechanism was at work and how did it add value to the dialogue under WTO auspices?
In sum, the travails of the world trading system predate the Trump administration. Stating that does not deny or diminish the harm being done to international trade and investment flows by the implementation of America First commercial policies. Those policies should be condemned on a number of grounds—economic, political, and geostrategic. The risk is that by concentrating attention on the high-profile tariff developments of the two years 2017–2019, other commercially significant forms of trade discrimination will be overlooked by analysts and policymakers. The consequences are likely to be poorly framed analysis and inadequate policy prescription.
NOTES
Thanks to Patrick Buess and Piotr Lukaszuk for their support in preparing the figures for this chapter. Any errors are mine. Comments are welcome and should be sent to simon.evenett@unisg.ch. The project to which this chapter contributes received funding from the European Union’s Horizon 2020 research and innovation program under grant agreement no. 770680.
1. For a longer account of the methods used by the GTA team to document public policy see section four of Evenett (2019).
2. The pitfalls associated with confining data collection to a predefined set of trade policies are described in section three of Evenett (2019). The deeper question here is, given the many forms of cross-border commerce in existence in the twenty-first century, what definition of protectionism is fit for purpose? The GTA does not include information on technical barriers to trade, sanitary, and phytosanitary standards, and regional trade agreements, each of which some analysts contend can be a source of discrimination against foreign commercial interests. There exist other databases that document developments in each of the latter three areas of policy. Note also that the relative treatment test is not a test of WTO legality.
3. Statistics on global totals for policy interventions harming and benefiting foreign commercial interests can be obtained from Global Trade Alert, https://www.globaltradealert.org/global_dynamics.
4. For a list of sixteen MAST chapters of nontariff measures as well as other information about this UN initiative, see United Nations Conference on Trade and Development (UNCTAD), “International Classification of Non-Tariff Measures,” https://unctad.org/en/PublicationsLibrary/ditctab20122_en.pdf?user=46.
5. Products are classified using the six-digit level of disaggregation of the UN Harmonised System. This is the most disaggregated product classification for which international trade data is available worldwide. Services are assigned the relevant three-digit level of disaggregation of the UN Central Product Classification (CPC).
6. The GTA team has experimented with other ways to address the endogenity problem. For more information, kindly write to the author.
7. The data are available at Global Trade Alert, https://www.globaltradealert.org/data_extraction.
8. The estimates for 2019 relate to the trade discrimination in effect in June 2019. Technically, import tariff increases do not have a place in the MAST classification, but since they are a form of trade discrimination they are included in the calculation for “all” trade distortions.
9. There are other forms of trade discrimination, such as government procurement measures to buy local products, that do not fit into these three categories. The purpose here is to show how much goods trade is affected by each of these three significant types of trade discrimination. Note also that any trade flow could be affected by more than one type of trade discrimination, so there is no reason to expect the sum of the trade affected in any year across these three classes of policy to equal or be less than the total for the “all” category.
10. For more details, see Legge, Lukaszuk, and Evenett (2018).
11. There may well be other grounds for arguing that the Sino-US trade war was a defining moment. Evenett and Fritz (2018) argue that the brazen nature of the US actions against China contrasts sharply with the creeping, hidden, or murky protectionism witnessed globally in prior years.
12. It is important, of course, to assess not just the number and types of measures used by governments but also how big the distorting effect has been on global trade. This is an important research question that is beyond the scope of this chapter. It requires disentangling export-promoting from import-restricting policies and considering the associated changes in investment incentives for firms, which will be influenced by other factors, including technological changes and perceptions of policy uncertainty.
13. The correlation remains positive and the p values low if the observations where no subsidies were observed are dropped.
14. Even in the absence of export incentives, as of this writing some 40.9 percent of world goods trade faces other forms of trade discrimination. Containing protectionism to “just” two-fifths of global goods trade hardly seems a success either.
REFERENCES
- Baldwin, R. E. 1970. Nontariff Distortions of International Trade. Washington, D.C.: Brookings.
- Bagwell, K., C. Bown, and R. Staiger. 2016. “Is the WTO Passé?” Journal of Economic Literature 54 (4): 1125–31.
- Bhagwati, J. 1988. Protectionism. MIT Press.
- Bown, C. 2011. “Introduction.” In The Great Recession and Import Protection: The Role of Temporary Trade Barriers, edited by Chad P. Bown, 1–51. London: CEPR and the World Bank, 2011.
- Eichengreen, B., and D. Irwin. 2010. “The Slide to Protectionism in the Great Depression: Who Succumbed and Why?” Journal of Economic History 70 (4): 871–97.
- Evenett, S. J. 2019. “Protectionism, State Discrimination, and International Business since the Onset of the Global Financial Crisis,” Journal of International Business Policy 2 (1): 9–36.
- Evenett, S. J., and J. Fritz. 2018. Brazen Unilateralism: The US-China Tariff War in Perspective. The 23rd GTA Report. London: CEPR Press.
- Gawande, K., B. Hoekman, and Y. Cui. 2015. “Global Supply Chains and Trade Policy Responses to the 2008 Financial Crisis.” World Bank Economic Review 29 (1): 102–28.
- International Monetary Fund (IMF). 2016. Subdued Demand: Symptoms and Remedies. World Economic Outlook. Washington D.C. October. https://www.imf.org/en/Publications/WEO/Issues/2016/12/31/Subdued-Demand-Symptoms-and-Remedies.
- Kee, H. L., C. Neagu, and A. Nicita. 2013. “Is Protectionism on the Rise? Assessing National Trade Policies during the Crisis of 2008.” Review of Economics and Statistics 95 (1): 342–46.
- Krugman, P. 2018. “A Trade War Primer.” New York Times, June 3.
- Legge, Stefan, Piotr Lukaszuk, and Simon Evenett. 2018. “Raising Tariffs on China without Grabbing Headlines.” Vox, April 17. https://voxeu.org/article/raising-tariffs-china-without-grabbing-headlines.
- Rau, M-L., and A. Vogt. 2019. “Data Concepts and Sources of Non-tariff Measures (NTMs)—an Exploratory Analysis.” In Behind-the-Border Policies: Assessing and Addressing Non-Tariff Measures, edited by J. Francois and B. Hoekman. Cambridge University Press.
- Rose, A. 2013. “The March of an Economic Idea? Protectionism Isn’t Counter-cyclic (Anymore).” Economic Policy 28: 569–612.
- Ruggie, J. 1992. “International Regimes, Transactions, and Change: Embedded Liberalism in the Postwar Economic Order.” International Organization 36 (2): 379–415.