10
DISENTANGLING DATA FLOWS
INSIDE AND OUTSIDE THE MULTINATIONAL COMPANY
ERIK VAN DER MAREL
In today’s world, the flows of data between countries are a force of globalization in addition to the flows of goods, services, people, and finance. Although the notion of data flows is relatively new, many companies use some kind of data in their production process that adds value to their activities in the so-called digital economy. Economic activities in the digital economy span a wide range of goods and services production, from digital products to online services and e-commerce to pure cross-border data flows and traditional telecom services and software. The common feature of all these activities is that value is embodied in data used in companies’ production processes, either as inputs or as outputs. Indeed, cross-border data flows have become an essential component of globalization, enabling firms to become more productive (Manyika and others 2016).
Where exactly are data used and produced inside an economy? Where are these data flowing between countries? And who has a comparative advantage in data? This chapter uses various data sets to address these and other issues related to data flows. To date not much is known about data flows, and research on the subject is still nascent. Bauer, Erixon, and Lee-Makiyama (2013), Bauer and others (2014), and Christensen and others (2013) have investigated the role of domestic regulation on data flows. Ferracane, Lee-Makiyama, and van der Marel (2018); Ferracane and van der Marel (2019), and Ferracane, Kren, and van der Marel (2019) find that requirements to localize personal data have a significant impact on firm-level productivity and on services trade. These studies find that although regulatory barriers regarding the localization of data are burdensome, this is not necessarily the case for rules regarding the handling of domestic data. Other studies focus on so-called data-enabled trade in services (Meltzer 2014) and the specific links between data and e-commerce (Martens 2013).
The existing research does not analyze where data are produced and employed and how companies are likely to use data internally as part of their multinational activities. This chapter investigates the role of data produced and used by goods and services industries, and where these goods and services are traded across countries around the world. Detailed input-output information is used to trace at a disaggregated level how much value of data input goes into each downstream industry sector covering six-digit goods and services inside the US economy. This investigation reveals, unsurprisingly, that data are used intensively in sectors such as telecommunications and data processing services. It also reveals that data are used intensively for management purposes inside multinational companies. These findings motivate the analysis here of patterns of trade in management and other data-intensive services using the most recent available data on international trade in services.
Since gross trade values tell only one side of the story, I also undertake some preliminary calculations to guesstimate the amount of value added that is produced and exported by these management and other data-intensive services for a typical European country, in this case France. The simple computations demonstrate that although management services themselves represent only a small share of the entire value added exported in services, they nonetheless can be of equal importance to other services such as finance. Finally, I try to uncover the determinants of national comparative advantage in data-intensive management services.
The chapter is organized as follows. The next section sets out a framework describing the use (input) of data upstream and the production (output) of data downstream in the economy. Next I calculate the so-called data intensities of sectors by analyzing the extent to which data are used as an input in the production of downstream industries. The following section matches these data-intensive industries with trade data in an attempt to determine which countries are the main traders of data. Finally, because the results indicate that a large amount of data flows inside multinational companies, I conclude with a brief discussion of policy implications.
WHERE ARE DATA LOCATED?
Data are widely used in all sectors. As products and services have become increasingly digitized, so have their production processes. The way data should be viewed in the production function is still open to much debate. On the one hand, data may serve as an output embodied in a digital product or online service. On the other hand, data can also be used as an input for many sectors as part of the production, development, and delivery of an offline good or service. Even though in the case of online services the data are directly provided by companies, many other goods and services in the digital economy are nondigital, at least at first sight. But even these nondigital goods and services are highly dependent on data, which help to develop the components used in production processes. Without the data, these goods and services would have less economic value. One example is logistics and delivery input services, which could not be efficiently supplied without storage, documentation, and software data (Kommerskollegium 2015). For this reason this chapter treats data as either an input or an output within the wider economy of goods industries and service sectors, as outlined in figure 10-1.
Figure 10-1 presents schematically where data are located within the wider economy. It is a simple representation of where sectors that produce and use data for their business practices are placed. Figure 10-1 shows that data are located both upstream and downstream, affecting both input goods and services as well as final output goods and services in the digital economy. The size of the boxes indicates the importance of data in the overall economy. Data can be seen as an input in both upstream and downstream industries, and are therefore placed behind the three squares that represent the entire goods and services economy (both upstream and downstream). Once the data are embodied in a good or service, value is created. Only then do the data become a productive item in a company’s value chain and part of the digital economy.
FIGURE 10-1. Data Use in the Wider Economy
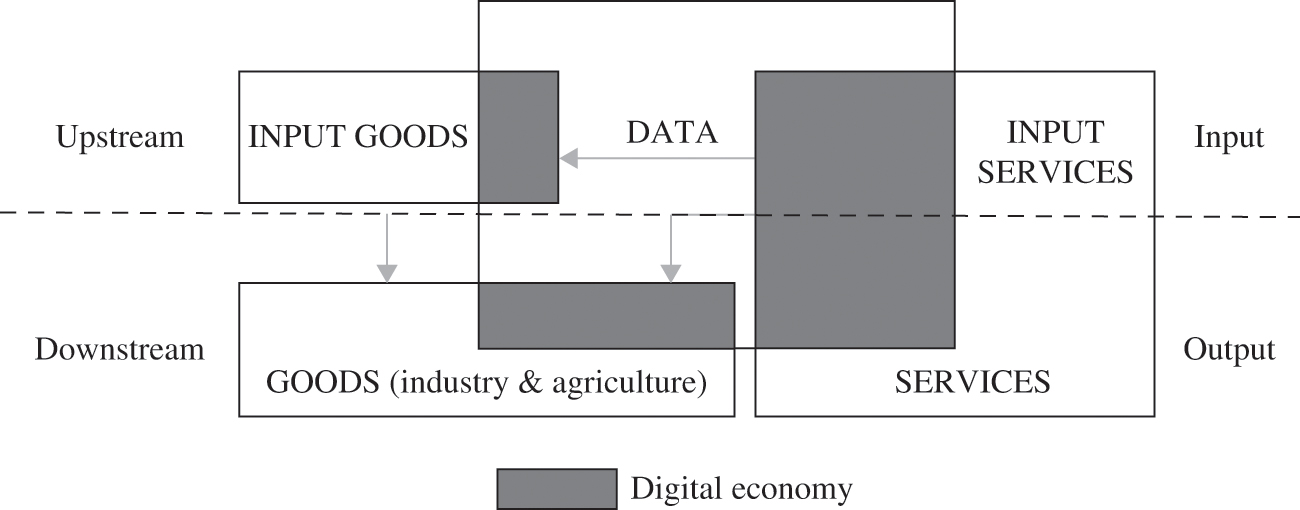
Source: Author.
As the figure shows, data can be used as an input in other input goods in the upstream part of the economy. As these intermediate input goods are processed downstream, eventually the data are embodied in final goods. Examples of this are intermediate inputs covered by the World Trade Organization’s International Technology Agreement (ITA). The ITA agreement identifies industries that produce final goods or intermediate inputs. For instance, Miroudot, Rouzet, and Spinelli (2013) show that around 56.3 percent of the electrical machinery and apparatus industry (ISIC 31) produce intermediate inputs as defined by the United Nations’ Harmonized System (HS) classification of trade. Other intermediate inputs covered by the ITA agreement include radio, television, and communication equipment and other non-metallic mineral products. The authors estimate that around 41 percent of the products covered by the ITA agreement are intermediate inputs.
Although some intermediate inputs that use data are further processed by downstream industries, data are also used directly in goods that downstream industries produce. In large part these are the final goods represented in the ITA agreement. For instance, a majority of the products produced in the machinery and equipment industry are actually final (downstream) goods. Similarly, many final goods covered by the ITA agreement can be found in the medical, precision, and optical instruments industry. Miroudot, Rouzet, and Spinelli (2013) estimate that around 60 percent of the items covered by the ITA agreement are final products.
Significant amounts of data are also used in services. Examples include data used in the telecom services sector and in the computer and information services sector. Many of these services are used as production inputs by downstream goods industries. Services that use a lot of data and are located upstream in the economy include telecoms, data processing services, financial services (including insurance), information technology (IT) consulting, data storage and system integration services, and marketing research services. These services are often used in the production processes of downstream companies, which in turn produce final goods and services. For a typical developed country, approximately 60 percent of all services sectors use intermediate services to produce final services.
In addition, upstream services can also be consumed as part of a final output service. For instance, in addition to being used as an input in the production chain, a substantial share of telecom services are also used by final consumers. These include personal services such as educational services, which also use a large amount of data in their production and delivery. Many other services sectors in the digital economy have emerged over the past decade. These include online services, web portals, search engines, internet or over-the-top (OTT) services, e-commerce, and software services. These are often consumed by users directly, but can also be used in the production processes of other downstream goods and services firms.
The common ground shared by all of the goods and services producers in figure 10-1 is their use of data to add value in the wider economy. In other words, data are a productive element in the production processes of all companies that produce goods and services.
WHO ARE THE PRODUCERS AND USERS OF DATA?
As noted, users of data include producers of goods, services, and agricultural products. Not all companies use an equal amount of data, however, and there is large variation in the use of data across sectors. This section investigates which sectors are the main producers and users of data in the wider economy. This part of the analysis relies on the Bureau of Economic Analysis (BEA) Input-Output Use data tables, which provide detailed information about different sectors’ use of input value from other sectors, including data and data services. I select a small subset of sectors whose main activity is producing and developing data as core sectors that provide data as a final output. In order to get a precise picture, I selected all of these sectors from the six-digit level, the most detailed level provided by the BEA. All of the categories are services, so they exclude goods covered under the ITA. As discussed in the next section, manufacturing and agricultural goods are mainly users, not producers, of data.
TABLE 10-1. Sectors Covering Producers in the Digital Economy
|
Six-digit codea |
Sector description |
|
|---|---|---|
|
511200 |
Software publishers |
|
|
517110 |
Wired telecommunications carriers |
|
|
517210 |
Wireless telecommunications carriers (except satellite) |
|
|
518200 |
Data processing, hosting, and related services |
|
|
519130 |
Internet publishing and broadcasting and Web search portals |
|
|
541511 |
Custom computer programming services |
|
|
541512 |
Computer systems design services |
|
|
541513 |
Other computer-related services, including facilities management |
|
|
Source: US Department of Commerce, Bureau of Economic Analysis (BEA). |
||
|
a The six-digit codes are the classification codes used in the BEA’s input-output tables. |
||
Table 10-1 shows eight key sectors that are the main producers of data in the digital economy. As such, they provide inputs (or final output) to other downstream users or final output industries. These digital sectors are software publishers, internet publishers, web search portals, and telecommunications carriers. Of course there are more sectors that develop data in the domestic economy, but in these core data sectors the majority of tasks are dedicated to developing and therefore producing data. For example, software publishers are companies engaged in the design, development, and publishing of computer software with the use of data. The primary business goal of these companies is to carry out operations necessary for the production and distribution of software. This sector includes producers of games, operating systems software, programming languages, compiler software, and other software products.1
The telecommunications sector is divided into two segments, wired and wireless. The former conducts activities related to the operation and provision of access to transmission facilities or other infrastructure. These transmission facilities and infrastructure are owned by telecom companies for sending voice, data, text, sounds, and video using wired telecom networks. In addition, the telecom companies operate and use the network to provide a wide range of services such as wired telephone services, VoIP services, audio and video programming distribution, and wired broadband internet services. This category also includes online access service providers using their own wired telecom infrastructures. The wireless telecom category entails activities that are related to operating and maintaining switching and transmission facilities in order to provide communications services over the airwaves. After obtaining so-called spectrum licenses, companies can provide services using the spectrum, which include phone services, paging services, wireless internet access, and wireless video services.
Data processing and hosting, internet publishing and broadcasting, and web search portals cover a wide variety of data-related services. Companies in the data processing, hosting, and related services sector provide infrastructure for web hosting, streaming services and application hosting, and application services. They also include operations to produce complete processing and specialized reports from data supplied by clients and the delivery of automated (including electronic) data processing and data entry services. Internet publishing and broadcasting (including web search portals) are separated into those activities that publish and broadcast content exclusively on the internet; web search portals are websites that use a search engine to generate and maintain extensive databases of internet addresses and content in easily searchable format. The internet publishing and broadcasting companies provide text, audio, and video content through the internet only. Web search portals can also provide services such as e-mail, auctions, news, and connections to other websites.
The last category into which the last three sectoral activities fall cover all tasks that require expertise in the field of information technology; they (a) write, modify, test, and support software; (b) plan and design computer systems that integrate hardware, software, and communication technologies; (c) provide onsite management and operations of clients’ computer systems and data processing facilities; and (d) offer other technical computer-related services. Other services related to software analysis include webpage design, programming, computer-aided design, engineering, and manufacturing (CAD, CAE, CAM), systems integration design services, local area network (LAN) computer system integration design, and data processing facilities management and operation services.
WHO ARE THE USERS?
Using the BEA’s input-output tables, it is possible to identify the users and how much each user uses the data-related services as defined in table 10-1. National input-output tables are a good indicator of how much one unit of input from each of these data services is used by every downstream goods and services industry sector in an economy. Although ideally the input-output information of all countries would be analyzed, this is not possible because most national tables are too aggregated in their classifications and use different classification schemes. I select the US national input-output tables from the BEA for this exercise for two main reasons. These tables provide the most detailed worldwide data, including the disaggregated data sectors described earlier. Also, the tables’ industry classification fits perfectly with the NAICS sector descriptions, which can easily be matched with trade data in the next section.2
To perform the calculations, I select the six-digit input use table at producers’ price value from the Economic Accounts of the BEA, which provides input use figures for 389 industry groups, including services and goods sectors as well as agriculture and mining. These detailed industry groups are further sorted according to seventy-one three-digit combined industry groups and also into fifteen aggregated two-digit industry groups. The value of data use as a share of their total input use from the data-producing sectors in table 10-1 is calculated for each six-digit disaggregated industry sector. Then, in order to aggregate these detailed sector classifications into higher group sectors (either three-digit or two-digit) an unweighted average is computed. Figure 10-2 summarizes the results by two-digit sector and shows the main users of the services provided by data producers.
Unsurprisingly, the sectors that use data most intensively are the same sectors that also produce data services. Figure 10-2 shows that telecom and data processing services, internet publishing and web portals, together with publishing services (including software) and motion picture services are large users of data. In other words, those who produce data are also the ones that use data. On average this amounts to a data input usage of almost 12 percent of the value of total input use of all services and goods. However, a more surprising result shown in figure 10-2 is that the highest share of data, about 14 percent, appears to be used for management purposes inside companies. This share of data usage for management services inside companies is 2 percent higher than the share used by data services sectors themselves. It indicates that data play a crucial role in the process and development of firms’ management strategies and execution by their affiliates and other establishments.3
Another important user of data is the administrative services sector, which includes office administrative services, employment services, and business support services. These services are essential to operating a firm but are most often outsourced to external services suppliers and therefore do not constitute an important factor in the management decisions of companies. The share of data input usage in total input usage of this sector averages almost 10 percent. Next are business and professional services, which use around 9 percent of the data services inputs in total input usage. These types of services differ from office administrative services in the sense that they cover professional services. Examples are legal services, computer systems design and related services, and accounting, engineering, and management consultancy services, as well as market research and research and development services. These services are also usually provided by outside suppliers.
FIGURE 10-2. Share of Data Services Input Use by Sector, 2012 (in total input)

Source: Author’s calculations, using US Department of Commerce Bureau of Economic Analysis (BEA).
A second somewhat surprising result is that educational services is also a big user of data, even bigger than the financial and insurance sector. The education sector absorbs close to a share of 8 percent of data services inputs into total input usage, whereas the financial sector’s share of data usage is 5 percent. This is unexpected in the sense that the policy literature has emphasized the critical role of data in the development of the financial services sector. Figure 10-2 suggests that data likely play an equally important role in the development of the education sector. Included in the category of educational services are colleges, universities, and professional schools, business schools and computer and management training, and elementary schools and junior colleges.
The next categories that use data somewhat intensively are real estate, rental and leasing activities, wholesale trade, retail trade, arts and recreational services, warehousing and storage services, general merchandise stores, and utilities. Most of these services use data as an input that varies more or less between 2 and 4.5 percent. On the whole, all these sectors that report high data usage are services. The first goods sector listed in figure 10-2, apart from mining, is the metals, machinery, and electronics sector, which uses on average only 1.1 percent. Some disaggregated industry sectors, however, are rather data-intense, such as support activities for printing (NAICS 323120) with a usage of 7.6 percent, and optical instrument and lens manufacturing (NAICS 333314) with an input intensity of 4.2, but these are rare. Across all detailed manufacturing sectors, the average data input usage is 1 percent (see table 10A-1 in the appendix). Table 10A-2 lists the twenty disaggregated six-digit sector categories that use data most.
WHERE IN THE WORLD ARE DATA AND DATA SERVICES FLOWING?
Since most of the highest data intensities are found in services, I use the World Bank’s new Trade in Services (TIS) database to explore which sectors hold the biggest shares of trade in data-intensive services. This database is the most advanced source of information on services trade around the world, bringing together data from various other databases. Using mirror techniques, the TIS database collects information on bilateral trade flows from the Organization for Economic Cooperation and Development, Eurostat, the United Nations, and the International Monetary Fund. As such, it provides a consolidated and reconciled version of multiple sources of bilateral data in trade in services, and forms currently the best effort at doing so (see Saez and others 2015 for further insights).
As Meltzer (2014) points out, a lot of the services trade in the world takes place across the Atlantic. This is visible in table 10-2, which uses the TIS data and reports trade data in gross values for European Union, the United States, and the rest of the world (ROW). Table 10-2 sorts out the various sector classifications for which there are trade data available for the data-intensive services sectors given in figure 10-2. Note that services trade data are not available for all sectors mentioned in figure 10-2. As a result, table 10-2 is restricted to services sectors only, which can be justified by the fact that goods industries use only a small share of data in their input structure (as discussed in the previous section). Moreover, although the TIS database does report flows of personal services such as educational services and arts, entertainment, and recreation services, it is extremely hard for statisticians to collect trade data for these services. Therefore some data in these services sectors may be missing.
Table 10-2 indeed shows that most of the trade in data-intensive services sectors is captured by the EU and the US, but there are large differences. In fact, the United States holds a smaller trade share of these sectors. For instance, the highest US share in world trade is publishing, motion pictures, telecoms, and data processing, which is in line with what we could expect, since the United States is home to one of the world’s largest multinationals in this field. Yet this US share is less than the 40.2 global share held by the EU. Other sectors in which the United States holds a large world trade share are administrative services, business services, and financial services. But here too these figures are also lower than those of the EU. Therefore, an additional robustness check is performed in table 10-2, comparing the mean share of all three regions with aggregate services trade data (figures provided by the World Bank’s World Development Indicators). Table 10-2 shows, however, that differences between these two sources are relatively small, and hence the low trade shares of the US relative to the EU seem to be consistent across the two databases. Taken together, the figures point to the fact that, on average, a much larger share of sectors using data most intensively is captured by the EU.
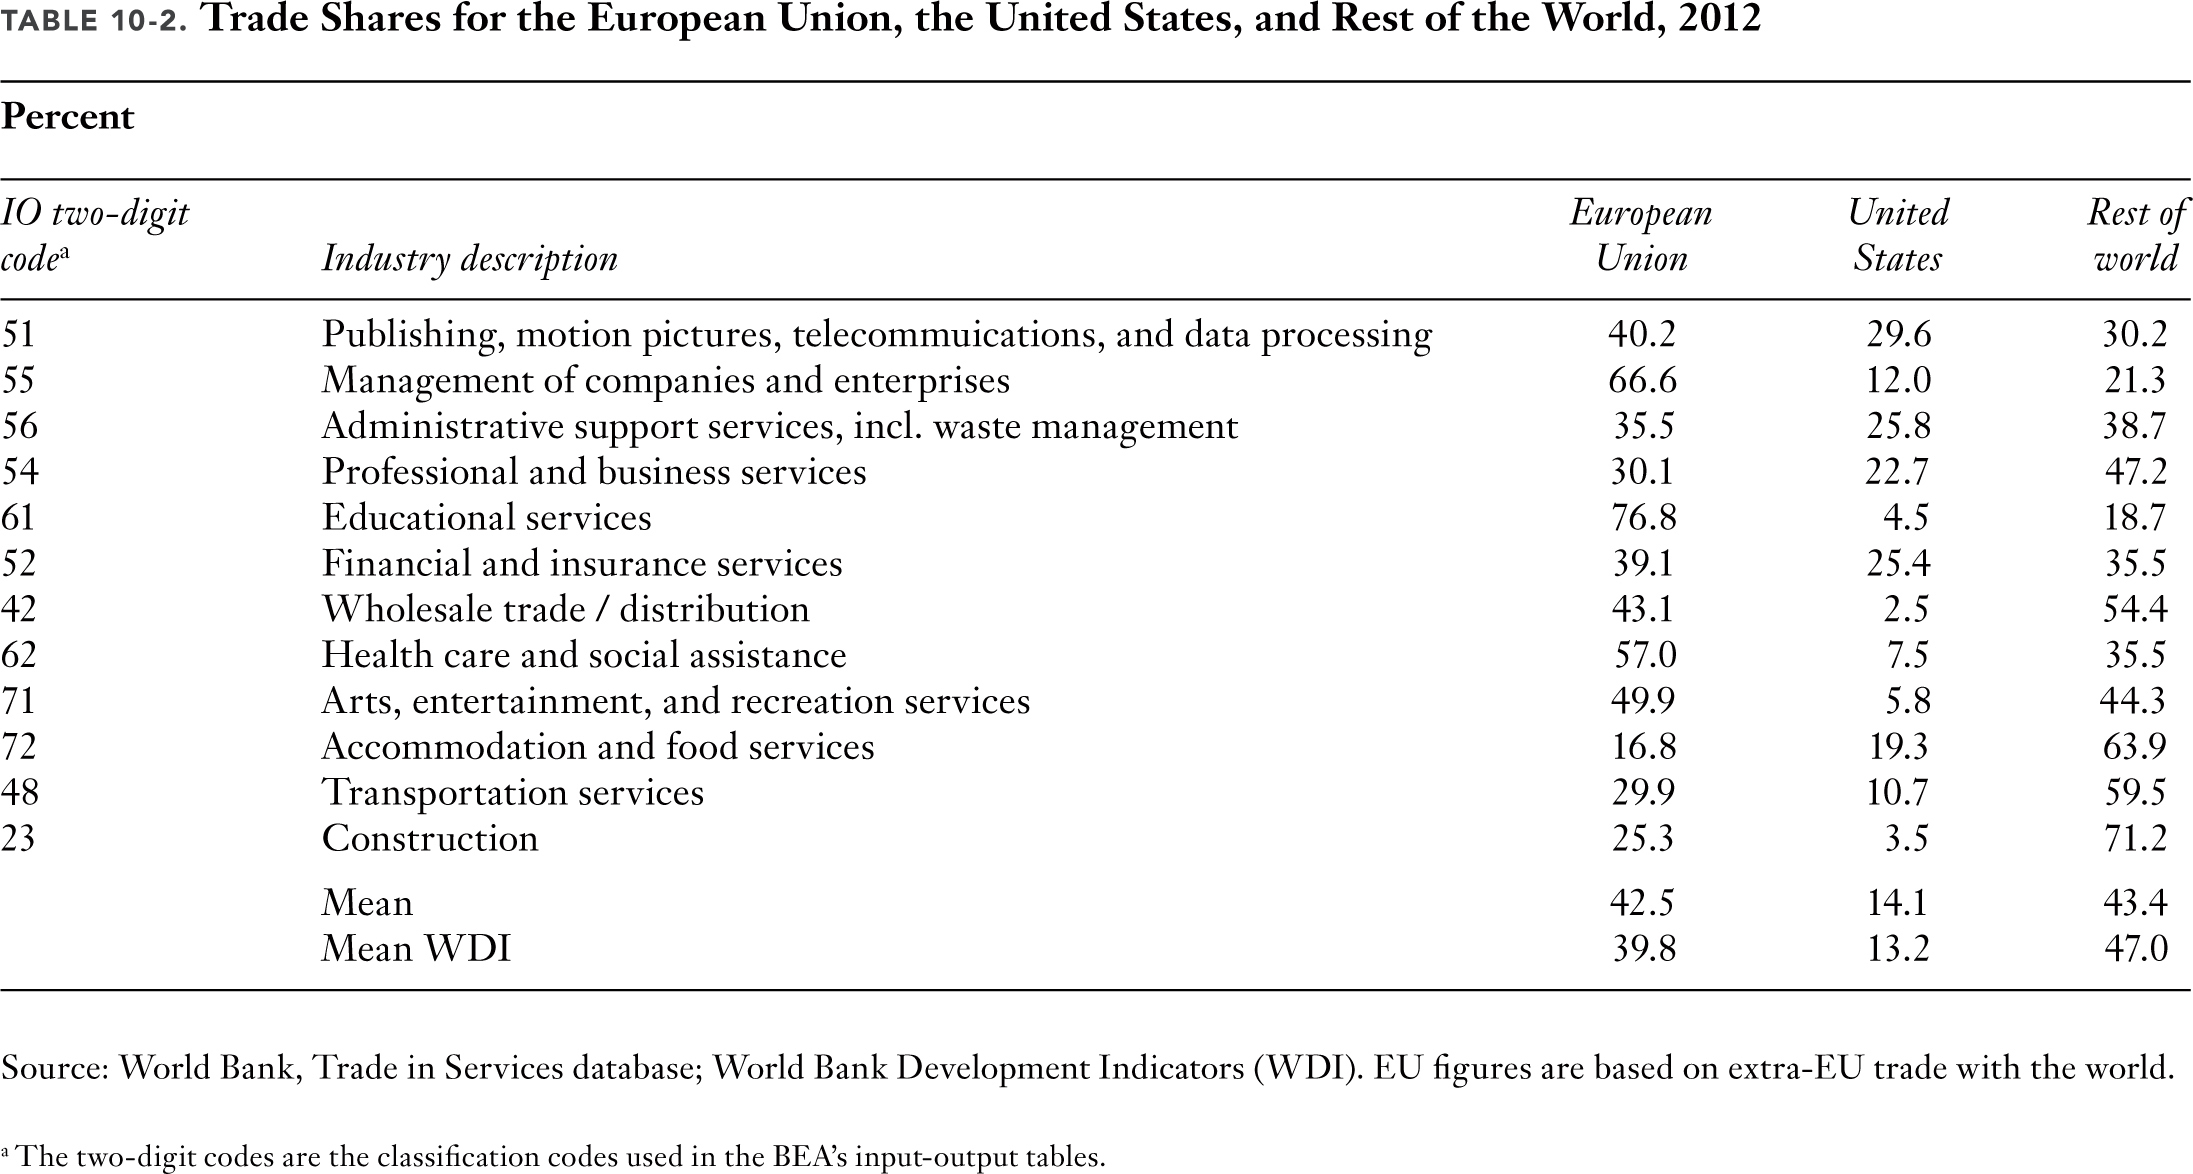
An interesting case in point is the trade share capture in management services between related enterprises. Table 10-2 shows that the EU has a much bigger trade share than the US in this sector as well. This category of trade in management services between related enterprises is the closest to the BEA’s input-output classification of management of companies and enterprises (as in figure 10-2) and can therefore offer some insight into the trading patterns in this data-intensive sector. This category includes services flowing from the parent to the affiliate enterprise company, and vice versa, that relate to the planning, organization, and control of these enterprises—that is, management services. These are flows of services activities inside multinational companies and are, on average, very data-intensive, as the previous section noted.4
What kinds of tasks constitute management services? Further insight on this question comes from the US Bureau of Labor Statistics (BLS), which gives a more precise picture of what occupations this services sector includes. The Occupational Employment Statistics database of the BLS is part of the US Department of Labor and records the share of occupations for each six-digit NAICS category that matches exactly with the management services sector category in figure 10-2. It therefore provides a clearer picture of which specific services tasks are actually traded inside the sector of management services. Among the major tasks grouped together in this sector, they relate to (in percentage terms of total amount of occupations) business and financial operations (21.8 percent), management occupations (20 percent), computer occupations (10.5 percent), and administrative support services (25.8 percent), which together constitute almost 80 percent of all occupations in this sector. Interestingly, one can see that these activities are closely related to the business services activities recorded in table 10-2 but in this case are traded within related companies. On a more detailed level, these in-house business activities include bookkeeping, accounting and auditing clerks, financial managers, first-line supervisors and managers of office and administrative support workers. They also cover general and occupational managers, business operations specialists, market research analysts and marketing specialists, management analysis, and even human resources activities.
Table 10-3 provides an overview of which countries are the biggest traders in this field, both importers and exporters. The table lists the countries that together represent around 95 percent of the total trade in management services between related enterprises worldwide. Most are developed countries, but some emerging countries are also listed, such as China, Russia, and Brazil. The largest traders in this services sector are the Netherlands, Great Britain, and Belgium, with 13.6, 11.1, and 10.7 percent shares, respectively, in the world. For smaller countries such as the Netherlands and Belgium, the total trade shares (including imports) are more sizable and represent, respectively, 4 and 5 percent of their national gross domestic product (GDP). Other countries for which the services trade between related affiliates forms a significant part of their domestic economies are also relatively small, such as Ireland, Hungary, and Luxembourg.
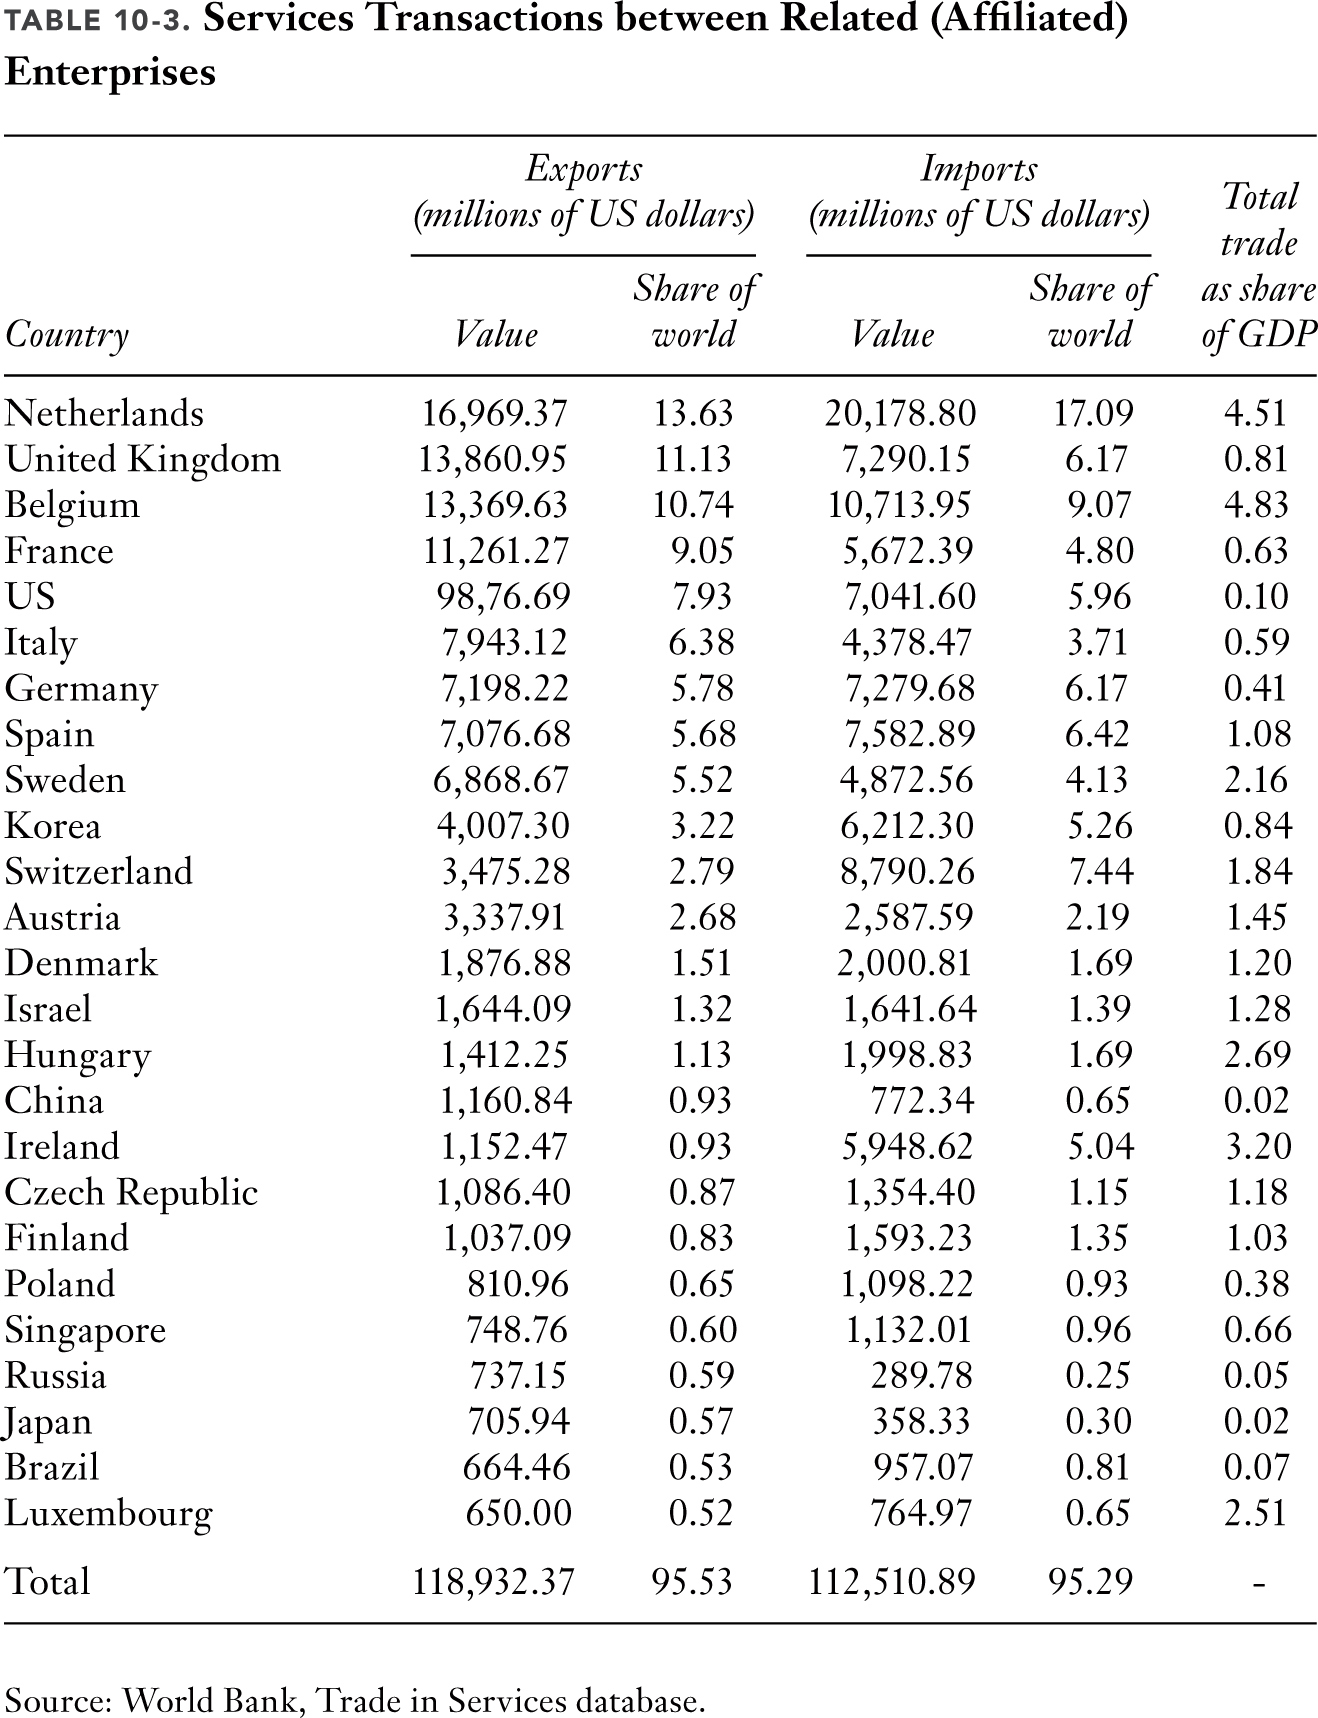
Among the larger countries, France, Italy, and Spain have shares of services trade in affiliated enterprises that are also large relative to their economic size, particularly in comparison with other large economies such as the United States and Germany. These latter two countries (especially the US) show low shares relative to their economies, although their nominal figures nonetheless remain strong. One potential explanation for the higher average share of the European countries is the world distribution of outward foreign direct investment (FDI) stocks: whereas the EU holds a stake of around 40 percent, the US has a relatively smaller share of outward stock in the world of around 24 percent (UNCTAD 2014). This may well be reflected in the United States’ lower share in services within multinationals worldwide. Yet both smaller and bigger countries capture a large share of world flows in management services within companies. This points to the fact that other factors apart from the structural determinants such as market size play a role in facilitating the data-intensive flows of these services. One obvious candidate is the digital infrastructure that helps companies to transmit data-intensive services.
WHERE ARE THE DATA FLOWING?
Although the ranking in table 10-3 is dominated by European countries and the US, some non-transatlantic countries are also included in the list. For example, Korea holds a larger share of management services than some European countries. Moreover, other emerging countries such as China, Russia, Brazil, and Israel also appear to capture a sizable share of imports and exports in management services between affiliated enterprises, despite the fact that the share of GDP is still comparatively low. On the whole, it therefore looks as if smaller countries are in a better position to hold world shares of trade in this type of services. On the other hand, smaller countries generally show higher relative shares of services trade given that a large majority of their economic activities is in services. The same is true for other data-intensive services such as business and administrative services. Seeing the specialization pattern in this light, services between related enterprises are just a part of the overall services sector and therefore can find a natural place in smaller economies.
Still, the two largest services economies, namely the EU and the US, do take up together a substantial share of all existing bilateral trade flows worldwide in data-intensive services, including management services between related enterprises. Figure 10-3 shows the transatlantic bilateral relationship of both imports and exports expressed as a share of the total amount of trade held by all other bilateral trade relations in services around the world. Figure 10-3 only shows the most data-intensive sectors as defined in figure 10-2, namely administrative support services (including waste management), management of companies and enterprises; professional and business services; and finally publishing, motion pictures, telecoms, and data processing. Both the US and the EU capture around 20 percent of the global trade in both professional and business services and publishing, motion pictures, telecom, and data processing services. This share is likely to be larger than between any other two bilateral trading partners worldwide and confirms Meltzer’s (2015) point that much of the services trade that is enabled by ICT and data takes place between the two Atlantic economies. For management services between related affiliates, the transatlantic parties embody around 17 percent of total world trade in this sector. Next is administrative services, at 10 percent.
FIGURE 10-3. Shares of Trade in Services: Transatlantic and Rest of the World (RoW), 2012

Source: World Bank, Trade in Services database.
a “Administrative” comprises administrative support services, including waste management.
b “Management” encompasses management of companies and enterprises.
c “Professional” includes professional and business services.
d “Publishing” covers publishing, media, telecommunications, and data processing activities.
On a larger scale, most of the bilateral trade in data-intensive sectors take place between OECD member countries. This is visible in figure 10A-1 in the appendix, which shows the bilateral trade shares within the OECD and for the rest of the world for each of the four data-intensive sectors. In this figure, the OECD captures the highest share in management services between related (affiliated) enterprises of around 86 percent. The shares of both administrative services and business services are 83 percent and 81 percent respectively in the OECD economies. The only sector that seems to be more widespread among the emerging economies is publishing, motion pictures, telecoms, and data processing services, with a share held by the rest of the world of 23 percent. Still, the large majority of trade in this sector takes place inside the OECD. One strong determinant of higher trade shares in data-intensive services is FDI. Particularly for management services in related enterprises, the amount of outward FDI as part of GDP appears to be strongly associated with total trade in this sector. This can be seen in figure 10A-2 in the appendix.
WHERE IS THE VALUE ADDED IN DATA?
As stated by the OECD (2013), the trade numbers presented in the previous figures are based on gross terms and therefore do not account for the real value added of exports. This is because gross trade includes double-counting of trade flows and does not measure exports of domestically produced goods and services only. Countries often produce services at home that are used as an input in other downstream goods (and services) production and then (indirectly) exported. Counting in gross terms therefore understates the importance of services, including data services. For this reason, the OECD has developed a new data set measuring the exact value-added of goods and services produced and then exported, directly or indirectly. Overall, this means that on the basis of value added in the US for instance, the significance of services increases to almost 50 percent, with particular importance for US downstream sectors such as wood and paper, transport equipment, and food products. In the EU this share is currently above 50 percent where value-added services are an important ingredient in transport equipment and food products in addition to electrical equipment and textiles and apparel.
FIGURE 10-4. Value-Added Share of Management Services among Other Services for France, 2009

Source: Author’s calculations using OECD, Trade in Value Added database and World Bank, Trade in Services database.
However, how much actual value added to data-intensive services flows into the wider direct and downstream economy? To take stock of most of the important data-intensive services as defined in the previous analysis, figure 10-4 presents a breakdown of the value added in services (of which data-intensive services are a part) for a typical European country, in this case France. Based on gross trade figures from the World Bank’s TIS database and using value-added figures from the OECD’s Trade in Value Added (TiVA) database, a rough estimate can be calculated that reflects the share of management services between affiliates as part of the overall business services sector. The estimate is obtained through a simple back-of-the-envelope calculation of the ratio of value added to gross values in the same service category. Admittedly, this is a crude measure, but it is only a first step in providing an approximation of the importance of management services. Note that the TiVA database sums the data for other sectors together, such as transport and telecom services, which are not separated from each other in figure 10-4. The TiVA database also includes other sectors such as distribution and financial services.
Figure 10-4 shows that, for France, the total economy takes up a value-added share of services of more than 40 percent, which is close to the OECD’s average of 48 percent. Within this services sector one can see that business services use the largest share of value-added services, around 15 percent. The distribution, transport, and telecom sectors are other large services sectors that produce and export value added output. Note that telecom and business services (which also includes administrative support and professional services) are considered data-intensive sectors. Management services between related affiliates have a share of 2.4 percent, which is more or less comparable to the amount of value added produced by the financial services sector in France. As such, this sector forms a nonnegligible part of the value-added production in the French economy, and together with all other services sectors that are data-intensive, shows the importance of data in reaping value added from these sectors. Of course, the importance of each sector is different in different economies. Yet, in most developed countries, data-dependent sectors such as business services, telecoms, finance, and management are important contributors to their economies.
In sum, both the producers of data services and the users of data services are situated everywhere around the globe, as are flows of data. Both the EU and the US, and especially the developed OECD countries, capture a large market share of trade in services that produce or use data—the so-called data-intensive and digital services. In fact, the both the US and the EU countries capture the majority of these very data-intensive services trade. Together the transatlantic economy shares are around 20 percent of the total data trade that flows between their individual markets. Surprisingly, the data tell us that a second important services sector that uses a lot of data in its production processes is management services between related enterprises—that is, transactions between related affiliates—a fact that has been somewhat overlooked in the literature. In this category, both small and large countries are large traders of data-intensive services, although the importance of these services tends to increase adversely with the size of the economy.
WHO HAS COMPARATIVE ADVANTAGE IN DATA-INTENSIVE SECTORS?
The fact that the economic importance of services, including data-intensive services, is greater for smaller countries does not necessarily mean that they have a comparative advantage in these digital services. Comparative advantage is defined as the relative productivity premium that countries have in producing and trading in a particular sector because they can provide the institutions, endowments, and investment climate that industries can capitalize on to increase the efficiency of their production processes. In other words, there is a “match” between the input components a country can provide and what an industry or sector needs. This can come in many forms. Some sectors need a strong rule of law because their sectors are sensitive to hold-up problems and therefore require strong contract enforcement mechanisms; other sectors are dependent on the availability of high-skilled or technological labor; and other sectors are likely to operate in countries with flexible labor markets because their methods of production require easy employment adjustments. These determinants of comparative advantage also have bearing for data-intensive sectors.
For these data-intensive sectors, table 10-4 uses a common measure called revealed comparative advantage (RCA) to show who has a comparative advantage between the EU and the US and the rest of the world in these sectors.5 Although this index is subject to some criticism, it is useful in identifying the relative productivity and trade specialization patterns of countries in a certain sector.6 Table 10-4 tells us that the EU has a strong comparative advantage in some data-intensive sectors such as management of companies and enterprises, educational services, and wholesale and retail trade. In addition, the EU holds a comparative advantage in the category covering telecoms and data processing services, but the US appears to have an even stronger comparative advantage in these sectors. Similarly, for professional and business services, administrative support services, and financial services the US appears to have a stronger position in export productivity differences between sectors, though in some of these sectors the EU also has a comparative advantage.
WHO IS BEST PLACED TO HAVE COMPARATIVE ADVANTAGE IN DATA?
The RCA indicator does not yet provide the countrywide factors that influence the performance of data-intensive industries and sectors and their difference in productivity across countries. In other words, the figures in table 10-4 do not say anything about what actually determines why countries trade more or less of a service that is data-intensive. As noted earlier, a good match between what a country can provide in endowment structure and the needs of a specific sector defines the source of comparative advantage. If a sector is skill-intensive it will most likely place its production facility in a country that can provide a skilled labor force. Likewise, if an industry is prone to many hold-up problems in the supply chain, companies in this sector are likely to choose a country with strong rule of law so that contracts can be enforced.7 Countries differ in their ability to provide these factors and institutions. As for sectors that use lots of data, some use more data than others, as figure 10-2 shows, because of the way they produce a good or service. Therefore companies that produce data-intensive services are more likely to settle where the “digital infrastructure” is best so that data can be used efficiently.

FIGURE 10-5. Correlation between Network Readiness and Exports in Management Services, 2012
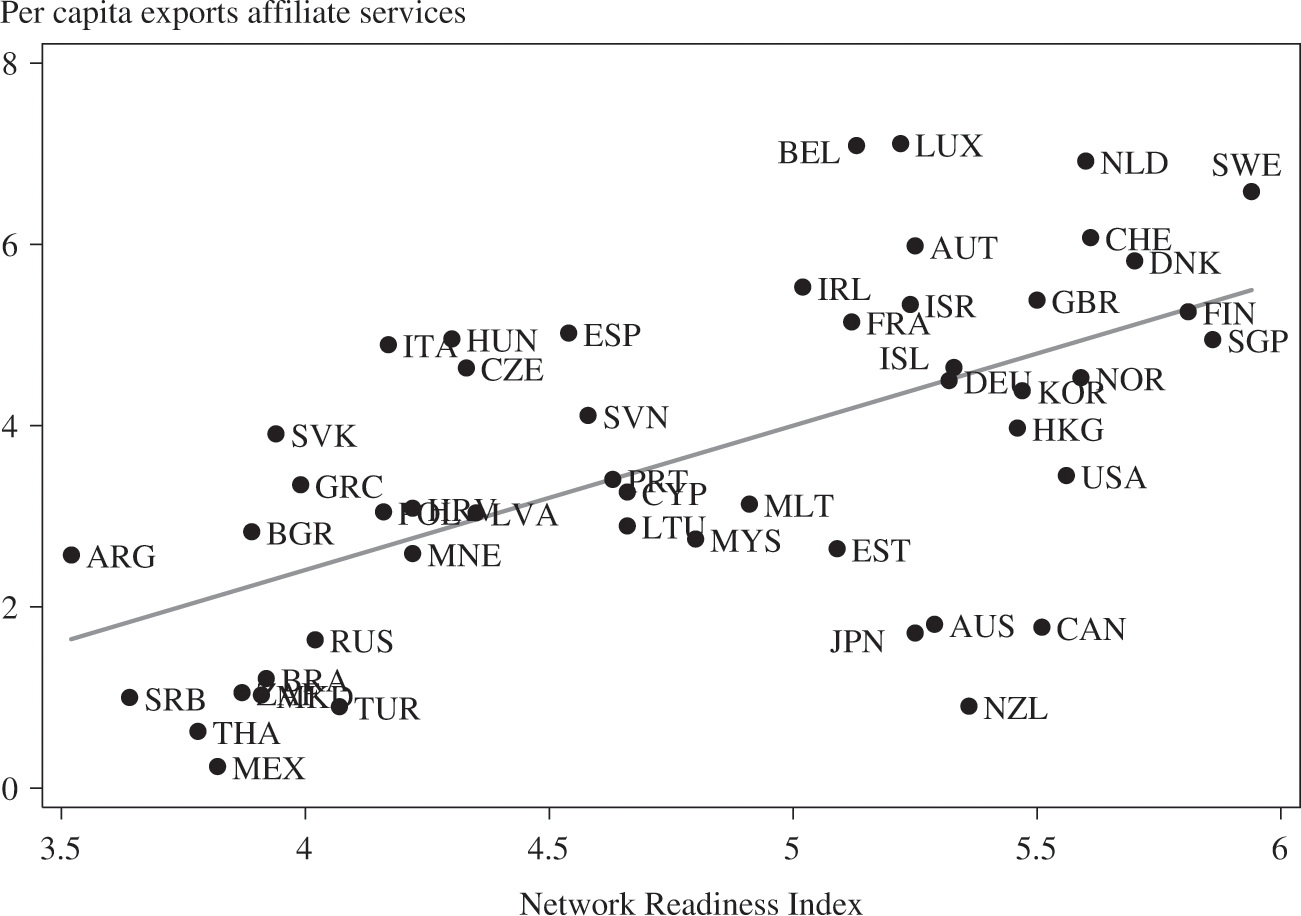
Source: Author’s calculations using data from World Economic Forum (2012); and World Bank Trade in Services database
The World Economic Forum (WEF) Network Readiness Index is one indicator of a location’s digital infrastructure. The index measures the extent to which an economy is prepared to apply the benefits of information and communications technologies (ICTs) to promote economic growth and well-being. Included in this measure are factors such as the amount of broadband and the number of internet subscriptions in a country, whether a country has the latest technologies available, whether firms absorb technology, and whether multinational corporations bring new technologies into the domestic economy. These subindicators of the NRI all signify in one way or another whether data can move efficiently within a country. This information will affect the productivity term of data-intensive industries: a good match between a country’s digital infrastructure and the level of trade required by data-intensive services sectors can give them a comparative advantage. Figure 10-5 indeed shows that, for instance, countries with a higher index value of network readiness are better able to export management services between affiliates, which is as we have seen a data-intensive sector. This correlation also holds for the other data-intensive sectors.
As figure 10-5 shows, countries that are lower on the horizontal axis, which measures network readiness, such as Venezuela and Iran, also show lower export levels of affiliated management services within enterprises, which is measured on the vertical axis. On the other hand, countries that ranked high in table 10-3 (and higher on the vertical axis in figure 10-5) such as Sweden, Spain, and the Netherlands are situated on the right-hand side of the Network Readiness Index, indicating high levels of exports in management services between enterprises. Some countries are doing better than others. For instance, Japan, which has a high network readiness score, is below the fitted values line, which means that one would expect it to have a higher level of exports in affiliate services. This is for instance confirmed by the fact that Germany and Austria, which have an equal level of data infrastructure (i.e., network readiness) as Japan, show much higher affiliated services exports and are therefore placed above the (average) fitted values line.
To formally test whether countries with a better digital infrastructure truly export more data-intensive services (including management services) a small empirical estimation can be applied. This estimation uses an econometric strategy to test for the assertion that the Network Readiness Index is indeed a robust factor in determining the level of trade in data-intensive services. Equation 1 uses this countrywide indicator to proxy for the quality of data infrastructure while plugging in the data intensities by sector. These two indicators are then interacted with each other and used as a dependent variable in a regression:

where Xoi stands for the exports of country o in each sector i sourced from the Trade in Services database from the World Bank (Saez and others 2015). The first term on the right-hand side of equation 1 is the interaction variable of interest, which represents the source of comparative advantage regarding data usage and data infrastructure (NRI). This interaction variable interacts the data intensities of all sectors (both data-intensive and non-data-intensive) with the Network Readiness Index. The third term is also an interaction term using data intensities, but controls for various other determinants of comparative advantage found in the literature with which data intensity might correlate. These include a better quality of education and the quality of domestic institutions. Once these are added to the regression the true marginal importance of the NRI as a determinant is revealed. I also control for all other issues that may be found collinear at the level of exporter, γo, and sector, δi, which are the so-called fixed effects. Last, the term εoi. stands for the error term satisfying the usual assumptions. The year 2012 is chosen for all the variables, and services sectors are used only to avoid data inconsistencies. Data for data-intensities (DI) are based on the ones presented in figure 10-2. Data for all other variables are sourced from standard data databases.

The results of the regression are presented in table 10-5. Column 1 shows the data intensity share of all sectors interacted with the Network Readiness Index. Not only is the coefficient positive and very significant; the coefficient size is also quite large. The large coefficient size indicates that there is a large effect of this source of comparative advantage on a country’s trade patterns in data-intensive services sectors. Hence, countries that indeed provide a better digital infrastructure also have high levels of data-intensive exports. Column 2 adds a separate entry to the interaction term where data intensity is multiplied with a measure of human capital (HC), using quality of education indicators described by the World Economic Forum (2013). It shows that this interaction variable becomes positive but insignificant, and that the original term with the network readiness component remains robustly positive and significant.
This remains true when I add a separate entry (column 3) to the countrywide variable—the availability of capital (K)—although this term also becomes positive and significant. It indicates that next to the network readiness measure, the amount of capital a country has is probably also a factor that influences trade in data-intensive services. Finally, I include two additional factors that may influence the significance of the previous variables. These are the quality of institutions (rule of law) from the World Bank’s Governance Database and GDP per capita from the World Development Indicators. The NRI interaction term loses its significance and the outcome of this variable becomes negative. The switch of sign and significance indicates that there are some collinearity issues in the regression. The reason for this is that both GDP per capita and the quality of rule of law are highly collinear with each other and with the NRI indicator. On the other hand, the interaction term with the quantity of capital stock remains significant and robust.
CONCLUSION AND POLICY IMPLICATIONS
This chapter attempts to disentangle flows of data by documenting the sectors and activities in the economy where most data are produced and used, analyzing which countries capture most of the trade in data-intensive services, and assessing factors that determine a country’s success in exporting data-intensive services. Unsurprisingly, most data are used in telecom services, sound recording services, data processing and hosting services, and web portal services. These are also to a large extent the producers of data services. Most developed countries hold a large share of trade in these sectors, although emerging countries also capture a sizable part of global trade in data-intensive services sectors, especially the bigger ones, such as China.
One surprising result of this study is that such large quantities of data are not only used in the aforementioned services sectors, but also in services that flow between affiliates of the same enterprise, so-called management services. These are services that relate to the supervision, control, and organization of related subsidiaries and affiliates within the same enterprise. Many tasks within these services between affiliates consist of financial planning services, management monitoring, bookkeeping services, and various other business and administrative support services. This category of services may have been overlooked in the existing literature, but using detailed input-output tables shows that this sector has had a higher data share in recent years than the data-producing industries such as telecom and data processing services. Moreover, trade in these data-intensive services is substantial for developed and emerging economies. Given that services supply chains are likely to grow with the progressive application of internet technologies, this type of trade within multinationals is likely to increase further.
These dynamics have implications for policy. Current policy initiatives around the world regarding the flow of data aim to secure the transfer of so-called personal data. An example is the EU’s General Data Protection Regulation (GDPR), which provides a regulatory framework for the protection of personal data and the privacy of individual EU citizens. It also addresses the cross-border transfer of personal data outside the EU and European Economic Area (EEA) and establishes certain conditions that firms need to meet to move personal data outside the EU or the EEA. If these are not met, data must be kept within these two areas, unless the EU establishes so-called adequacy status to a particular country (this is based on a determination by the EU that the country has equally protective rules regarding personal data). Other countries apply different standards and approaches to data privacy. In the countries of the Association of Petroleum Exporting Countries (APEC), for example, Cross-Border Privacy Rules (CBPRs) apply. These are based on an accountability approach and are legally enforceable. They also give rise to compliance costs for firms but are claimed to be more business-friendly.
Many firms active in the data-intensive sector are dealing with data that consumers provide during transactions such as bank account transfers and travel arrangements booked online. Yet these types of data are only part of the story. As noted, many services use a lot of data, much of which flows inside firms. Although these data will include personal information about client firms used to develop marketing strategies or information about employees used for human resources purposes, many services exchanged between affiliates of multinationals will have less direct links with personal information. The amount of personal information in data flows across borders is not known. One analysis claims that a substantial share of data flowing around the globe is in fact personal (MIT 2015). One reason is that many of the services tasks undertaken by affiliates deal with finance, accounting, and the overall control (management) of enterprises. Personal data are likely to be embedded in some way in many of these activities.
Personal data inside the firm are regulated in many countries. The finding here that many data-intensive services are associated with management services exchanged between affiliates will put a natural policy emphasis on the way data are treated inside a multinational firm. Current frameworks dealing with intrafirm data include Binding Corporate Rules (BCRs), which are legally enforceable within a corporate group and require a uniform level of regulation for all affiliates across the countries in which the multinational firm operates. The EU GDPR specifies that if no adequacy (equivalence) decision applies to a given partner country, firms can use these BCRs to transfer data across borders, although this will be associated with certain additional costs as these rules and clauses can be burdensome.
To the extent that this type of regulatory framework seems appropriate for exchange of data between affiliates, it would not apply to inter- or intraindustry data flows between nonaffiliated firms. For that purpose, some countries have implemented or proposed regulatory policies for the transfer of data to third parties. Examples include consent requirements, the Safe Harbor Framework between the EU and the US, and standard contractual clauses. The APEC cross-border privacy rules also allow for a compliance program for data transmissions to third parties, but as a private standard. A final policy proposal that deals with intracompany and third-party data flows is to award a “privacy seal” to companies that prove they are capable of abiding by a certain set of rules. Such certification would allow data to flow between trusted importers and exporters. Some countries such as the UK are organizing this policy on a sector-specific basis. This may be an efficient way of dealing with the matter for data-intensive services, as most of these services fall in the same sector category, namely business services.
A better approach to dealing with data policies, and in particular strict requirements conditional data transfers, would be at the multilateral level. For basic economic reasons this would allow countries (and firms) to profit from rules that are applied in a nondiscriminatory manner or in a way that the costs of the rules are equally shared by the trading partners. Therefore, a 2019 joint statement on e-commerce at the WTO by a group of more than seventy-six members was a very welcome step forward. At the 2019 World Economic Forum in Davos, these members agreed to start negotiations to put in place global rules on electronic commerce. A multilateral agreement on data localization policies and associated regulatory requirements would be very beneficial given the increasing prevalence of such policies (Ferracane, Lee-Makiyama, and van der Marel 2018).
APPENDIX

TABLE 10A-2. Top Twenty Users of Data by Six-digit Sectors
|
Six-digit codea |
Data intensity |
Industry description |
||
|---|---|---|---|---|
|
517A00 |
0.429 |
Satellite, telecommunications resellers, and all other telecom |
||
|
517210 |
0.255 |
Wireless telecommunications carriers |
||
|
519130 |
0.225 |
Internet publishing and broadcasting and Web search portals |
||
|
517110 |
0.206 |
Wired telecommunications carriers |
||
|
812900 |
0.167 |
Other personal services |
||
|
611B00 |
0.161 |
Other educational services |
||
|
511200 |
0.153 |
Software publishers |
||
|
561500 |
0.153 |
Travel arrangement and reservation services |
||
|
518200 |
0.152 |
Data processing, hosting, and related services |
||
|
561600 |
0.143 |
Investigation and security services |
||
|
550000 |
0.141 |
Management of companies and enterprises |
||
|
5419A0 |
0.138 |
Other professional, scientific, and technical services |
||
|
561400 |
0.134 |
Business support services |
||
|
541100 |
0.132 |
Legal services |
||
|
54151A |
0.131 |
Other computer related services, including facilities management |
||
|
541200 |
0.118 |
Accounting, tax preparation, bookkeeping, and payroll services |
||
|
561100 |
0.114 |
Office administrative services |
||
|
541610 |
0.113 |
Management consulting services |
||
|
561300 |
0.111 |
Employment services |
||
|
5416A0 |
0.108 |
Environmental and other technical consulting services |
||
|
Source: US Department of Commerce, Bureau of Economic Affairs (BEA). |
||||
|
a The six-digit codes are the classification codes used in the BEA’s input-output tables. |
||||
FIGURE 10A-1. Bilateral Share of Trade in Services for OECD and the Rest of the World (RoW), 2012

Source: World Bank, Trade in Services database.
a “Administrative” comprises administrative support services, including waste management.
b “Management” encompasses management of companies and enterprises.
c “Professional” includes professional and business services.
d “Publishing” covers publishing, media, telecommunications, and data processing activities.
FIGURE 10A-2. Correlation between Foreign Direct Investment and Trade (Imports and Exports) in Management Services, 2012

Source: Author’s calculations from World Economic Forum data (2012); World Bank, Trade in Services database; and World Bank World Development Indicators.
NOTES
1. The explanations that follow describe each six-digit sector listed in table 10-1 and follow closely the US Census explanations of the NAICS classification system.
2. Note that using US input-output tables to calculate any kind of intensity (capital, labor, or institutional, e.g.) and extrapolate to other countries is a common exercise in the empirical trade literature.
3. The BEA’s input-output tables are classified according to the NAICS classification system, NAICS 55000. This category comprises two types of establishments: (1) those that hold shares or securities of companies and enterprises with a view to influencing management decisions or owning a controlling interest; and (2) those that administer, oversee, and manage affiliates of the company or enterprise. The latter establishments have a strategic or organizational planning and decisionmaking role in the company or enterprise and may also hold shares or securities of the company or enterprise. The purpose of this output sector is to consolidate the performance of essential in-house activities to realize economies of scale through management and organizational decisions that lower the long-term average expenditures by the company by spreading fixed costs over many units of output.
4. The Manual on Statistics of International Trade in Services 2010 (MSITS2010) states that trade in services transactions between related enterprises are recorded separately from unrelated enterprises. In the Extended Balance of Payments Services Classification (EBOPS2010), this category of transactions between related enterprises is recorded under the three-digit code 285. The category of trade in services between related enterprises therefore provides information on the value of services flowing between affiliated companies or enterprises in which a direct investment has taken place and includes payments from the parent company to the affiliate establishment, and vice versa, related to the management of establishments, subsidiaries, associates, or the parent company. This category captures all types of services transactions and is not recorded for each services sector separately. Contracts involving outsourcing to unrelated specialist companies previously supplied are not included. These latter types of services are usually recorded in the appropriate sector classification within EBOPS according to the type of service.
5. The RCA index compares the share of a sector’s exports in a country’s total exports with the share of exports of all countries in the same sector in total world exports. The higher the ratio, which can range from zero to infinity, the more competitive the country is in the sector. The RCA index is calculated as follows: RCAik = (xik/Xi) / (xwk/Xw) where xik is country i’s exports of sector k, Xi is total exports of country i, xwk is world exports of sector k, and Xw is total world exports.
6. One criticism is that this measure is not insensitive to policies that alter the patterns of trade, which will then be included in the comparative advantage indicator. It would not therefore be a neutral indicator. For example, policy variables such as regulation could affect comparative advantage, although other policies such as subsidies could increase the export volumes rather than exploit productivity differences. See Siggel (2006).
7. See Chor (2012) and van der Marel and Shepherd (2013) for further insights on comparative advantage.
REFERENCES
- Bauer, M., F. Erixon, and H. Lee-Makiyama. 2013. “The Economic Importance of Getting Data Protection Right: Protecting Privacy, Transmitting Data, Moving Commerce.” Brussels: European Centre for International Political Economy.
- Bauer, M., and others. 2014. “The Costs of Data Localization: A Friendly Fire on Economic Recovery.” ECIPE Occasional Paper 3/2014. Brussels: European Centre for International Political Economy.
- Chor, D. 2011. “Unpacking Sources of Comparative Advantage: A Quantitative Approach.” Journal of International Economics 82 (2): 152–67.
- Christensen, L., and others. 2013. “The Impact of the Data Protection Regulation in the EU.” Intertic Policy Paper, http://citeseerx.ist.psu.edu/viewdoc/download?doi=10.1.1.657.138&rep=rep1&type=pdf.
- Ferracane, M. F., J. Kren, and E. van der Marel. 2019. “Do Data Policy Restrictions Impact the Productivity Performance of Firms and Industries?” EUI Working Paper RSCAS 2019/28. Florence: European University Institute.
- Ferracane, M. F., H. Lee-Makiyama, and E. van der Marel. 2018. “Digital Trade Restrictiveness Index.” Brussels: European Centre for International Political Economy.
- Ferracane, M. F., and E. van der Marel. 2019. “Do Data Flows Restrictions Inhibit Trade in Services?” EUI Working Paper RSCAS 2019/29. Florence: European University Institute.
- Kommerskollegium. 2015. No Transfer, No Production: A Report on Cross-Border Data Transfers, Global Value Chain, and the Production of Goods. Stockholm: Kommerskollegium.
- Manyika, J., and others. 2016. “Digital Globalization: The New Era of Global Flows.” McKinsey Global Institute. Washington, D.C.: McKinsey.
- Martens, B. 2013. “What Does Economic Research Tell Us about Cross-Border E-commerce in the EU Digital Single Market?” JRC-IPTS Working Papers on Digital Economy 2013-05. Seville, Spain: Institute of Prospective Technologies Studies, Joint Research Centre.
- Melzer, J. 2014. “The Importance of the Internet and Transatlantic Data Flows for US and EU Trade and Investment.” Global Economy and Development Working Paper 79. Brookings.
- Miroudot, S., D. Rouzet, and F. Spinelli. 2013. “Trade Policy Implications of Global Value Chains: Case Studies.” OECD Trade Policy Paper 161. Paris: OECD Publishing.
- Massachusetts Institute of Technology (MIT). 2015. “A Business Report on Big Data Gets Personal.” MIT Technology Review. MIT.
- Organization for Economic Cooperation and Development (OECD). 2013. “OECD-WTO Database on Trade in Value-Added: First Estimates.” Paris: OECD Publishing.
- ________. 2014. “FDI in Figures: International Investment Stumbles into 2014 after Ending 2013 Flat.” Paris: OECD Publishing.
- Saez, S. D., and others. 2015. Valuing Services in Trade: A Toolkit for Competitiveness Diagnostics. Washington, D.C.: World Bank.
- Siggel, E. 2006. “International Competitiveness and Comparative Advantage: A Survey and Proposal for Measurement.” Journal of Industry, Competition and Trade 6 (2): 137–59.
- Van der Marel, E., and B. Shepherd. 2013. “International Tradability Indices for Services.” Policy Research Paper 6712. Washington, D.C.: World Bank.
- World Economic Forum. 2012. The Global Information Technology Report 2012: Living in a Hyper-Connected World. Geneva.
- ________. 2013. The Human Capital Report. Geneva.