12
REGIONAL TRADE AGREEMENTS AND TRADE COSTS IN SERVICES
SÉBASTIEN MIROUDOT AND BEN SHEPHERD
There are several motives for negotiating regional trade agreements (RTAs) and not all of them are based on economic considerations (WTO 2011).1 However, it seems straightforward that when signing an RTA, countries’ aim is to reduce trade barriers among themselves. Preambles of trade agreements usually emphasize the promotion of trade and the removal of trade distortions as objectives that motivate the disciplines of the agreement. We should therefore expect RTAs to decrease trade costs between their parties, and empirical work in the case of goods tends to support this idea (see, e.g., Pomfret and Sourdin 2009; Chauffour and Maur 2011; and WTO 2011 for a review).
Regional trade agreements covering services have not proliferated as much as those covering goods, but about half of RTAs in force cover services. There were 149 agreements notified to the WTO under the General Agreement on Trade in Services (GATS) at the end 2018; 294 were notified under the General Agreement on Tariffs and Trade (GATT). The number of RTAs notified each year decreased for several years after 2010, and subsequently began accelerating after that. This is true both for goods agreements and services agreements. Hence the focus in our empirical work on 1999–2011, which was the period of rapid expansion of services RTAs.
Recently signed RTAs are generally characterized as having characteristics of “deep integration” because they go beyond traditional market access concerns and deal with a broad range of trade-related issues. They also deal more with “behind-the-border” policies and address domestic regulations that have an impact on trade. Services is somehow a “borderline” area. Part of services commitments in RTAs is, strictly speaking, about “market access.” But as barriers to trade in services are mainly behind-the-border, services also illustrate the so-called deep integration disciplines in recent RTAs.
Moreover, there is a consensus in the literature that services RTAs are WTO-plus. Several studies comparing market access and national treatment commitments in GATS and commitments in RTAs have found unequivocally that the latter cover many more subsectors than the former (Marchetti and Roy 2008; Fink and Molinuevo 2008; Miroudot, Sauvage, and Sudreau 2010)2. But commitments are legal bindings and do not always correspond to the actual trade regime, which might be more liberal (or less liberal). The extent to which services RTAs have led to trade liberalization and actually reduced trade costs becomes an empirical question.
Building on Miroudot, Sauvage, and Shepherd (2012), where we developed theory-consistent estimates of bilateral trade costs for a large number of countries over the period 1999–2009 (and which we extend to 2011 here), we further analyze the relationship between regional integration and the evolution of trade costs in services industries. The next section explains how we measure trade costs in services and describes the database of services commitments in RTAs that we use in the analysis. The following two sections provide stylized facts on trade costs within and outside regional trade agreements and discuss why services RTAs seem to have a limited impact on trade costs in services.
EMPIRICAL DATA ON TRADE COSTS AND SERVICES TRADE LIBERALIZATION AT THE REGIONAL LEVEL
Starting from the standard, theory-consistent gravity model of Anderson and van Wincoop (2003), Novy (2011) develops a comprehensive measure of bilateral trade costs.3 Equation 1 presents that measure in ad valorem equivalent terms as τijkt, where k indexes sectors and t indexes time. It is the geometric average of bilateral trade costs for exports from country i to country j and from country j to country i, expressed relative to domestic trade costs in each country (![]() and
and ![]() respectively). To calculate it, all that is required are data on domestic production relative to nominal exports in both countries (
respectively). To calculate it, all that is required are data on domestic production relative to nominal exports in both countries (![]() and
and ![]() respectively). The parameter σ is the elasticity of substitution among varieties in a sector, assuming the Anderson and Van Wincoop–based derivation of Novy’s measure of trade costs.
respectively). The parameter σ is the elasticity of substitution among varieties in a sector, assuming the Anderson and Van Wincoop–based derivation of Novy’s measure of trade costs.

Intuitively, Novy’s measure captures the fact that if a country’s trade costs fall more than those of its trading partners, then a part of its production that was previously consumed domestically will instead be shipped overseas. Trade costs are thus closely related to the extent to which a country trades with itself rather than other countries, and data on this kind of relative openness can be used to track the level of trade costs and their variation over time. Importantly, this measure of trade costs is “top down” rather than “bottom up.” By this we mean that it infers the ratio of inter- to intranational trade costs based on observed patterns of production and trade around the world, rather than building up an estimate of trade costs based on data covering particular types of impediments to trade. It thus takes account of all factors that influence trade costs, and is not subject to the kind of omitted variables bias that calls into question the results of previous attempts to measure trade costs in services by analyzing the results of gravity model estimates (e.g., Walsh 2006).
Bilateral Trade Costs in Services: A Database Covering Sixty-one Countries over the Period 2000–2011
We use the above approach to calculate new trade cost measures for sixty-one countries and nine broadly defined industries (including four for services) over the period 2000–2011. Our measure of trade costs captures the costs associated with “pure” cross-border services trade under Modes 1, 2, and 4 of the General Agreement on Trade in Services (GATS). We do not extend the analysis to sales by foreign affiliates (GATS Mode 3) due to lack of data.4 For sectoral output and exports, we rely on the information provided in the OECD Inter-Country Input-Output tables that are constructed for the OECD-WTO Trade in Value Added (TiVA) database.5 These data are already harmonized and made comparable across countries. They are sourced from national accounts but reconciled with trade statistics in a global accounting framework. For data on trade in goods, we rely on the OECD’s International Trade by Commodity Statistics (ITCS) database, which provides data on bilateral trade flows directly in the ISIC Revision 3 format. Things are more complicated for services, where the coverage of official statistics is generally weak and data are not always available at the bilateral level by industry. We also rely on the work done by the OECD and the WTO in the context of the TiVA database, using a set of harmonized data from the OECD’s Trade in Services by Partner Country database (TISP), Eurostat’s balance of payments statistics, and the UN’s Service Trade database. This data set includes various estimates, and all data are converted from the Extended Balance of Payments Services (EBOPS) classification to ISIC Revision 3 using a concordance.6 In line with Novy (2011), we assume σ = 8 throughout, but our results are robust to alternative assumptions.
FIGURE 12-1. Average Trade Costs in Services Sectors, Tariff Equivalent, 2000–2011

Source: Authors’ calculations.
By way of introduction to the trade costs data, figure 12-1 presents average figures for the period 2000–2011. The data are disaggregated by sector, and trade-weighted tariff equivalents are calculated.
Trade costs are very high for the construction industry (keeping in mind that only cross-border flows corresponding to short-term construction projects are accounted for in balance of payments statistics), while a convergence is observed for other services industries, with still significantly high trade costs around 100 percent when expressed as a tariff equivalent. Trade costs declined between 2000 and 2008, but services trade costs began rising again after the crisis.
Services Commitments in Sixty-six Regional Trade Agreements
To assess the impact of RTAs on trade costs, we use a database developed at the OECD that covers all services agreements to which an OECD economy, China, or India is a party (Miroudot, Sauvage, and Sudreau 2010). This accounts for sixty-six of the eighty-eight agreements notified to WTO under GATS Article V (as of August 2011).7 The database reports market access and national treatment commitments in the 155 subsectors of the GATS Services Sectoral Classification List (referred to as W/120). Horizontal restrictions—those that apply to all subsectors—are also taken into account and reported for all subsectors. The information is provided for each signatory of the RTA by mode of supply.
Commitments are “full” (no limitation), “partial” (some limitations listed), or “unbound” (no commitment). In addition, “partial” commitments are broken down into nine different types of trade-restrictive measures, four for market access and five for national treatment. This classification of nonconforming measures is detailed in table 12-1. The database includes similar analysis for commitments in GATS and can be used to assess to what extent RTAs are WTO-plus and provide for additional commitments.
As this database is of a qualitative nature, we compute indexes that capture the extent to which services RTAs are more preferential than the GATS. The methodology is the following. An initial score of 100 is assigned to each agreement, country, subsector, and mode of supply regardless of its degree of commitment (including the GATS). Then, depending on whether the subsector is full, unbound, or subject to some restrictions (partial), some points are deducted from this amount. The precise number of points granted to each restriction relies on a few assumptions:
- Market access matters relatively more than national treatment.
- Unbound is worse than partial, which is in turn worse than full.
- Quantitative restrictions such as quotas and licensing requirements are more trade restrictive than discrimination on subsidies or prohibitions on partnerships, for instance.
TABLE 12-1. Typology of Limitations in Partial Market Access and National Treatment Commitments in Regional Trade Agreements
|
Market access |
Type of restriction |
Mode of supply |
Examples |
|||
|---|---|---|---|---|---|---|
|
MA1 |
Scope of subsector limited (in comparison with the W/120 classification)a |
All |
Commitment limited to a list of activities Commitment in subsector x but not including y |
|||
|
MA2 |
Restrictions on foreign ownership or on the type of legal entity |
Mode 3 |
Foreign equity limits Only joint ventures allowed Restrictions on mergers and acquisitions for foreign firms |
|||
|
MA3 |
Quantitative restrictions on the service or services |
Modes 1, 2, 3 |
Limitations on the number of service suppliers (e.g., quota or economic need test) Limitations on the total value of transactions or assets Limitations on the quantity of service output |
|||
|
MA4 |
Market access restrictions on the movement of people |
Mode 4 |
Limitations on the number of natural persons Nationality requirements for suppliers of services |
|||
|
National treatment |
||||||
|
NT1 |
Nationality and residency requirements for boards of directors and managers; discriminatory licensing requirements |
Modes 1, 3 |
Nationality and residency requirements for boards of directors and managers Discriminatory licensing requirements |
|||
|
NT2 |
National treatment restrictions on the movement of people |
Mode 4 |
Discriminatory qualification or licensing requirements |
|||
|
NT3 |
Discriminatory measures with regard to subsidies or taxes |
Modes 1, 2, 3 |
Eligibility for subsidies reserved for nationals Tax imposed on nonresidents |
|||
|
NT4 |
Restrictions on ownership of property and land |
Modes 1, 2, 3 |
Foreigners not allowed to acquire direct ownership of land Nonresidents excluded from the acquisition of real estate |
|||
|
NT5 |
Other discriminatory measures |
Modes 1, 2, 3 |
Discriminatory measures with respect to competition Prohibition on the hiring of local professionals Local content requirements Technology transfer and training requirements |
|||
|
Source: Authors. |
||||||
|
a W/120 = General Agreement on Trade in Services, services sectoral classification list. |
||||||
There is some inherent subjectivity in ranking and weighting the importance of trade-restrictive measures, and it is beyond the scope of this chapter to discuss how those calculations can be done. Table 12-2 summarizes our own subjective assessment and details the scores for each mode of supply (the points that are lost out of a total of 100 when the subsector is unbound or partial). We note that no commitment at all (unbound) does not give a score of zero for a given subsector and mode of supply but 20 (out of 100). “Unbound” means that there is no commitment in the RTA to provide market access and national treatment, but this should not be understood to mean that trade is banned. It could be the case that no restrictive measure is actually in place in the country.

Since we work with data on cross-border trade in services, we assign Mode 1 a much larger weight (70 percent) than the other modes (10 percent for each). Yet we choose not to give a zero weight to Modes 3 and 4 to account for the potential complementarities that may exist between modes of supply. Mode 2 is also part of cross-border trade but is economically less important and rather difficult to restrict. We are now left with a score ranging between 0 and 100 for each agreement, country, and subsector. The next step is to compute for each RTA the difference between the agreement’s score and the GATS score. This difference therefore takes on values from −100 to 100. Because an agreement that is worse than GATS (i.e., GATS minus) is de facto ineffective, we replace all negative values with zeros, which means there is no preferential treatment. The higher the value of the index, the more preferential the RTA for a given country and subsector.
Last, we convert W/120 subsectors into ISIC Revision 3 sectors using the UN’s Provisional Central Product Classification as an intermediate correspondence. Since W/120 subsectors and ISIC Revision 3 sectors do not match one-to-one, we average the RTA index when needed using equal weights. Eventually, we get an index of the preferential content of RTAs for each party to an agreement that is compatible with our trade costs data at the sector level.
TRADE COSTS AND REGIONAL TRADE AGREEMENTS: STYLIZED FACTS
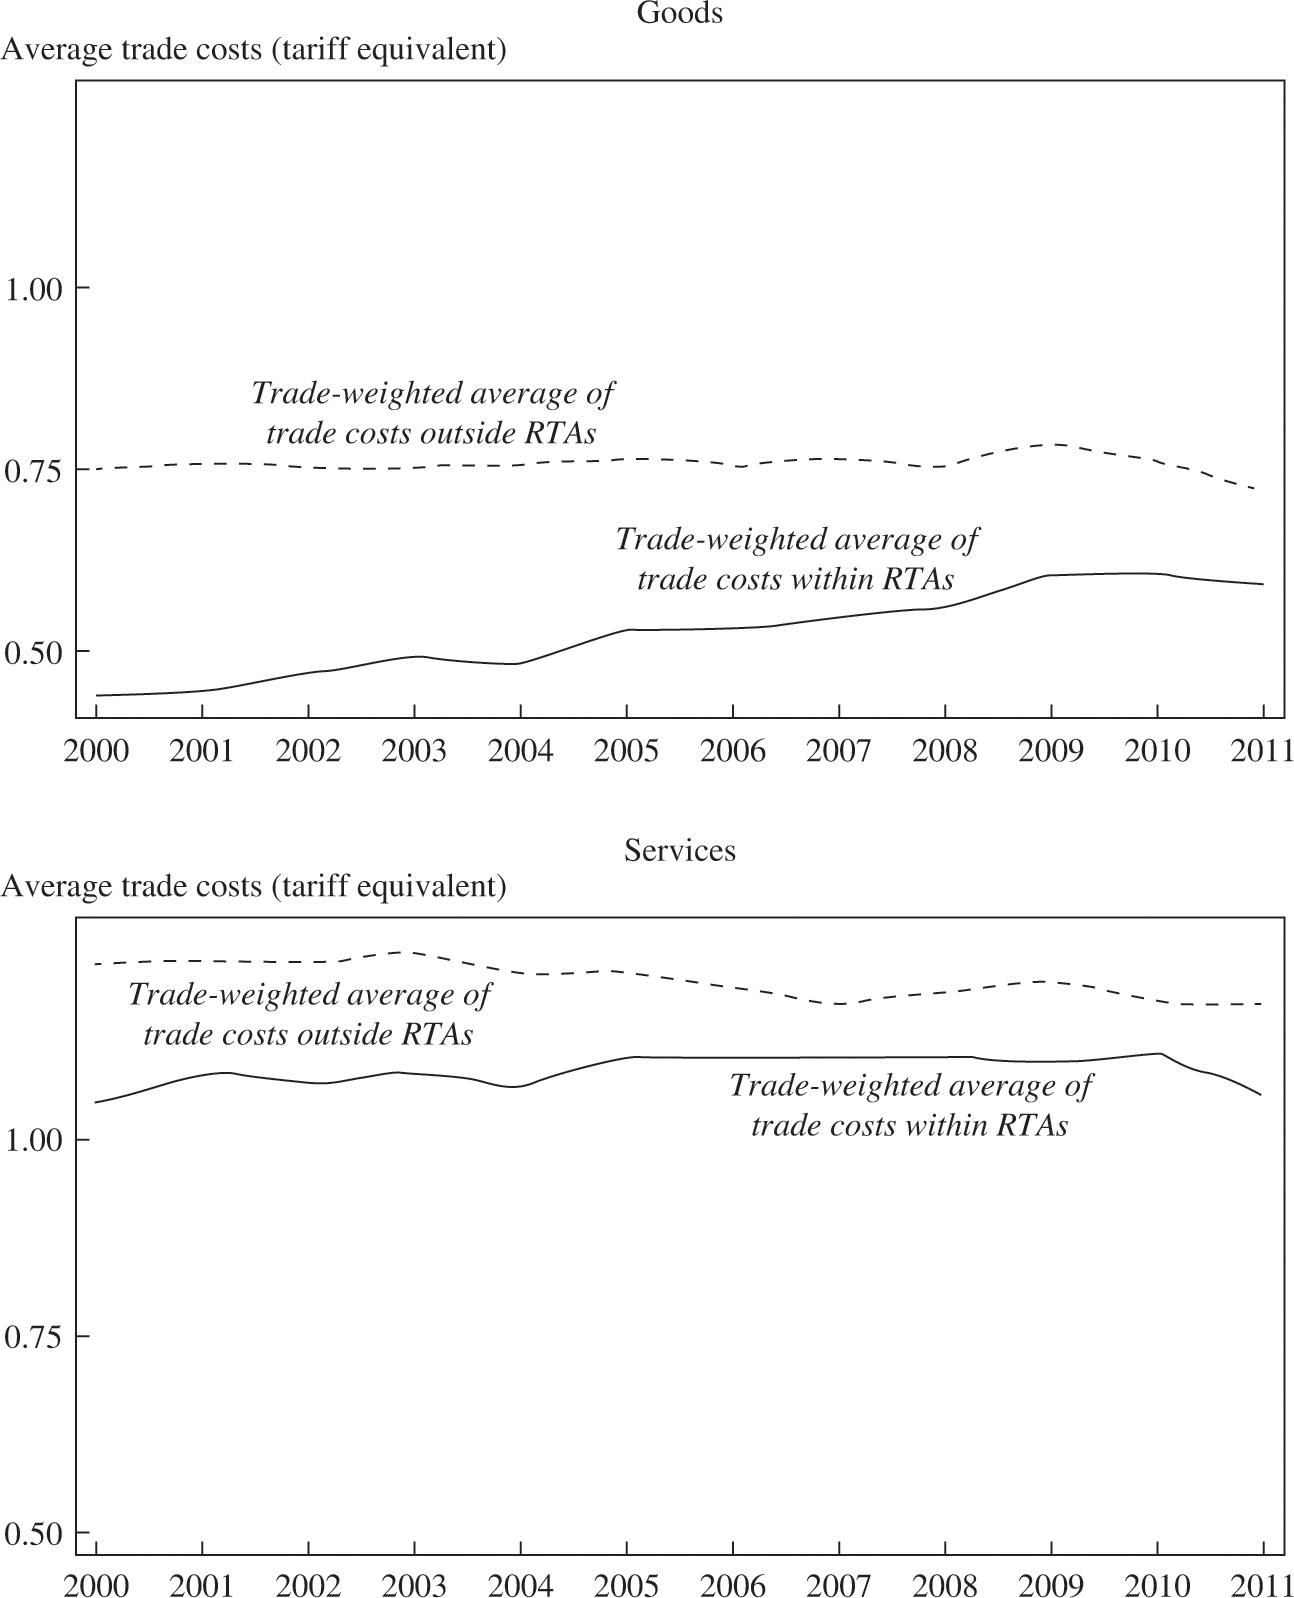
Our data set provides bilateral trade costs at the industry level. To compare the average trade costs within and outside RTAs, we use a trade-weighted average across countries. Trade costs for goods within RTAs are the average bilateral trade costs in manufacturing industries of countries that are party to an RTA covering goods. Trade costs for services are measured within RTAs that have provisions on services (a smaller subset of the RTAs covering goods). In addition, we keep only pairs of countries for which we have consistent data over time (between 2000 and 2011). Figure 12-2 highlights the important difference between goods trade and services trade in RTAs. Trade costs for goods are significantly lower within RTAs. The difference tends to narrow over time, but trade costs in 2011 were still 22 percent lower in RTAs. Trade costs were on average higher for services than for goods. Tariff equivalents, whether within or outside RTAs, are always between 100 and 125 percent. Moreover, there was no major difference between trade costs measured within RTAs and between countries that were not part of a services trade agreement. In 2011, trade costs for services were on average 10 percent lower within RTAs. Goods RTAs are therefore associated with a difference in trade costs of about twice as much as services RTAs.
The increase in trade costs over the period (both for goods and services) is partly a composition effect. The group of countries with an RTA at the end of the period have a relatively higher level of trade costs. One could explain this by the fact that countries initially signed RTAs with their main trading partners, which are closer geographically as well as culturally and institutionally. It is therefore not surprising to see a decrease in the discrepancy between trade costs within and outside RTAs. But the results for services suggest that services agreements are of a different nature than goods agreements.
FIGURE 12-2. Trade Costs Within and Outside Regional Trade Agreements (RTAs): Goods and Services, 2000–2011
Source: Authors’ calculations.
To further assess to what extent figure 12-2 reflects the composition of the group of countries having signed an RTA or the evolution of trade costs within these RTAs, figure 12-3 gives an average bilateral trade cost before and after the entry into force of the RTA. We set to t = 0 the year of entry into force of each agreement, and we report the average trade costs (over all the RTAs) up to five years before and after this date. As trade costs are to some extent cyclical and vary over time, pulling different years together introduces some volatility, but the results suggest that for both goods and services RTAs contribute to a decrease in trade costs. Of course, these descriptive data do not say anything about causality, but suggest more of a composition effect.
FIGURE 12-3. Trade Costs Five Years before and after the Entry into Force of a Regional Trade Agreement

Source: Authors’ calculations.
Last, in figure 12-4 we present results for the European Union. We have separately calculated average bilateral trade costs among EU members and in EU RTAs (i.e., between EU members and countries with which the EU has signed an RTA). We also include in the figure the average trade costs for non-EU RTAs (i.e., other RTAs to which EU countries are not a party). One reason for focusing on the EU is that EU countries have among themselves the deepest level of integration for services industries. There are more than 500 European Commission (EC) regulations dealing with services in the EU, and the objective of creating an effective internal market in services has been a priority since the adoption of the Single Market Act in 1992 (Messerlin 2012). Moreover, a large share of observations in our data set are for EU countries, and it is interesting to see how including or excluding EU countries in the analysis affects the results.
FIGURE 12-4. Trade Costs within and outside Regional Trade Agreements (RTAs): European Union, 2000–2011

Source: Authors’ calculations.
The surprise in figure 12-4 is that, after 2002, we measure higher trade costs among EU countries than in the RTAs signed by the EU or in other non-EU RTAs, although there is some convergence toward the end of the sample period. We investigate in more detail in the next section what could drive these results, but figure 12-4 is not at odds with the gravity literature that finds that an EU dummy variable usually has a negative sign (indicating that EU countries trade a lower volume of services than is predicted by the gravity model). Whether or not one believes the data, there is the question of why services RTAs are not clearly associated with lower trade costs.
WHY ARE SERVICES TRADE COSTS NOT LOWER WITHIN REGIONAL TRADE AGREEMENTS?
Anybody working in the area of services trade knows that cross-border trade statistics at a disaggregated level (by partner country or by industry) are problematic. To begin with, the coverage of balance of payments trade data is not comprehensive. While total trade in services is available for most economies, trade by partner country or by industry is missing for a significant number of reporters. In addition, for countries that do provide the disaggregated data, there is still a large share of unallocated trade (Miroudot and Lanz 2008; Spinelli and Miroudot 2015). For example, in the OECD TISP database, adding all the bilateral-by-industry data gives a figure that represents, on average, 70 percent of the total trade reported by countries. Almost one-third of trade in services is not allocated to specific partners or industries.
In addition to unallocated trade, one can question what the balance of payments measures precisely. With the development of the internet and new technologies, many services transactions are difficult to account for. Measuring trade in services is more challenging than before, and one should not underestimate the impact of these issues on the results of our study and any measure of trade costs based on actual trade data. But the quality of the data cannot by itself explain the trend observed over time, since the there is no sign of a systematic bias that would minimize international trade in services over years only for countries within an RTA (and not for pairs of countries not belonging to any RTA). Issues related to statistics affect all economies within or outside RTAs. The only case where we should seriously investigate the role of statistical issues is the EU. Because of the European integration process, there is less information available on intra-EU trade than on extra-EU trade.
More important, it seems to us, is the question of whether covering only cross-border trade in services has an impact on our assessment of regionalism. Cross-border trade in services includes Mode 1 and to some extent Mode 2 and Mode 4 trade in services. But with some rare exceptions, Mode 3 trade in services is not part of the cross-border trade statistics.8 To the extent that RTAs encourage Mode 3 over cross-border trade (in particular when they include an investment chapter that also liberalizes foreign direct investment), a substitution between cross-border trade and sales through commercial presence could explain why we do not see a significant impact of RTAs on cross-border trade costs.
FIGURE 12-5. Foreign Affiliate Sales (FAS) Costs within and outside the European Union, 2001–2006
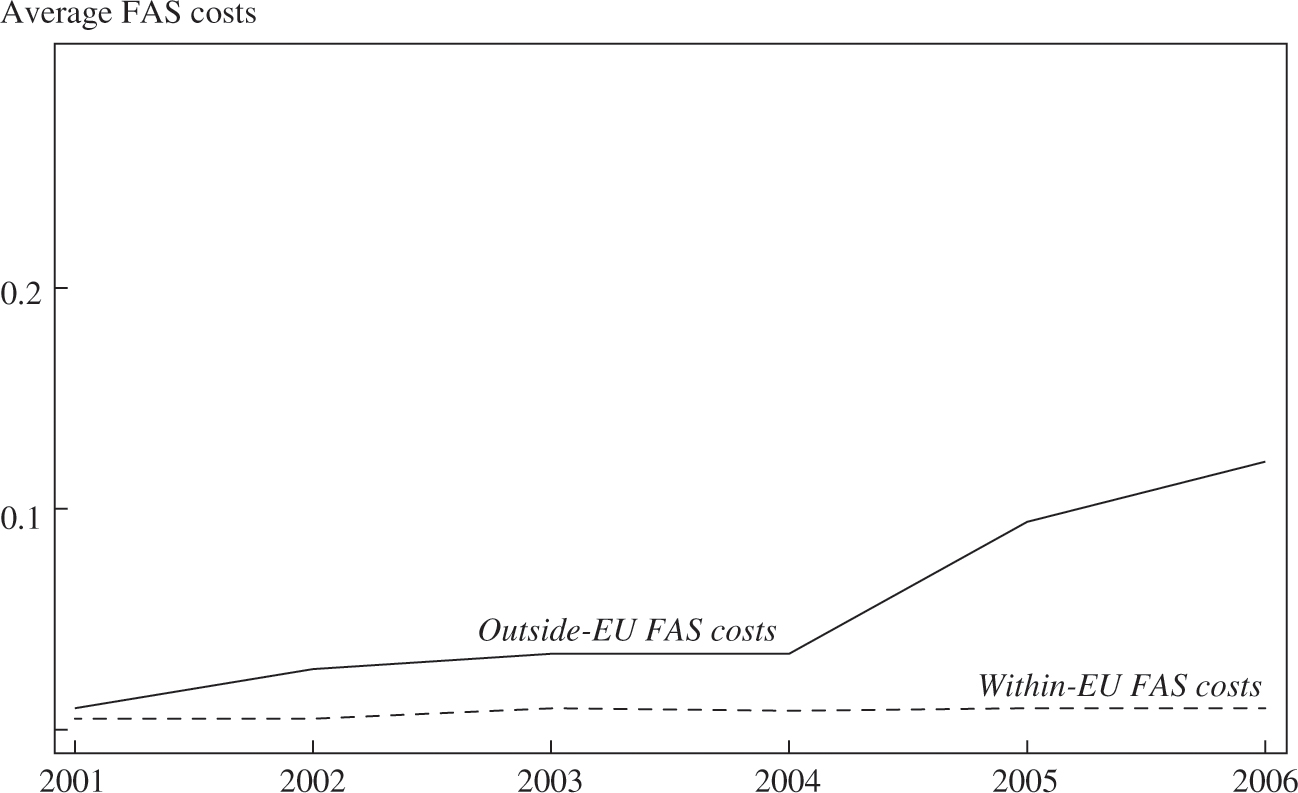
Source: Authors’ calculations.
Unfortunately, data on sales of foreign affiliates are even less available than cross-border trade in services data. We can however apply a methodology similar to the one we apply to cross-border trade to measure the bilateral “investment costs,” or more exactly, the cost of selling through a foreign affiliate, the foreign affiliate sales (FAS) cost. Building on Head and Ries (2008), Gormsen (2011) has developed a measure of the cost of barriers to foreign direct investment (FDI). We can apply a similar methodology to sales of foreign affiliates, as the formula is at the end a derivation of the gravity equation and the gravity equation applies to FAS as well (see Bergstrand and Egger 2007; Kleinert and Toubal 2010).
We calculate the bilateral FAS cost as:  where sales from i in j and j in i are bilateral FAS, while the sales of i in i (and j in j) are the domestic sales (calculated as the national turnover minus the sales of foreign affiliates).
Deriving the equation from a theory-consistent FAS gravity model, there should be a parameter similar to σ in the Anderson and van Wincoop (2003) model or γ in the Chaney (2008) model. Here we take a very simple approach to comparing FAS costs over time in the context of EU integration, so we abstract from this issue that could be explored in future research.
Due to constraints on the availability of such data, we calculate these bilateral FAS costs for fifty-four countries over the period 2001–2006. Figure 12-5 presents the average FAS cost intra- and extra-EU. Since there are very few non-EU countries in the data set, one should not overinterpret the results, and generally speaking FAS statistics are quite fragmentary. But the point is that for EU countries for which we have relatively better FAS data, there is no indication that FAS costs diminished within the EU in the first half of the 2000s. However, FAS costs are found to be lower within the EU, and the discrepancy between intra- and extra-EU FAS costs increases over time. This increase is likely to reflect the greater availability of data over time, and because of the gaps in the data there are more and more non-EU pairs after 2004.
We can thus offer a more nuanced picture regarding the impact of RTAs. In the case of the EU, there seems to be an impact on the cost of providing services through Mode 3. But we have insufficient data to check whether this is specific to the EU and the deep integration achieved through the single market or whether a similar trend would be observed in all RTAs that cover Mode 3 or have a substantive investment chapter.
Services Reforms: Do They Benefit Domestic and Foreign Producers in a Similar Way?
In our analysis, we define trade costs as the costs foreign suppliers pay that domestic producers do not. Equation 1 relates “domestic trade costs” to international trade costs. Because the measure is relative, a reform that would have the same (or a proportional) impact on domestic and foreign suppliers would not affect trade cost estimates. Another way of interpreting figure 12-2 is that any services trade liberalization (resulting from an RTA or not) lowers trade costs for all suppliers and so does not change the ratio between foreign and domestic costs.
This would be the case, first, if RTAs had no impact on the actual trade regime. Schedules of commitments in services are legal bindings. Countries make market access and national treatment commitments, but often these commitments just reflect the current state of regulations. At the multilateral level, the literature already points out that countries have locked in their current regime and not used GATS to liberalize trade (Hoekman 1996; Adlung and Roy 2005). It is even less likely that they would use RTAs to open up new services sectors. Reforming the telecommunications sector or changing regulations for maritime transport will generally not be the outcome of a bilateral trade agreement. The political economy of services trade negotiations, involving a trade ministry that is usually not in a position to commit to reforming key product markets, could explain why RTAs are about legal bindings and not actual trade reforms (VanGrasstek 2010). Such bindings could nonetheless have a positive impact on trade by reducing the uncertainty around the trade regime and by bounding the level of restrictiveness the partner country could introduce in the future.
Another assumption is that, when they do change the trade regime, RTAs have no impact on measures that discriminate against foreign suppliers. The concept of preferences is not easy to tackle in the context of services trade (Sauvé and Mattoo 2011; Sauvé and Shingal 2011). Some measures do not typically discriminate between domestic and foreign suppliers. For example, market regulations introducing rules on prices, providing access to networks, or increasing the powers of a competition authority will benefit domestic and foreign services suppliers equally. In order to create a market that is more competitive for domestic suppliers only, foreign suppliers would have to be excluded from this market. Also, by introducing measures such as licenses or taxes, it would be technically feasible to discriminate between domestic and foreign producers, but in practice this has not happened. In the end, discriminatory measures are limited to foreign equity restrictions, labor market tests for the entry of natural persons, and the recognition of qualifications. But even in these areas, not all countries introduce discriminatory measures.
The trend in services reforms is also to increase competition, including by allowing foreign producers to enter the domestic market and compete. Countries that have reformed their telecommunications or energy sectors, for example, have generally encouraged the entry of foreign firms to increase productivity and lower prices for consumers. In the presence of an incumbent firm that previously benefited from a domestic monopoly, foreign competition is important for the market to become competitive. Because most services reforms are not discriminatory, negotiators of RTAs have few opportunities to offer genuine preferences to partner countries.
Is Services Trade Liberalization de Facto MFN Treatment?
For the same reasons stated previously, there is no clear evidence that discrimination among foreign producers is the objective or outcome of services RTAs. Unlike tariffs on goods, which are easy to apply, there is no easy way to grant preferences to services providers in specific countries—in effect, most favored nation (MFN) treatment. Market access barriers and barriers to competition apply in the same way to all foreign suppliers. In the case of the recognition of qualifications or visa policies, some advantage may be given to a privileged partner country. For example, a mutual recognition agreement can be signed or a quota can be granted to temporary services providers of a given nationality. But in practice, there are very few instances where countries discriminate in this way.
Once again, one should keep in mind that services are usually regulated in domestic laws that are designed for domestic purposes by the ministries in charge of specific services sectors. Such laws are not used for commercial diplomacy and do not include legal instruments that allow trade negotiators to grant preferences to specific countries. This is why services RTAs are most of the time about “preferential bindings” rather than actual preferences.
Another reason is that rules of origin for services are quite liberal in the case of legal persons (Fink and Nikomborirak 2007; Miroudot, Sauvage, and Sudreau 2010). GATS Article V(6) requires that foreign services suppliers established in a country and engaged in “substantive business operations” benefit from the treatment granted in RTAs signed by that country. For example, EU companies established in the United States benefit from NAFTA/USMCA provisions and have the same treatment as US companies exporting services to Mexico or Canada. The “substantive business operations” criterion is not normally subject to specific tests or requirements.9 This could explain why countries are not willing to introduce discriminatory barriers to cross-border trade in services. Such barriers could be circumvented by the establishment of companies in countries that would provide the most preferential treatment.
This being said, we observe in our data set differences in trade costs by partner country. Figure 12-6 highlights differences based on the architecture of RTAs and the way of scheduling commitments. Trade costs tend to be lower between countries that have signed a NAFTA-inspired RTA where there is a negative list of commitments and where services and investment (including investment in services) are dealt with in two separate chapters.10 GATS-inspired RTAs that follow the GATS approach for scheduling commitments (a positive list of subsectors where market access and national treatment commitments are made by mode of supply, followed by a list of limitations) have higher trade costs on average, even higher than for pairs of countries with no RTA.
FIGURE 12-6. Trade Costs by Type of Scheduling, 2000–2011

Source: Authors’ calculations.
However, figure 12-6 should not be interpreted as showing a causal relationship between the way of scheduling commitments and the level of trade costs. The results are essentially based on the composition of each group of countries whose trade costs are being measured. Trade costs are the lowest (at the end of the 2000–2011 period) in the group of “other RTAs” that includes economic integration agreements, such as the EC Treaty, the European Economic Area (EEA) agreement, the agreement of the European Free Trade Association (EFTA), and the Australia-New Zealand Closer Economic Partnership Trade Agreement (ANZCEPTA). By definition, parties to these agreements are geographically and culturally closer, hence their lower bilateral trade costs. NAFTA-inspired agreements were originally signed between close countries (initially Canada, Mexico, and the United States), and over the period trade costs are found to be higher when the NAFTA template is used by other countries. GATS-inspired agreements include many North-South and South-South RTAs signed between countries that are geographically or culturally more distant and where services trade is less developed.
CONCLUSION
This chapter investigates whether services RTAs have an impact on bilateral trade costs. In the case of services, there is no clear evidence that trade costs are much lower within RTAs than outside. This is not a surprising result when one looks more closely at how services trade liberalization takes place and what the role of services chapters in RTAs is. Services agreements are about preferential bindings but generally do not include preferential treatment of the parties to the agreement. As such, services RTAs are to some extent paradoxical. They signal a preference for specific partner countries, but they do not provide them with preferential treatment, unlike RTAs for goods. From an economic perspective, this is all the better, as preferences lead to trade distortions.
Do our results mean that RTAs have no economic impact and do not affect trade costs? Further research on this question is required, including the specification of a full econometric model explaining observed trade costs, including membership in an RTA. Preliminary findings based on graphical analysis and descriptive statistics suggest, however, that RTAs might lower trade costs, although not to a striking degree, but the costs are lower not only for the parties to the agreement but also for other parties. This could be explained by the liberal rules of origin that extend the benefits of market access and national treatment commitments beyond parties, or more simply by the unilateral and de facto MFN nature of services trade liberalization. Most reforms in services sectors are driven by domestic concerns and adopted independently of any trade negotiation. RTAs bind these reforms, and their provisions reflect the more recent state of the law and new regimes that are more favorable for foreign suppliers. Our results are consistent with this interpretation of services RTAs.
APPENDIX: LIST OF SERVICES AGREEMENTS COVERED IN THE DATA SET
ASEAN-Australia-New Zealand Free Trade Agreement (FTA)
ASEAN-China FTA
ASEAN-Korea FTA
Australia-Chile FTA
Australia-New Zealand Closer Economic Relations (CER)
Dominican Republic-Central American FTA (CAFTA-DR)
Canada-Chile FTA
Canada-Peru FTA
Chile-Colombia FTA
Chile-Costa Rica FTA
Chile-El Salvador FTA
Chile-Mexico FTA
China-Chile FTA
China-New Zealand FTA
China-Pakistan FTA
China-Peru FTA
China-Singapore FTA
Costa Rica-Mexico FTA
European Economic Area (EEA)
European Free Trade Association (EFTA)-Chile FTA
EFTA-Korea FTA
EFTA-Mexico FTA
EFTA-Singapore FTA
El Salvador-Mexico FTA
European Union (EU)-Albania Stabilization and Association Agreement (SAA)
EU-Caribbean Forum (CARIFORUM) States Economic Partnership Agreement (EPA)
EU-Chile Association Agreement (AA)
EU-Croatia SAA
EU-FYROM SAA
EU-Korea FTA
EU-Mexico EPA
EU-Montenegro SAA
Guatemala-Mexico FTA
Honduras-Mexico FTA
India-Korea Comprehensive Economic Partnership Agreement (CEPA)
India-Singapore Comprehensive Economic Cooperation Agreement (CECA)
Japan-Brunei Darussalam EPA
Japan-Chile EPA
Japan-Indonesia EPA
Japan-Malaysia EPA
Japan-Mexico EPA
Japan-Philippines EPA
Japan-Singapore EPA
Japan-Switzerland EPA
Japan-Thailand EPA
Japan-Vietnam, EPA
Korea-Chile FTA
Korea-Singapore FTA
Mainland and Hong Kong CEPA
Mainland and Macao CEPA
Mexico-Nicaragua FTA
North American Free Trade Agreement (NAFTA)
New Zealand-Hong Kong, China CEP
New Zealand-Singapore CEP
Panama-Chile FTA
Singapore-Australia FTA
Thailand-Australia FTA
Trans-Pacific Strategic Economic Partnership (SEP)
US-Australia FTA
US-Bahrain FTA
US-Chile FTA
US-Jordan FTA
US-Morocco FTA
US-Oman FTA
US-Peru TPA
US-Singapore FTA
NOTES
The authors are writing in a strictly personal capacity. The views expressed are theirs only, and do not reflect in any way those of the OECD Secretariat or the member countries of the OECD. The authors are grateful to the Groupe d’Economie Mondiale at Sciences Po for supporting this research, and to Patrick A. Messerlin for many helpful discussions and comments. The analysis of services commitments in regional trade agreements was carried out with the help of Jehan Sauvage and Marie Sudreau.
1. A note on terminology: we refer to “regional trade agreements” rather than “preferential trade agreements” or “free trade agreements,” because the expression seems to us more neutral. Of course, it could be pointed out that most agreements are “bilateral” rather than “regional.” But trade agreements in the case of services are not always “preferential” and never lead to “free trade.” Switching to PTAs or FTAs does not improve the accuracy of the terminology.
2. Some studies have also uncovered the phenomenon of GATS-minus commitments. See Adlung and Miroudot (2012).
3. In fact, Novy (2011) shows that basically the same measure can be derived from a wide variety of theoretical models of international trade, including those of Chaney (2008) and Eaton and Kortum (2002). The interpretation of some parameters changes depending on the model used, but the overall approach remains very similar. Novy’s approach builds on Head and Ries (2001).
4. Later in the chapter we report results for sales of foreign affiliates based on a small sample of countries for which data are available. We also indicate how bilateral “Mode 3 trade costs” could be calculated with an approach similar to Novy (2011).
5. We have both gross output and exports at the industry level in this set of I-O tables, the two variables needed to calculate domestic trade.
6. See Spinelli and Miroudot (2015) for detailed information on the creation of these services trade statistics.
7. The full list of RTAs included is given in Appendix 12-1.
8. For example, in the case of construction services, balance of payments data cover to some extent short-term contracts where there is commercial presence in the sense of GATS but no establishment (the foreign company operates in the territory of the partner country on the basis of a local office and remains a nonresident entity whose revenues are regarded as an international transaction recorded in the balance of payments). Construction services data sometimes include the cost of construction materials, which are goods, further complicating the issue of accurately measuring the services trade involved.
9. An exception is found in the agreements signed by China with Hong Kong and Macao (see Emch 2006).
10. See Houde, Kolse-Patil, and Miroudot (2007) for a more detailed comparison of NAFTA-inspired and GATS-inspired regional trade agreements.
REFERENCES
- Adlung, R., and S. Miroudot. 2012. Poison in the Wine? Tracing GATS-Minus Commitments in Regional Trade Agreements. Journal of World Trade 46 (5): 1045–82.
- Adlung, R., and M. Roy. 2005. Turning Hills into Mountains? Current Commitments under the General Agreement on Trade in Services and Prospects for Change. Journal of World Trade 39 (6): 1161–94.
- Anderson, J. E., and E. van Wincoop. 2003. Gravity with Gravitas: A Solution to the Border Puzzle. American Economic Review 93 (1): 170–92.
- Bergstrand, J., and P. Egger. 2007. A Knowledge-and-Physical-Capital Model of International Trade Flows, Foreign Direct Investment, and Multinational Enterprises. Journal of International Economics 73 (2): 278–308.
- Chaney, T. 2008. “Distorted Gravity: The Intensive and Extensive Margins of International Trade.” American Economic Review 98 (4): 1707–21.
- Chauffour, J.-P., and J.-C Maur, eds. 2011. Preferential Trade Agreement Policies for Development. A Handbook. Washington, D.C.: World Bank.
- Eaton, J., and S. Kortum. 2002. “Technology, Geography, and Trade.” Econometrica 70 (5): 1741–79.
- Emch, A. 2006. “Services Regionalism in the WTO: China’s Trade Agreements with Hong Kong and Macao in Light of Article V(6) of GATS.” Legal Issues of Economic Integration 4 (33): 351–78.
- Fink, C., and M. Molinuevo. 2008. “East Asian Preferential Trade Agreements in Services: Liberalisation Content and WTO Rules. World Trade Review 7 (4): 641–73.
- Fink, C., and D. Nikomborirak. 2007. “Rules of Origin in Services: A Case Study of Five ASEAN Countries.” Policy Research Working Paper 4130. Washington, D.C.: World Bank.
- Gormsen, C. 2011. “The Declining Barriers to Foreign Direct Investment and How to See Them.” Mimeo, January.
- Head, K., and J. Ries. 2001. “Increasing Returns versus National Product Differentiation as an Explanation for the Pattern of U.S.-Canada Trade.” American Economic Review 91 (4): 858–76.
- ________. 2008. “FDI as an Outcome of the Market for Corporate Control: Theory and Evidence. Journal of International Economics 74 (1): 2–20.
- Hoekman, B. 1996. “Assessing the General Agreement on Trade in Services.” In The Uruguay Round and the Developing Countries, edited by W. Martin and L. A. Winters, 88–124. Cambridge University Press.
- Houde, M.-F., A. Kolse-Patil, and S. Miroudot. 2007. “The Interaction between Investment and Services Chapters in Selected Regional Trade Agreements. OECD Trade Policy Working Paper 55. Paris: OECD Publishing.
- Kleinert, J., and R. Toubal. 2010. “Gravity for FDI.” Review of International Economics 18 (1): 1–13.
- Marchetti, J. A., and M. Roy. 2008. “Services Liberalization in the WTO and in PTAs. In Opening Markets for Trade in Services. Countries and Sectors in Bilateral and WTO Negotiations, edited by J. A. Marchetti and M. Roy, 61–112. Cambridge University Press.
- Messerlin, P. A. 2012. “The European Community Trade Policy.” In The Oxford Handbook of International Commercial Policy, edited by M. E. Kreinin and M. G. Plummer. Oxford University Press.
- Miroudot, S., and R. Lanz. 2008. “Measuring Bilateral Trade in Services: A Note on the Data Collected and Estimated for the Services Trade Restrictiveness Index.” Tech. Rep. TAD/TC/SXM(2008)2. Paris: OECD.
- Miroudot, S., J. Sauvage, and B. Shepherd. 2012. “Trade Costs and Productivity in Services Sectors. Economics Letters 114 (1): 36–38.
- Miroudot, S., J. Sauvage, and M. Sudreau. 2010. “Multilateralising Regionalism: How Preferential Are Services Commitments in Regional Trade Agreements?” OECD Trade Policy Working Paper 106. Paris: OECD Publishing.
- Novy, D. 2011. “Gravity Redux: Measuring International Trade Costs with Panel Data.” CESifo Working Paper 3616. Munich: CESifo Group.
- Pomfret, R., and P. Sourdin. 2009. “Have Asian Trade Agreements Reduced Trade Costs? Journal of Asian Economics 20 (3): 255–68.
- Sauvé, P., and A. Mattoo. 2011. “Services.” In Preferential Trade Agreement Policies for Development. A Handbook Edited by J.-P. Chauffour and J.-C. Maur, eds., 235–74. Washington, D.C.: World Bank.
- Sauvé, P., and A. Shingal. 2011. “Reflections on the Preferential Liberalization of Services Trade.” Journal of World Trade 45 (5): 953–63.
- Spinelli, F., and S. Miroudot. 2015. “Estimating Bilateral Trade in Services by Industry—The EBTSI Data Set.” Tech. Rep. Paris: OECD. October.
- VanGrasstek, C. 2010. “The Political Economy of Services in Regional Trade Agreements.” OECD Trade Policy Working Paper 112. Paris: OECD Publishing.
- Walsh, K. 2006. “Trade in Services: Does Gravity Hold? A Gravity Model Approach to Estimating Barriers to Services Trade. Discussion Paper Series 183. Institute for International Integration Studies, Trinity College Dublin.
- World Trade Organization (WTO). 2011. “The WTO and Preferential Trade Agreements: From Co-existence to Coherence.” World Trade Report 2011 Geneva: World Trade Organization.