A Critique of Research Methods and Instruments
In this chapter research relating to school mathematics is used as an instance to critique commonly used methods and instruments employed in educational research to determine performance and single or multiple aspects of affect. Advances in technology that have enabled the adaption of previously used instruments are described. Self-report measures, administered face-to-face and on-line, and real-time and virtual observational methods are discussed in some detail. Illustrative data from specific studies are provided. Interpreting the different measurement outcomes is, it is argued, far from unproblematic. This discussion raises issues relevant to research in a range of paradigms but is particularly pertinent to educational research conducted in the neo-positivist paradigm.
INTRODUCTION: SETTING THE CONTEXT
Researchers in the social sciences operating in the neo-positivist paradigm work from an ontological and axiological understanding of discoverable reality relating to an aspect of human behavior or at least of the possibility of discovering, confirming or contesting particular patterns and consistencies in behavior. To do so requires data collection methods and instruments, along with forms of data analysis, that are capable of revealing such patterns and consistencies. When it comes to researching aspects of education, as the discussion of research methods and instruments in this chapter demonstrates, observation and measurement of patterns and consistencies can be problematic, even when the subject area that pertains to the investigation is mathematics.
Mathematics is generally recognized as a critical component of the school curriculum. Its dominant place was freshly reaffirmed by Donnelly and Wilstshire (2014) in their influential Review of the Australian curriculum. Internationally, endorsement was further provided by the Organisation for Economic Co-operation and Development [OECD], which emphasized: “Being able to read, understand and respond appropriately to numerical and mathematical information are skills that are essential for full social and economic participation” (OECD, 2013, p. 98).
Data from large scale international comparative surveys such as the Programme for International Student Assessment [PISA] and the Trends in International Mathematics and Science Study [TIMSS] are popularly used as valid indicators of student progress. They offer a gross measure of group performance but do not provide a carefully nuanced marker of an individual’s level of attainment. For the latter, different instruments are needed.
A test’s most important characteristic, according to Nichols and Berliner (2007), is its validity—a multi-dimensional construct. The validity of a test is described most comprehensively, they argued, in terms of four measures, the 4Cs. These are content validity: that is, whether the test measures what it is intended to measure; construct validity: whether the test actually measures the concept or attributes it is supposed to measure; criterion validity: whether the test predicts certain kinds of current or future achievement; and consequential validity: the consequences and decisions that are associated with test scores. There is general agreement in the test measurement literature about the importance and relevance of the first three measures in particular but Popham’s (1997, p. 13) admonition that the “social consequences of test use should be addressed by test developers and test users” is still not universally adopted. Some possibilities for pursuing this in the case of mathematics education are explored in this chapter.
To facilitate a functional discussion of students’ academic progress both within and across countries, reference is often made to the three components of the curriculum promulgated by the International Association for the Evaluation of Educational Achievement [IEA] (see e.g., Mullis, Martin, & Foy, 2008). These comprise the intended curriculum (the curriculum mandated or favored in a particular country or setting), the implemented curriculum (the curriculum actually taught), and the attained curriculum (the outcomes of schooling—what students appear to have learnt). Yet to what mathematics students are actually exposed can be tainted, and potentially expanded or constrained, at each of the model’s three levels. External influences, local expertise, and individual preferences can mold or change what students essentially experience. As is fiercely argued by Berliner (2011), all too often overlooked are the inevitable limitations of results reported from large scale examinations because of, for example, contextual data that were not reported, participants’ social class and associated advantages or disadvantages, or aspects of the curriculum considered beyond the scope of the test including material that cannot be assessed through a paper-and-pencil instrument. Thus what is given as the student’s achievement score in mathematics is realistically influenced, at least in part, by previous exposure to the content on which they are tested and how well that content aligns with material actually covered. This constraint applies not just to large scale tests but also to smaller, locally designed, and supposedly strategically targeted instruments.
That the format of assessment is certainly a possible factor that may confound the determination of students’ mathematics ability is illustrated, provocatively, by the following example which foregrounds the case of gender. The data are based on results from the Victorian (Australia) Year 12 examination—the final year of secondary school—for the years 1994-1999. Three subjects were available to students in mathematics: Further Mathematics (the least difficult option); Mathematical Methods (more challenging content); and Specialist Mathematics (the most challenging of the three subjects). In each of the three mathematics subjects all enrolled students were required to complete three distinct Common Assessment Tasks [CATs]. These were: CAT 1, an investigative project or challenging problem completed during school time and at home, over an extended period of several weeks; CAT 2, a strictly timed examination comprising multiple choice and short answer questions; and CAT 3, also a strictly timed examination paper but with problems which required extended answers. In contrast to the (then) innovative CAT 1, CATs 2 and 3 followed the format of traditional school-based timed examinations.
Cox, Leder, and Forgasz (2004) capitalized on the introduction of the varied examination tasks in the mathematics subjects to examine whether the different test formats in the high stakes Year 12 examination ostensibly affected the mean performance of boys and girls. Leder (2015) reported their findings as follows:
Whether as a group males or females could be considered to be “better” at mathematics depends on which subject or which test component is highlighted. If the least challenging and most popular mathematics subject, Further Mathematics, is referenced then the answer is females. If for all three mathematics subjects the focus is confined to the CAT 1 component, the investigative project or problem assessment task, done partly at school and partly at home, then again the answer is females. But if the focus is on the high stake Mathematical Methods subject, the subject which often serves as a prerequisite for tertiary courses, and on the traditional examination formats of CAT 2 and CAT 3 in that subject, then the answer is males. Collectively these data illustrate that the form of assessment employed can influence which group, males or females, will have the higher mean performance score in mathematics. (Leder, 2015, pp. 197-198)
Although the source on which these conclusions are based is somewhat dated, the unique circumstances which enabled the performance on the different tasks to be gathered, and the still prevalent usage of the different assessment approaches described warrant continued attention to these findings. They illustrate the impact of a test’s content and demands on the perception of a group’s mathematical “ability” and on the validity of the (mathematics) score gained by individual students within these group. The potential social consequences of the test results, which either challenge or confirm gender differences in mathematics achievement depending on the mathematics subject and CAT data reported, and reminiscent of Nichols and Berliner’s (2007) fourth C of validity, should not be overlooked. While there is ready access to instruments which allow a student’s height or weight, for example, to be measured with a great degree of accuracy, there are no comparable tools to describe a student’s cognitive, or affective attributes, with the same degree of accuracy.
That not only cognitive but also affective factors influence students’ learning of mathematics is widely recognized. Data gathered as part of the internationally administered Programme for International Student Assessment [PISA] provided robust evidence that:
Individuals’ attitudes, beliefs and emotions play a significant role in their interest and response to mathematics in general, and their employment of mathematics in their individual lives. Students who feel more confident with mathematics, for example, are more likely than others to use mathematics in the various contexts that they encounter. Students who have positive emotions towards mathematics are in a position to learn mathematics better than students who feel anxiety towards that subject. Therefore, one goal of mathematics education is for students to develop attitudes, beliefs and emotions that make them more likely to successfully use the mathematics they know, and to learn more mathematics, for personal and social benefit. (OECD, 2013, p. 42)
Thus affective descriptors such as attitudes, beliefs, emotions, confidence, and anxiety, embedded in the excerpt above, are all considered as possible facilitators or inhibitors of mathematics performance. How can these factors, collectively or separately, be tapped most effectively? That assessing students’ mathematics learning per se is not unproblematic was illustrated above. How might the more elusive concept “affect” be tapped and captured effectively? The focus of the remainder of this chapter is primarily on this challenging topic.
Affect: A Question of Terminology?
In an influential article Pajares (1992) maintained that:
Defining beliefs is at best a game of player’s choice. They travel in disguise and often under alias - attitudes, values, judgments, axioms, opinions, ideology, perceptions, conceptions, conceptual systems, preconceptions, dispositions, implicit theories, explicit theories, personal theories, internal mental processes, action strategies, rules of practice, practical principles, perspectives, repertories of understanding, and social strategy, to name but a few that can be found in the literature. (p. 309)
“Beliefs,” it can be inferred, often serves as a generic term for a range of affective factors. The overlap of the multiple variables subsumed under the umbrella term affect is further highlighted by Mason (2004) in his evocative alphabet of generally used affective terms. Starting not with beliefs but with attitudes he wrote:
A is for attitudes, affect, aptitude, and aims; B is for beliefs; C is for constructs, conceptions, and concerns; D is for demeanor and dispositions; E is for emotions, empathies, and expectations; F is for feelings; . . . I is for intentions, interests, and intuitions; J is for justifications and judgements; . . . S is for sympathies and sensations; . . . V is for values and views; . . . . (Mason, 2004, p. 347)
Goldin (2002, p. 61) offered a somewhat more refined illustration of the links between affective subdomains as follows:
The plethora of distinct and overlapping descriptions of attitudes, beliefs, and other affective dimensions are readily discernible in both daily life usage and in the scientific literature. “Research in the ‘affective domain’” wrote Schoenfeld (2015, p. 395), “is densely populated with overlapping constructs, partially commensurate methods, and somewhat contradictory findings. Definitional imprecision is a further confounding factor.”
An extensive discussion of the many different and nuanced definitions of affect is clearly beyond the scope of this chapter. In brief, the ambiguity of definitions used for aspects of the affective domain is theoretically driven, persists and is reflected in the myriad diverse attempts to quantify dimensions of affect. Moving the focus instead onto methods and instruments used to capture single or multiple aspects of affect is more realistic and fruitful. In the remainder of the chapter work on attitudes, with the terms used generically rather than theoretically specific, is foregrounded. Several frequently used instruments are described and critiqued. For each, a snapshot of its content and its application in educational research is provided, with mathematics education often used as the specific context. How advances in technology have led to adaptations of previously used instruments is also considered. For some of these examples I draw on my own research when appropriate.
Attitudes have been measured in various ways but all have one element in common. All produce information that indicates or reflects the attitude(s) of interest. This is, emphatically, not the same as computing or calculating the attitude(s) per se. Attitudes, in common with other dimensions of affect, cannot be measured directly but need to be inferred from the way an individual behaves or responds to specifically designed instruments, cues, or situations. Self-report measures were, and still are, most commonly used. Other methods that have been adopted also rely on interpretation: at different times on open-ended data, on inferences drawn from observed behavior or, and far less frequently—and rarely in a classroom setting—on information gleaned from physiological or neural activity. Relevance of these last approaches to education is still limited, however. An accessible overview of physiological responses used for the measurement of attitude can be found in Krosnick, Judd, and Wittenbrink (2005) and of techniques used for investigations on affective processes and the brain in Schimmack and Crites (2005).
When deemed convenient or opportune, researchers have not hesitated to introduce variations to previously published instruments. To benefit from advances in technology, adjustments to instruments and their administration are being made as needed. Methodological and practical issues raised by such adaptations, for example translation difficulties and different cultural expectations, are at times minimized or overlooked.
Likert-Item Scales and Surveys
Likert-item surveys are widely used to measure affect. As Ruthven (2015, p. 393) has noted: “this is an unusually convenient technique which serves researchers well in generating results.” Likert (1932, 1967) developed a procedure for measuring attitudes by asking individuals to indicate whether or not they agreed with a series of statements about a specific topic. Respondents are typically asked to indicate their reaction to selected statements on a 4, 5, or (less frequently) a 7 point scale, ranging from Strongly Agree to Strongly Disagree. With careful wording Likert-item surveys can also be administered successfully to young children. If deemed appropriate, the Strongly Agree to Strongly Disagree scale can be replaced with a series of broadly smiling to seriously unhappy faces. However administered, there is muted unease that items may yield answers perceived as socially accepted, rather than capture the respondents’ true feelings or opinions. Asking respondents to elaborate on the initial brief response elicited may counter this concern. Given that the extent to which a series of even purposefully selected items actually reveals what it purports to measure remains a matter for debate, further information is often sought, possibly through the addition of open-ended items or a different data gathering approach.
Educational research is replete with studies which rely on Likert-item surveys to tap participants’ affect. The internationally administered TIMSS [Trends in International Mathematical and Science Study] and PISA [Programme for International Student Assessment] are examples of their adoption in large scale projects. Inclusion of the readily score-able Likert items in these surveys has undoubtedly reinforced and ostensibly validated their continued presence in a wide range of projects. The Fennema-Sherman Mathematics Attitude scales (Fennema & Sherman, 1976), initially designed to measure possible differences in males’ and females’ attitudes to the learning of mathematics, have also been widely embraced. The nine domain specific Fennema-Sherman scales can be used individually or in their entirety. For data indicative of the pervasive adoption, and adaption, of these scales by the wider research community see, for example, Tapia and Marsh (2004), Walberg and Haertel (1992), and Leder (in press). Items included in the three different Likert-item instruments highlighted in this section include:
From PISA (OECD, 2013)
From TIMSS (Mullis, Martin, Foy, & Arora, 2012)
From the Fennema-Sherman (1976) scales
From even these few examples it can be inferred that (mathematics) learning is assumed to be influenced by a variety of attitudes. Ideally, these dimensions are captured optimally by a strategically—yet invariably limited—set of items chosen to tap student affect.
Interviews
Structured interviews, with their preset list of particular questions to be asked, are often considered as very similar, and ready alternatives, to orally administered surveys or questionnaires. Unstructured interviews, on the other hand, can uncover views not anticipated in advance. A combination of these approaches—the semi-structured interview—is chosen by many engaged in educational research.
There is potentially much overlap between data gathered via a semi-structured interview and from surveys in which participants are asked to elaborate or explain their initial response. Interviews or surveys are sometimes used as stand-alone measures. At other times they are supplemented with observational data or are used as part of a more diverse or intensive battery of attitude measurement instruments.
Projective Techniques
Various projective techniques have been used to gauge attitude. Typically, an ambiguous or unstructured stimulus related to the attitude object is presented. Respondents are asked to react to this or explain what they see or think. Popular examples include sentence completion (“a good day at school is . . . ”), a word association test, a picture preference test, a request to write a story (“Anne/John came top of her/his mathematics class. Describe John/Anne.”) or draw a picture in response to a particular cue (e.g., “draw a scientist”). The technique is readily adapted for use with older and younger students. At best, these techniques offer powerful insights into the respondent’s attitude to the issue presented. The difficulty of achieving consistent scoring, and hence satisfactory reliability and validity, remains problematic but has not stopped researchers from relying on projective measures. Continued adoption of these methods is favored by those concerned about the adequacy of the more explicit methods used to tap attitudes, and in particular about the risk, already mentioned earlier, that some Likert items may elicit responses thought to be socially or culturally acceptable rather than answers actually representative of the attitudes held by the respondent.
Observations
Observations of behaviors in both structured and unstructured settings are also commonly used to infer attitudes about various objects or activities. Particularly when gathered by expert and objective observers, and supported by systematic recordings in a carefully designed observation schedule, information thus collected can be a productive approach for assessing affect. However, as it is generally difficult to predict when pertinent behaviors will be observed this method can be inefficient and expensive. In educational research real time observations are often supported by audio- or videotaped recordings of the sessions observed, to be analyzed and interpreted at length at a convenient time.
Teachers invariably take note of, and respond to, students’ behaviors in class. While such observations cannot be considered a formal or structured measure of affect, they are nevertheless, consciously or unconsciously, used to make inferences about students’ beliefs about themselves and attitudes to their work.
In brief, observations are often made in conjunction with other measures, as part of a triangulation process or reliability check. Used as a stand-alone measure it is generally considered inefficient and expensive.
Technology Facilitated Measures
In the next section, the focus turns to technology facilitated adaptations of traditional approaches to measuring attitude. Variations of the common measures described above are of particular interest. Gathering data not otherwise readily obtained is one important benefit; closely related is the possibility of extending and broadening the sample initially involved in a specific research study and as a result increase the power and generalizability of the findings obtained. An adaptation of the use of an observation schedule to capture affect associated with the participants’ regular daily activities is described first. This is followed by a discussion of a readily available method to increase recruitment and achieve greater sample diversification.
The Experience Sampling Method: Virtual Observations
The Experience Sampling Method [ESM], extensively and productively used by Csikszentmihalyi, Rathunde, and Whalen (1993), offers a sustained method for capturing people’s activities over an extended period of time, as well as their reactions to, and attitudes towards, those activities. According to Csikszentmihalyi (1997, p. 15), the ESM can provide:
a virtual film strip of daily activities and experiences. We can trace a person’s activities from morning to night day by day over a week, and we can follow his or her mood swings in relation to what the person does and who he [sic] is with.
A critical component of the ESM requires participants to respond to signals and, at the time of contact, record their current activities and reactions on specifically designed Experience Sampling Forms or ESFs. In studies involving international and local university students (Leder & Forgasz, 2004), secondary mathematics teachers (Forgasz & Leder, 2006a), and university academics (Forgasz & Leder, 2006b) mobile phone and computer technology were exploited to contact participants who were spread across diverse geographic locations.
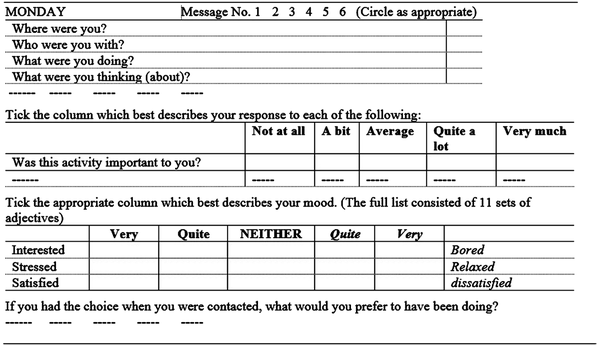
In these studies, signals were sent, via a mobile phone SMS message, seven times a day over a period of one week—between 7.30 am and 9.30 pm on weekdays and between 10 am and 9.30 pm on the weekend. Each message sent served as a prompt for the recipient to complete the next ESF. Collectively, the ESFs consistently yielded a rich body of data about the individuals’ activities and their attitudes and reactions to these activities. An abbreviated ESF excerpt is shown in Figure 1.
| Figure 1. Excerpts from Experience Sampling Form [ESF] |
|---|
|
In this way information about the daily activities of individuals, and their responses to these activities, were gathered in a natural setting, largely via self-report data, and in a manner that was less obtrusive and less resource intensive than could be obtained through sustained observations or “shadowing” of the participants.
When contacted via SMS participants could of course elect whether or not to complete the relevant ESF. Forgasz and Leder (2006b) countered the argument of bias in the choice of information to include on the ESFs as follows:
With 22 academics completing six ESFs per day for seven days, there was the potential for 22 x 6 x 7 = 924 complete sets of data—a sufficiently large set to minimise the effect of an occasional biased response . . . . The overall response rate was very high—approximately 95%. This exceeded . . . our expectations of completion of ‘at least’ four of the six sheets each day. (pp. 7-8)
In addition, the information gathered using the ESFs was supplemented with data gathered via other sources. Invariably, the activities revealed by the former resonated well with other evidence.
The requests to indicate their reactions to the different activities recorded on the ESFs elicited important affective information. For example, in the study in which teachers participated, it became clear that teaching and administrative work dominated their school day. The teachers’ attitude towards these different activities was summarized by Forgasz and Leder (2006a) as follows: “It was noteworthy that when teaching mathematics, the participants’ feelings and moods were generally positive, and high levels of engagement could be inferred—far more than for administration” (p. 40). For example, when responses were elicited during teaching times, approximately 90% indicated that they were very or quite alert, active, and relaxed. When “captured” during administrative duties, they were more likely to describe themselves as passive, bored, and stressed. Learning on several occasions that a student was in the laboratory when he received the prompt to complete an ESF is of interest, but takes on quite a different meaning when that student further indicated that during that time “he found it quite hard to concentrate and . . . would prefer to have been either playing some sport or reading a book” (Leder & Forgasz, 2004, p. 191). Without ready access to unobtrusive prompts, for example SMS messages via mobile phones which can be sent simultaneously to different locations, the rich set of data gathered via the ESM—the concurrent tracing of activities and the attitudes they provoked—would not have been possible.
On-Line Surveys: Facebook
Using the internet to administer surveys is now increasingly feasible and popular. Larger and geographically diverse samples can be reached promptly and efficiently in this way, even with limited resources. To set the scene, a small study which served as the catalyst for turning to the social network site, Facebook (http://www.facebook.com) to achieve a broader base of information is described first.
As noted at the outset of this chapter, mathematics is widely accepted as a core subject of the school curriculum. Furthermore, a level of numerical and mathematical proficiency is deemed important for “full social and economic participation” (OECD, 2013, p. 98). It is therefore not surprising that the skill level in mathematics of students and teachers continues to attract attention from educators, legislators, and the public at large. Yet, according to Leder and Forgasz (2010) the public’s views about the importance of mathematics, its teaching, and its impact on careers are rarely sought. To fill this gap, they compiled a survey in which these views were explored. They approached pedestrians at four heavy foot-traffic sites—two in the metropolitan area of Melbourne, one in a large regional center, and one in a rural city. As part of the ethics approval process, an explanatory statement needed to be prepared and offered to prospective participants. An abbreviated version is shown below.
We have stopped you in the street to invite you to be a participant in our research study. . . . We are conducting this research, which has been funded by [our] University, to determine the views of the general public about girls and boys and the learning of mathematics. We believe that it is as important to know the views of the public as well as knowing what government and educational authorities believe. (Leder & Forgasz, 2010, p. 330)
At least 50 completed surveys were collected at each site. The findings obtained were tantalizing. The majority of respondents expressed a positive attitude to mathematics. They indicated that they had liked mathematics at school and thought they had been good, or at least average, in the subject. Many were concerned that technology use had a negative rather than a positive effect on mathematics learning. Older participants were more likely to believe that mathematics teaching had changed since their time at school; younger respondents that they did not know. To test the robustness of these findings data gathering was initially extended to 12 pedestrian sites in Victoria, and then, in an attempt to gather data representative of the wider Australian public, to Facebook (Leder & Forgasz, 2011). Extending approval for our study to include this extra site revealed that Facebook has rights to data collected from surveys created within it. To avoid possible privacy and ethical complications the initial survey, orally administered to the pedestrian sample, was duplicated as an online survey using SurveyMonkey (http://www.surveymonkey.com). A link was created to it from the advertisement placed on Facebook. Briefly, the procedure used (described in detail in Forgasz, Leder, & Tan, 2014) was:
Although our advertisement indicated that we were interested in responses from Australia, many from a range of other countries also chose to participate. In the first instance we compared data from our Australian Facebook sample with those gathered from the pedestrian sites. No appreciable differences were observed. Thus, with limited extra financial outlay, data initially gathered from a small, restricted sample could be compared with nationally gathered data. In further follow up work we extended our Facebook advertisement to other countries. Even though our intended emphasis was on countries in which English was the main language, again participants from other countries chose to complete the survey. This enabled us to make international comparisons (see Forgasz, Leder, & Tan, 2014). Encouraged by the interest shown in our mathematics focused study we embarked on a comparison of the public’s opinions of mathematics and English and relied once again on both pedestrian and Facebook samples. Thus the huge and persistent popularity of the social media site delivered an extensive and diverse pool of international participants not readily reached by other means.
There are, of course, disadvantages as well as advantages in using Facebook as a source for data gathering. Realistically, the survey instrument administered shared the limitations inherent in all self-report data from a volunteer group. While using Facebook extended the potential sample with only a limited financial outlay, the additional pool was nevertheless restricted to Facebook users. Additionally, since reliance was on a survey written exclusively in English the international sample was necessarily limited to those sufficiently fluent in English to be able to respond. To what extent these limitations, as well as socio-economic or other factors, may have biased the findings is unknown but must be recognized and accepted as factors possibly confounding generalization of the results obtained. Alternately, had the survey been translated into other languages, how well or readily the instrument devised for cultural mores in an undeniably Western setting could be transported to a different context would need to be considered.
Tan, Forgasz, Leder, and McLeod (2012) reported several other studies in which recruitment via Facebook enabled the completion of work initially seemingly ambushed by unacceptably low response rates. In a study in which students’ beliefs, attitudes, and learning preferences about the use of advanced calculators were explored, cumbersome administrative structures proved an obstacle to the participation of students in government but not in non-government schools. When another avenue for recruitment was clearly needed to reach the former group of importance within the sample of interest, Facebook proved an acceptable and pragmatic alternative. In a different school based study, an unhelpfully low response rate to a survey of parents initially recruited through a school invitation was overcome by reaching beyond the school channels directly to Facebook users with children of the age targeted in the study. In both cases, recruitment using a Facebook advertisement enabled the researchers to extend their reach to survey participants who would otherwise be inaccessible, and thus pragmatically achieve a sufficiently diverse sample of acceptable size. Recruitment via Facebook, in common with the administration of other on-line surveys, had the further advantage of a speedy return of completed surveys in contrast to the inevitable delay in responses to surveys distributed and returned via snail mail.
Other Options
A host of other options are undoubtedly available for strategic recruitment of samples. For example, Linkedin (https://www.linkedin.com) can be a useful resource for targeting a specific group of professionals. Consistent with Facebook’s policy, charges are calculated per click or per impressions. If wished, a maximum daily budget can be set. Guidance for a suitable bid range is provided to ensure competitive exposure against other groups targeting the same audience. The higher the bid in the suggested range, the more likely are impressions to be shown and, correspondingly, the clicks made and responses received. Forgasz and Leder (2016) used this approach—a “self-service advertisement” on Linkedin—to recruit a sample of teachers to complete a survey about teachers’ views about numeracy. In this small pilot study they wished to attract an international sample as well as teachers from Australia. Both cognitive and affective items were included in the survey. The progress report for respondents, some time into the campaign, indicated that at that stage some 60,000 impression of the advertisement had been produced. These had attracted 94 clicks (the method of payment they had selected), at a cost of AU$196. Within a relatively short time, and within the modest budget allocated to this stage of data gathering, over 200 responses were received from participants in more than 10 countries. Statistics indicated that 70% of those who embarked on the survey spent up to 20 minutes working through it. Stages at which respondents were likely to opt out of the survey (the last item they attempted) were recorded and items found particularly difficult were also readily identifiable. Comparisons could be made on items of interest between teachers in different age groups, in different countries, and in different school settings, for example their attitudes about incorporating numeracy concepts into lessons not specifically designated as mathematics lessons.
So far, the approaches discussed for monitoring students’ behaviors or tapping attitude have not focused particularly on student reactions to classroom activities or to instructional materials. Two examples of the use of iPads, widely available and increasingly used in classrooms, are reviewed in the next section.
Mathematics, Attitude, and iPads (1)
In a small study, Larkin and Jorgensen (2015) used iPads creatively to video record the in-class mathematical activities of elementary school students and at the same time capture the students’ thoughts, feelings and emotions about these activities. Data were gathered over a sustained period. Special preparations included the following:
Two tents were erected, one in each year 3 and 6 shared space, to create a “mathematical thinking space.” Students were able to enter the tent to record their video as they chose, within the boundaries of the usual classroom teaching requirements. This was usually during the times when students would be seated doing individual work or when they had completed set tasks; however, there was no requirement that all students must record a video. Students were able to use the video camera that comes standard with any iPad, to record their musings, and if they needed, they could also use the camera to take photographs of mathematics work relevant to their conversations (Larkin & Jorgensen, 2016, p. 930).
Extra prompts, given as needed, included questions such as “What would I tell my mum and dad or my principal about what I did in maths today?” or “If maths were a food what type of food would it be?”. Themes elicited referred to difficulties with mathematics, hatred and anger towards the subject and topics within it, frustration, confusion, and boredom. The authors argued that the scope of the data obtained was more extensive and far richer than could have been gathered using more traditional methods.
Mathematics, Attitude, and iPads (2)
In stark contrast to Larkin and Jorgensen’s (2015) project, which relied heavily on the device’s video recording facility, Sinclair, Chorney, and Rodney (2015) focused on the sustained use of an application readily available on the iPad. The assumption that “children’s mathematical activity is not strictly cognitive, that it is deeply intertwined with affect” (Sinclair et al., 2015, p. 2) underpinned the work they carried out and the methodology they adopted. Like Larkin and Jorgensen (2015) the Sinclair et al. (2015) sample comprised young children. Those involved were aged six to eight years. How young children engaged with the multi-touch and freely available application TouchCounts (http://www.touchcounts.ca/) was explored via this application, which had been specifically designed for the iPad and for young children’s counting and doing arithmetic. Using rhythm as a primary unit of analysis the authors concluded that the students with whom they worked systematically discovered both specific and general expressions of mathematical patterns and that the rhythm of counting served as an active motivational tool.
In the context of education research, the neo-positivist paradigm, discussed in Chapter 1 and Chapter 2, is distinguished from the classic positivist paradigm by an appreciation that realities of human behavior can be elusive phenomena. The research exercise in itself is a human pursuit subject to fallibility. Findings are provisional and contestable. Nevertheless the endeavor to uncover patterns and consistencies drives the researcher—it is the underpinning axiology. What emerges is intended to represent more than an individual’s interpretation of the subject explored; it is intended to provide an understanding, albeit a conditional understanding, of the reality of the matter. In this chapter, in keeping with the neo-positivist research paradigm, an account of attempts to elucidate patterns of performance and affect arising from the teaching of mathematics has been advanced; methodological possibilities have been critically analyzed.
Reference has been made to Nichols and Berliner’s (2007) claim that the validity of a test is its most important characteristic. In the literature there is ready consensus about the scope and relevance of the first three descriptors of validity: content validity, predictive and concurrent criterion-related validity, and construct validity—see, for example, Messick (1991). The fourth dimension on Nichols and Berliner’s (2007) list—consequential validity—is often regarded as a more controversial measure of validity, perhaps because, as these authors noted, this last measure relies more on personal and societal values than do the other three aspects.
The interplay between cognitive and affective factors is generally accepted. “When we talk about the attained curriculum, we often think of it in terms of the test scores only. Actually, . . . in all school systems, students’ positive attitudes are one of the goals of mathematics education” noted Leung (2014, p. 263) in an article on international studies of mathematics achievement.
Throughout this chapter care has been taken to indicate that seemingly adequate approaches to the measurement of cognitive and affective components of students’ learning may lack precision and involve a margin of error. Schoenfeld’s (2015, p. 395) concerns have also been raised: “Research in the ‘affective domain’ is densely populated with overlapping constructs, partially commensurate methods, and somewhat contradictory findings. Definitional imprecision is a further confounding factor.” Yet capturing and understanding the strength and robustness of the different and interacting components is of critical concern to those involved in education.
That the recognized obstacles and difficulties should not be used as a justification for a despondent turning to other areas of research but should serve instead as a call for renewed efforts is aptly captured by Kramers’ (n.d.) observation that the physical sciences, too, are plagued by a lack of precision in measurement and terminology. “In the world of human thought generally, and in physical science particularly,” he argued, “the most important and fruitful concepts are those to which it is impossible to attach a well-defined meaning.” Continued searching for more accurate and carefully nuanced measurement instruments, and thoughtful reporting of the results obtained, are thus goals well worthy of further pursuit. Our students deserve no less.
This research was previously published in Methods and Paradigms in Education Research edited by Lorraine Ling and Peter Ling, pages 108-123, copyright year 2017 by Information Science Reference (an imprint of IGI Global).
Berliner, D. C. (2011). The context for interpreting the PISA results in the U.S.A.: Negativism, chauvinism, misunderstanding, and the potential to distort the educational systems of nations . In Pereyra, M. A., Korthoff, H.-G., & Cowen, R. (Eds.), PISA under examination. Changing knowledge, changing tests, and changing schools (pp. 77–96). Rotterdam, The Netherlands: Sense Publishers.
Cox, P. J., Leder, G. C., & Forgasz, H. J. (2004). The Victorian Certificate of Education—Mathematics, science and gender. Australian Journal of Education , 48(1), 27–46. doi:10.1177/000494410404800103
Csikszentmihalyi, M. (1997). Finding flaws: The psychology of engagement with everyday life . New York: Basic Books.
Csikszentmihalyi, M., Rathunde, K., & Whalen, S. (1993). Talented teenagers . Cambridge, UK: University of Cambridge Press.
Donnelly, K., & Wilstshire, K. (2014). Review of the Australian curriculum. Final report. Department of Education and Training. Retrieved from http://www.studentsfirst.gov.au/review-australian-curriculum
Fennema, E., & Sherman, J. (1976). Fennema-Sherman Mathematics Attitude Scales. JSAS Catalog of Selected Documents in Psychology, 6(1), 31.
Forgasz, H., & Leder, G. (2016). Mathematical literacy and teachers. Unpublished manuscript. Faculty of Education, Monash University, Clayton, Victoria, Australia.
Forgasz, H. J., & Leder, G. C. (2006a). Work patterns and stressors of experienced and novice mathematics teachers. Australian Mathematics Teacher , 62(3), 36–40.
Forgasz, H. J., & Leder, G. C. (2006b). Academic life: Monitoring work patterns and daily activities. Australian Educational Researcher , 33(1), 1–22. doi:10.1007/BF03246278
Forgasz, H. J., Leder, G. C., & Tan, H. (2014). Public views on the gendering of mathematics and related careers: International comparisons. Educational Studies in Mathematics , 87(3), 369–388. doi:10.1007/s10649-014-9550-6
Goldin, G. A. (2002). Affect, meta-affect, and mathematical belief structures . In Leder, G. C., Pehkonen, E., & Törner, G. (Eds.), Beliefs: A hidden variable in mathematics education? (pp. 59–72). Dordrecht, The Netherlands: Kluwer.
Kramers, H. A. (n.d.). Quotes. Retrieved from http://www.quotes.net/authors/H.%20A.%20Kramers
Krosnick, J. A., Judd, C. M., & Wittenbrink, B. (2005). The measurement of attitudes . In Albarracín, D., Johnson, B. T., & Zanna, M. P. (Eds.), The handbook of attitudes (pp. 21–76). Mahwah, NJ: Erlbaum.
Larkin, K., & Jorgensen, R. (2016). “I hate maths: Why do we need to do maths?” Using iPad video diaries to investigate attitudes and emotions towards mathematics in Year 3 and Year 6 students. International Journal of Science and Mathematics Education , 14(5), 925–944. doi:10.1007/s10763-015-9621-x
Leder, G. C. (2015). Mathematics for all? The case for and against national testing. In S. J. Cho (Ed.), The Proceedings of the 12th Internal Congress on Mathematical Education (pp. 189-208). Springer. 10.1007/978-3-319-12688-3_14
Leder, G. C., & Forgasz, H. J. (2004). Australian and international mature age students: The daily challenges. Higher Education Research & Development , 23(2), 183–198. doi:10.1080/0729436042000206654
Leder, G. C., & Forgasz, H. J. (2010). I liked it till Pythagoras: The public’s views of mathematics. In L. Sparrow, B. Kissane, & C. Hurst (Eds.), Shaping the Future of Mathematics Education: Proceedings of the 33rd Annual Conference of the Mathematics Education Research Group of Australasia (pp. 328-335). Fremantle: MERGA.
Leder, G. C., & Forgasz, H. J. (2011). The public’s views on gender and the learning of mathematics: Does age matter? In J. Clark, B. Kissane, J. Mousley, T. Spencer, & S. Thornton (Eds.), Mathematics: Traditions and [new] practices (pp. 446-454). Adelaide, Australia: AAMT and MERGA.
Leung, F. K. (2014). What can and should we learn from international studies of mathematics achievement? Mathematics Education Research Journal , 26(3), 579–605. doi:10.1007/s13394-013-0109-0
Likert, R. (1932). A technique for the measurement of attitudes. Archives de Psychologie , 22(140), 1–55.
Likert, R. (1967). The method of constructing an attitude scale . In Fishbein, M. (Ed.), Readings in attitude theory and measurement (pp. 90–95). New York: John Wiley.
Mason, J. (2004). Are beliefs believable? Mathematical Thinking and Learning , 6(3), 343–352. doi:10.1207/s15327833mtl0603_4
Messick, S. (1991). Validity of test interpretation and use . In Alkin, M. C. (Ed.), Encyclopedia of educational research (6th ed.; pp. 1–29). New York: Macmillan.
Mullis, I. V. S., Martin, M. O., & Foy, P. (2008). 2007 International mathematics report: Findings from IEA’s trends in international mathematics and science study at the fourth and eighth grades. Retrieved from timss.bc.edu/timss2007/PDF/TIMSS2007_InternationalMathematicsReport
Mullis, I. V. S., Martin, M. O., Foy, P., & Arora, A. (2012). Timss 2011 international results in mathematics. Chestnut Hill, MA: TIMSS & PIRLS International Study Center. Retrieved from timssandpirls.bc.edu/timss2011/downloads/T11_IR_Mathematics_FullBook.pdf
Nichols, S., & Berliner, D. (2007). Collateral damage. How high stakes testing corrupts America’s schools . Cambridge, MA: Harvard Education Press.
OECD (2013). PISA 2012 assessment and analytical framework: Mathematics, reading, science, problem solving and financial literacy. OECD Publishing. 10.1787/9789264190511-en
Pajares, M. F. (1992). Teachers’ beliefs and educational research: Cleaning up a messy construct. Review of Educational Research , 62(3), 307–332. doi:10.3102/00346543062003307
Popham, W. T. (1997). Consequential validity: Right concern—wrong concept. Educational Measurement: Issues and Practice , 16(2), 9–13. doi:10.1111/j.1745-3992.1997.tb00586.x
Ruthven, K. (2015). Reaction to section 3: Some methodological reflections on studies of mathematical affect. In B. Pepin & B. Roesken-Winter (Eds.), From beliefs to dynamic systems in mathematics education (pp. 383-393). Springer.
Schimmack, U., & Crites, S. L. Jr. (2005). The structure of affect . In Albarracín, D., Johnson, B. T., & Zanna, M. P. (Eds.), The handbook of attitudes (pp. 397–435). Mahwah, NJ: Erlbaum.
Schoenfeld, A. H. (2015). What counts, when? Reflections on beliefs, affect, attitude, orientation, habits of mind, grain size, time scale, context, theory and method . In Pepin, B., & Roesken-Winter, B. (Eds.), From beliefs to dynamic systems in mathematics education (pp. 395–404). Springer.
Tan, H., Forgasz, H., Leder, G., & McLeod, A. (2012). Survey recruitment using Facebook: Three studies. Paper presented at the International Conference on Internet Studies, Bangkok, Thailand.
Tapia, M., & Marsh, G. E. (2004). An instrument to measure mathematics attitudes. Academic Exchange Quarterly , 8(2), 16–21. Retrieved from http://www.rapidintellect.com/AEQweb/cho25344l.htm
Walberg, H. J., & Haertel, G. D. (1992). Educational psychology’s first century. Journal of Educational Psychology , 84(1), 6–29. doi:10.1037/0022-0663.84.1.6