By taking into consideration the significance of the socio-economic contexts, this research investigates teachers’ perceptions of the role of graphing calculators, as mediating tools, to help facilitate mathematics instruction of students from two different SES backgrounds. The main source of data are in-depth semi-structured interviews with four teachers, two from each SES school. In general, the participants’ perceptions of the role of the graphing calculator were dependent on the context within which it was used. Also, the participants played a crucial role in determining the nature of graphing calculator use with the low-SES school’s participants appearing not to involve their students in lessons that capitalized on the powerful characteristics of graphing calculators. To tease out the role of the situation context, a four-component framework was conceptualized consisting of teacher, student, subject matter, and graphing calculator use. The components of the framework were taken to be continuously in interaction with one another implying that a change or perturbation in one of the components affected all the other components. The continuous interactions of the components of this framework suggest that equity issues in connection to the nature of graphing calculator use should be an ongoing process that is continuously locating strategies that will afford all students appropriate access and use of graphing calculators.
The National Council of Teachers of Mathematics [NCTM] (2000) has, over the last thirty years, been in the forefront in advocating for reform in mathematics curriculum, instruction and assessment to improve the mathematics achievement of all students. Through its published Standards and its official policy statements, the NCTM has called for high expectations and strong support in order to ensure mathematics success for every child. Although the National Assessment of Educational Progress (NAEP) indicates that scores in mathematics and science have improved over the last 20 years, a closer examination of student data reveals a persistent performance disparity among at-risk students defined mainly by socioeconomic status (SES) and race (Lubienski, 2001; Struchens & Silver, 2000).
Race and socioeconomic status have long been associated with disparities in students’ mathematics achievements. According to Lubienski (2001), the National Assessment of Educational Progress (NAEP) categorizes students’ race as one of the following: White, African American, Hispanic, Asian/Pacific Islander, and American Indian (including Alaskan Native). In addition, NAEP classifies schools as high or low SES depending on the percentage of students eligible for free/reduced lunch. Since eligibility for free/reduced lunch is based directly on family income, this implies that majority of the students who attend high (low)-SES schools are those with high (low)-SES. Studies show that schools that enroll students of low-SES have a mean academic achievement that is significantly lower than that of schools with more affluent and high SES students (Strutchens & Silver, 2000). In addition, many researchers argue that there is a strong correlation between race and SES with a disproportionate number of low-SES students being minorities (Strutchens & Silver, 2000). Due to this conflation of race and SES, Strutchens and Silver (2000) posit that it is sometimes difficult to untangle the two variables to explain the variations in students’ academic achievements. However, many have argued that compared to race, SES is a more important demographic factor to use as a basis for examining the differences in academic achievement (Lubienski, 2001; Struchens & Silver, 2000).
In addition, Krashen (2005) suggests that SES, per se, is not the cause of the discrepancy in the achievement of low-and high-SES students; rather it is the factors typically associated with SES that cause this. These factors, which are more likely to be associated with low-SES students than high-SES students, include low expectations of students, ill-prepared teachers, lack of coordination among school, parents and community on behalf of students, stereotyping, students’ negative self-image and attitudes, race and identity issues, shortage of resources and less adequate facilities and biased curricula and pedagogy (Martin, 2000; Perry, Steel & Hilliard, 2003). It is worth noting that these factors do differentially affect the learning opportunities of low SES students. Several studies have shown that in order for students to achieve they must have appropriate learning opportunities (e.g., Tornroos, 2005). Appropriate learning opportunities refer to not only the chances presented to the students to study mathematical topics but also how those topics are taught, that is the quality of instruction afforded to the students to enhance the acquisition of the knowledge and skills of the topics covered (Tornroos, 2005).
The NCTM (2000, 2005) recommends the essentiality of ensuring that today’s classrooms provide technology-supported learning opportunities for students to learn more sophisticated mathematical ideas. These opportunities among students include not only the physical presence of the technology in the classroom, but also the teacher’s appropriate use of the technology in ways that encourage student engagement and learning, ultimately affecting their achievement (Abramovich, 2014). Thus, opportunity to learn is an important contributing factor in learning outcomes. Indeed, studies reveal that there exist a strong relationship between opportunity to learn and student performance and achievement in mathematics (e.g., Tornroos, 2005). For this reason, equity issues arise due to a differential opportunity to learn among the high SES and low SES students since, consistent with the aforementioned argument, this in turn leads to a differential gap in their academic achievement and performance. It is for this reason that Mickelson and Southworth (2005) argue that ensuring a closure of this achievement gap would require educational reforms that would ensure that all children have equal opportunities.
The term equity, defined in the context of education, has had a number of different meanings, with past researchers emphasizing education access concepts such as equal resources, quality teachers, and opportunity to learn (e.g., Century, 1994; Secada, 1994). Gutierrez (2002) suggested that equity refers to fairness and having the same high expectations or standards for all students. She further argued that equity does not mean sameness rather “the inability to predict mathematics achievement and participation based solely on student characteristics such as race, class, ethnicity, sex, beliefs, and proficiency in the dominant language” (p. 153). Recently researchers have begun to draw from the sociocultural approach to examine issues of equity in mathematics education through the analytic lens of identity (e.g., Stinson, 2006). From this perspective, researchers consider the social and cultural features of the learning contexts within which traditionally marginalized students participate in mathematics and how this shapes how they position themselves as learners and doers of mathematics and how they are positioned by others.
These definitions seem to be centered on the Equity Principle proposed by the NCTM (2000) in the Principles and Standards for School Mathematics which calls for high expectations and learning opportunities, accommodating differences to help everyone learn mathematics, as well as to provide resources and support for all classrooms and students. Moreover, the NCTM Research Committee (2005) contends that researchers should concern themselves less with the multitude of equity definitions, and more with research on understanding the causes and effects of inequity as well as the strategies that effectively reduce undesirable inequities of opportunities and achievement in mathematics. This study invokes equity as those strategies aimed at providing appropriate learning opportunities to at-risk students with the aim of improving their achievement in mathematics.
In the discussion of the Equity Principle, the NCTM (2000) offers specific tools for achieving equity in the mathematics classroom with technology being one such tool. The NCTM argues that, “technological tools and environments can give all students opportunities to explore complex problems and mathematical ideas” (p. 13). The use of technology in classrooms has, thus, been recommended as useful in helping engage at-risk students in challenging and learning that encourage them to use complex thinking skills (Hennessy & Dunham, 2002).
The assertion by Penglase and Arnold (1996) that the graphing calculator is more prevalent than any other forms of technology in the classroom because of price, portability, and ease of use holds true today. In addition, the NCTM (2000) has advocated the use of technology, including the graphing calculator, in the teaching and learning of mathematics for all students. Further, the NCTM (2000) argues that calculators are essential tools for teaching, learning, and doing mathematics. A number of studies have addressed the role of the graphing calculator in the teaching and learning of mathematical concepts. The consensus of research reviews is that students who use graphing calculators display better understanding of function and graph concepts, improved problem solving, and higher scores on achievement tests for algebra and calculus skills (e.g., Abramovich, 2014; Doerr & Zangor, 2000; McCulloch, 2011; Rachel, 2014).
That said, it is important to mention that the graphing calculator, like any other technological tool, is more than just the physical resource in the sense that the nature of its use is shaped by the situational context within which it is used (Hennessy & Dunham, 2002). Indeed, as Pengalese and Arnold (1996) pointed out, the nature of graphing calculators’ use cannot be isolated from the many other variables involved in classroom dynamics and therefore researchers are urged not to treat the graphing calculator use and effects aside from the context in which it is being used—the particular learning environment. For this reason, it is important, when examining the use of graphing calculators to also pay attention to the context of that use. In light of this, however, few studies have focused on the nature of graphing calculator use within various socioeconomic contexts, which is the focus of this study. Indeed, while graphing calculator access is generally high, unlike other technological devices like computers, issues pertaining to equity arise from the nature of graphing calculator use.
Thus, while the availability or the physical access to graphing calculators is necessary, it is not a sufficient condition to ensure equitable mathematics learning. The extent of instruction incorporating graphing calculators received by students, as well as the opportunity that they have to make use of the graphing calculator’s mathematical functions, is what the NCTM envisions as not only the availability but also the appropriate use of technology that can promote equity in mathematics classrooms. In other words, this envisioning ensures that students are not just involved in learning activities that merely require mathematics that could be accomplished with or without a graphing calculator, but rather they are involved in learning activities that capitalize on the powerful characteristics of the graphing calculator. Teachers’ perceptions towards the graphing calculator have been found to significantly affect the way the graphing calculator is integrated into learning activities (Lee & McDougall, 2010). Students’ perceptions and confidence levels also play a significant role in how and when they use technology (Hennessy & Dunham, 2002). Consequently, the various contexts and classroom learning environments, within which the graphing calculator is used, can differentially affect and determine the nature of graphing calculators’ use.
By taking into consideration the significance of the socio-economic contexts within which the graphing calculator is used, this research attempted to investigate teachers’ perceptions of the role of graphing calculators, as mediating tools, to help facilitate the understanding and internalization of new knowledge in the mathematics instruction of students from different SES backgrounds. The goal of this study, thus, was to draw to the attention of mathematics educators some of the red flags that stand in the pathway of ensuring not only the availability but also the appropriate use of graphing calculators that can in turn promote equitable mathematics education. The research questions for this study were:
In addressing these questions, a comparison was done of the perceptions of the participants, at both high-and low-SES schools, of the role or use of graphing calculators in mathematics instruction. In addition, the situational context was investigated as to how it appeared to have enhanced or constrained the use of graphing calculator at both the high-and low-SES schools. Pertinent to this discussion and of prime importance is how the situational context appeared to have influenced the ways in which the graphing calculator was used. This refers to not only the availability but also the appropriate use of graphing calculators, discussed previously. In other words, what was the nature of graphing calculator use at both schools?
A sociocultural theoretical perspective guided this research. According to sociocultural theory, learning is socially and culturally situated in contexts of everyday activities (Vygotsky, 1978) and is the result of a dynamic interaction between individuals, other people, and cultural artifacts or tools, all of which contribute to the social formation of the individual mind and lead to the realization of socially valued goals. The mechanism through which the external sociocultural activities are transformed into mental processes is called mediation. Vygotsky (1978) described the basic elements of such a system as the subject (the individuals engaged in the activity use), mediating artifacts or tools (the technical tools, symbols, language, prior knowledge and people to help the subjects engage in the activity) and the object (goal to be achieved from the activity). Using this theoretical view, researchers attempt to explain the relationship between the individual and the system. Individual development is viewed as dependent on the social interactions that are a part of the daily activities in any given culture. These daily activities include the everyday cultural experiences that are subject to social conditions, such as SES, and the policies that affect neighborhood conditions. A sociocultural perspective allowed the examination of teachers’ perceptions of the graphing calculator use as a mediating tool to facilitate the mathematical learning of low-SES and high-SES students situated within different sociocultural classroom and school contexts.
In order to investigate the research questions in-depth face-to-face semi-structured interviews were conducted with four participants. The purpose of the interviews was to use questions, conversations as well as discussions in order to gain insight into the participants’ perceptions of the research themes. More specifically, the interviews were aimed at getting a glimpse of how the teachers used graphing calculators as tools to mediate mathematical learning in particular classroom environments. According to Smith and Smith (2006):
Qualitative interview research enables inductive analysis; the interviews provide a detailed narrative, which allows the researcher to interpret and draw his/her own inferences. It allows the researcher to capture the perceived experiences of the people and interpret their stories, recognizing that the accounts were filtered through the researcher's concept of reality. (p. 37)
An interview protocol was designed with key questions, which were categorized according to the research interests of this study and used for reference and as prompts when and if necessary. The participants were asked questions regarding to how and why they decided if and when the graphing calculators would be used. It was also of interest to investigate the participants’ opinions regarding their past experiences and/or future expectations with respect to teaching a class or lesson that they felt lent itself to the use of graphing calculators. All the interviews were audio recorded and transcribed.
The four participants were chosen purposively on the basis of several factors. First, they had to come from different SES schools: two from a low-SES school and two from a high-SES school. Also of importance was the requirement that the participants would be reasonably knowledgeable regarding the use of graphing calculators and would be already using them in their classrooms. It was also important for the participants to have at least two years of experience in teaching mathematics coupled with experience in using graphing calculators. The experience requirement was based on the assumption it would enable the teachers to have not only a better understanding of how, when, and for what activities to use the graphing calculator in mathematics instruction, but also an understanding of the factors that enhance or constrain the use of graphing calculators.
All the participants, two females and two males, were White and their ages ranged from 24 to 35 with all self-reporting a middle class background. Lorna and Lance taught at the low-SES school, Liberty high school, while Hakeem and Heather taught at the high-SES school, Hopetown high school. In order to protect the anonymity of the participants, all the names used in this study are pseudonyms. The two different SES schools were within 10 miles of each other in the northeastern part of United States. According to the State School Report Card, Liberty high school, the low-SES school, served at least 1000 students in grades 9-12. About 53% of the students were African Americans, 26% were white and the rest belonged to other ethnicities. Approximately 50% of the students were eligible for free or reduced lunch. Additionally, at the high-SES school, Hopetown high school, 96% of the approximately 700 students were white, while the other races shared the remaining percentage. Compared to Liberty high school, about 10% of the students were eligible for free or reduced lunch. A summary of the participants is shown in Table 1.
Table 1. Summary of participants in the study
| School | Teacher | Education | Years Teaching Math |
|---|---|---|---|
| Hopetown High School (high-SES) | Hakeem | Dual BS (Math and special Ed) | 5 |
| Heather | BS (Math) MS (Math Ed) |
3 | |
| Liberty High School (low-SES) | Lorna | BS (Math) | 6 |
| Lance | BS (Math) MS (Math Ed) |
11 |
Grounded theory methods, which involve the constant comparative method of analysis, were used to analyze the data. The main idea behind the constant comparative method, according to Bogdan and Biklen (2003), is coding all data while continually comparing each piece of information with previously categorized data. It is from these comparisons that emerging categories begin to form. Categories were initially developed by searching through the data for patterns as well as for topics the data covered. The categories that were searched for and coded include: perceptions of teachers of the use of graphing calculator as a tool for mathematics instruction, local constraints on the use of graphing calculators and influences of using graphing calculators. The analysis compared and contrasted the data falling in each category, within and between the participants of both the high-SES and low-SES schools.
By taking into consideration the local sociocultural contexts of the classrooms and the schools within which the participants and their students were situated, this analysis is consistent with a sociocultural perspective of learning in the sense that the nature of the graphing calculator use, as a mediating tool to facilitate mathematical learning, was strongly influenced by the various classroom and school milieu.
In identifying the use of the graphing calculator as perceived by the participants, the categories specified in the results of Simmt’s (1997) study were adopted with slight modification. This is because the participants’ perceptions of the uses of graphing calculators were found to be similar to the uses that Simmt reported in her study. In Simmt’s study, the participants were six in-service teachers who were teaching the transformation of the quadratic function. The categories of the uses of the graphing calculator were different even though the teachers had the same availability and the same curricula requirements for the unit. These categories were: (a) checking work, (b) plotting graphs of functions, (c) finding graphical solutions, (d) understanding word problems, (e) exploring beyond the concept being taught, (f) providing a picture. Because (b) and (c) were not found to be different, the two were collapsed into one category: finding graphical solutions. In addition, (a), (e) and (f) were appropriately rephrased to read: checking working initially done by hand, exploring deeper, richer mathematics, and visualization respectively. Finally, no one example of (d) was found from the data but an additional use of the graphing calculator—motivation—was revealed.
Moreover, the following factors that served as local constraints, as perceived by the participants, on the use of graphing calculators were found: fear of the erosion of computation skills and calculator dependency, planning time factor, students’ lack of basic skills, students’ lack of discipline, availability of graphing calculators outside school, low standards of state exams. Also, the factors influencing the participants to use graphing calculators were found to be: teachers’ perception of teaching and learning mathematics, topic of study, state requirements, collegiality, and teachers’ expectations of students.
Participants’ Perceptions of Graphing Calculator Use
Table 2 shows how the participants’ perceptions of graphing calculator use were categorized.
Table 2. Participants’ perception of graphing calculator use
| Low-SES School | High-SES School | |||
|---|---|---|---|---|
| Lance | Lorna | Hakeem | Heather | |
| Checking work initially done by hand | Yes | Yes | Yes | Yes |
| Finding graphical solutions | Yes | Yes | Yes | Yes |
| Exploring deeper richer mathematics | No | No | Yes | Yes |
| Visualization | No | No | Yes | Yes |
| Motivation | No | No | Yes | Yes |
All the participants perceived the graphing calculator as a tool for checking work done by hand (see Table 2). For example, Heather said that the graphing calculator was a tool to “make sure that you are doing it right…to check a funky answer like a decimal,” while Hakeem believed he had to make sure that his students were able to solve problems “by hand…after that I will be like, ‘let us plug that equation in…let us go to our table when x is equal to 7...’ and then I will ask them to look at that…” He perceived the graphing calculator as a checking device to confirm answers solved algebraically. He shared this perception with Lorna who believed that students needed to acquire algebraic skills first and later “they can use the graphing calculator as a check [tool] to say that ‘does this work or not’.” The notion that the students needed to have a firm understanding of the underlying mathematical concepts before using graphing calculators seemed to be quite pervasive in the comments made by the participants. Hakeem noted:
Well, I always teach them the basics first, they always do everything by hand first because if they don’t understand what the calculator does...later on if they don’t understand the domain and range of a function, they are not going to be able to figure out what the correct window is for once they get to math B, so I try to really make sure that they understand that stuff first.
Thus, Hakeem, like the other participants believed that it was important for the students to learn and understand the concepts first and be able to work out problems by hand, and then later on they could use graphing calculators to verify solutions to the problems.
All the participants believed that the graphing calculator should be used as a tool to find graphical solutions. They mentioned that they used the graphing calculators to, among other things, find the solutions to a system of equations and to find the output of a function given the input. For example, Lorna described how she showed her students how to solve a system of simultaneous equations by graphing the functions and looking for the point of intersection. Hakeem said that when given a system of equations to solve, it is “a lot nicer for them to be able to put it into the graphing calculator and be able to get out the answer quickly and be able to see that there is two linear equations that cross at one point,” sentiments which were echoed by Heather and Lance. Thus, the participants believed that the graphing calculator was a useful tool in investigating graphical solutions for a system of equations.
Only Heather and Hakeem perceived the calculator as a tool to explore deeper and richer mathematics. To achieve this, they presented their students with hands-on activities to explore using graphing calculators thereby making them more active participants in the classroom. They also brought in some real-world examples so that students would relate the mathematics they were learning to the real world. Hakeem gave this example: “I love to teach parabolas first and then later on I give real world applications like the example…’a guy plays, he hits a homerun, what is the shape of the graph [of the path of the ball]?’ You know, we go through, plot a parabola using a graphing calculator…” Heather said that the graphing calculator “helps more to learn because you can see more, the students can visualize and be like, ‘oh, that is what you meant,’ or, ‘okay I got you’.” These participants, from the high SES school, explained that by giving the students real-world examples, the question the students normally ask “where will I ever use this?” takes on a different meaning. They participants also believed that the students were capable of doing higher-level math given proper tools like the graphing calculator and that graphing calculators helped to promote a deeper understanding and discovery learning among the students. On their part, Lorna and Lance, from the low SES school, gave students’ lack of discipline in the classroom and their lack of basic skills as the reasons why they do not favor this use. Lorna noted:
You don’t have to do all the higher-level math. You need to make sure they have mastered their skills. With the low level if you don’t do that then you end up with discipline problems because now you have gone too fast for them and they are becoming a discipline problem…
This issue of lack of skills and discipline was quite pervasive in the comments made by Lorna and Lance. In the context within which they taught, they saw these issues acting against the potential benefits of graphing calculators. Lance remarked:
These guys need the basic skills instead of the advanced more or less this is how you use it here. They have a hard time…they need paper and pen skills…just trying to do it on a piece of paper. So for us…for myself… I am more concerned about just giving the basic skills.
Therefore, Lorna and Lance believed these two issues pertaining to students’ lack of skills and lack of discipline needed to be dealt with first in order to render the students capable of doing higher-level math with appropriate tools like the graphing calculator.
Consistent with their perceptions about their students lacking in basic skills, Lorna and Lance did not believe that the graphing calculator was useful as a tool for motivation. This is what Lorna said:
I am not convinced…working on skills and confidence…I think skills and confidence are better than technology any day of the week…If a kid has problem in engaging you can do everything on the kid …as long as you do not deal with the problem of engaging… there are certain things that are still basic… we give them calculators and have gone beyond basic skills and there is no basic skills and there is no self-esteem build up. All they know how to do is type numbers on the calculators.
Lorna reiterated the factors that she perceived as counteracting the possible benefits of graphing calculators. She believes that dealing with these problems should precede the use of graphing calculators. In contrast to the perceptions of Lorna and Lance, Heather and Hakeem perceived the graphing calculator as a tool for motivation. Heather explained that she thought that the graphing calculator was “a great, great tool… before you had to rely on the teacher to talk and show… now you can actually have the kids do it themselves…” while Hakeem said that “it is nice change of pace…” and that “the more the different ways we can use to teach the course material, the more [the number of] students we will be able to motivate and get them to do math, and I really think that this is one good thing about it…” The participants from the high SES school, thus, believed that the graphing calculator was an effective tool for instruction and that their students were able to do higher-levels of mathematics, when motivated to do so, with the help of proper tools.
Participants’ Perceptions of Local Constraints
Table 3 shows how the participants’ perceptions of local constraints to graphing calculator use were categorized.
Table 3. Respondents’ perceptions of local constraints
| Low-SES School | High-SES School | |||
|---|---|---|---|---|
| Lance | Lorna | Hakeem | Heather | |
| Fear of erosion of computational skills | Yes | Yes | Yes | Yes |
| Planning time | Yes | Yes | Yes | Yes |
| Students’ lack of basic skills | Yes | Yes | No | No |
| Students’ lack of discipline | Yes | Yes | No | No |
| Physical access outside school | Yes | Yes | No | No |
| Low standard of exams | Yes | Yes | No | No |
| Student distraction | Yes | Yes | Yes | Yes |
| Student resistance | Yes | Yes | No | Yes |
The notion of erosion of computational skills and dependency on graphing calculators was quite pervasive in the comments made by the participants (see Table 3). For example, Hakeem explained that he thought the graphing calculator helped the students in so many areas but it ruined their computation skills and that sometimes he felt the device was “worshipped like a god. I cannot tell you the number of times where I said, ‘that may be the answer to the question that you asked, but you asked the wrong question…’ about halfway through I will be sick of saying that, and I will still have to say it.” Hakeem gave an example of how students erred in believing that the square of a negative (real) number was a negative value because that is what the graphing calculator gave them. Giving a similar example, Lance pointed out that the students erred because, when feeding the calculator with values to find the square of a number, the students did not “plug in the values properly.” Hakeem and Lance, thus, felt too much dependency on graphing calculators caused the students to gloss over the answers they got using graphing calculators without questioning those answers and as a result, this prohibited their thinking. Lorna, on her part felt that the graphing calculator was not always helpful because although it provided shortcuts:
It avoids skill development…when we learn how to use the calculator we are told it is great… it is higher thinking but I think they have gotten in the wrong direction and they are moving backwards away from it…we are going back to basic skills because [the graphing calculator] was supposed to make the kids think higher and it was supposed to investigate and really all it has done is to get the answers.
Lorna was not convinced that graphing calculators could help her students develop high thinking skills. Due to her beliefs about the role of basic skills in mathematics education, which she perceived her students to be lacking in, she believed that the traditional model of teaching using drill-and-practice activities was much better than the technology enhanced model that allowed students to explore and investigate mathematical concepts. In addition, Heather was frustrated that students were using graphing calculators to do problems whose solutions she believed already should be “in their heads” like “adding negative two plus zero.” Like the other participants, she was concerned that if students used the graphing calculator too much they would become dependent on the calculator, even for relatively simple calculations and end up not only lacking an understanding of the mathematical processes but also failing to develop a strong skill base.
While the participants acknowledged the use of graphing calculators helped to save them instructional time on the one hand, they complained that it took away their time to prepare and plan the lessons on the other. For example, while referring to the time he spend coming up with a demonstration for the Pythagorean theorem, Hakeem said: “I think it takes up more of my time. Setting up the demo for Pythagorean theorem, that probably took me a couple planning minutes for me to do it…”
The participants also complained about the time to teach the students to be proficient in using the graphing calculators. Heather said that she had to teach her students how to use the graphing calculator because “sometimes the user doesn’t understand or doesn’t know how use it,” while Lorna saw another dimension to this by saying that dedicating time to do this, though inevitable, would be drifting from the initial goal of “teaching the students math,” to “teaching them technology,” mentioning that what her students needed most were the basic skills.
All the participants mentioned that they found it problematic when, as Heather and Lorna put it respectively, the students began to “play games” and “type letters” during instructional time instead of participating in the lesson. Hakeem said that when his students were using graphing calculators he tried to be “aware of the game playing” in order to make sure that the students were on task. By turning the graphing calculator to a toy, the participants felt that it became an entertainment artifact instead of what it was supposed to be—an educational tool.
All the participants but Hakeem mentioned that their students showed reluctance and resistance to using graphing calculators. For example, Lance found it problematic those times when the students resisted the tool. He said:
There are times that they don’t like it at all…there are times they just type in words on the calculator not paying attention to what I was saying. So some of the times, its like if I found them doing that...I am like…they are just not using them in the right way…so what is the sense?
It can be inferred from this statement that the students’ reluctance and/or resistance could be attributed to what Lance perceived to be their lack of attentiveness and lack of understanding of their responsibility as active learners in the classroom. Attributing this resistance to the students’ lack of understanding of the technical aspects of the graphing calculator technology, Heather said that there were times when the students “get frustrated and they won’t do it on their graphing calculators…” Lorna had a different take on this issue:
And I will tell you that the kids once they learn how to solve for x, they do not want the shortcut. They want to show you that they can solve for x, they want to show you…like I have taught it before and they were like, “I don’t want to do that…why don’t I…” They want to show you that they are successful in math and once they learn how to solve for x they don’t want even want the shortcut…
She added that most of her students came to high school without having been successful in mathematics. It can be inferred from her statements that these students preferred the pen-and-pencil method because they felt more confident and successful in their practiced method of working through the problems without the aid of graphing calculators.
According to the participants from the low-SES school, the majority of their students, unlike those of the high-SES school, did not have graphing calculators at home. Lance found this problematic:
Very few of my students have their own graphing calculators… so, that is hard…that is why I can’t teach them too much on that…‘cause if they were gonna go home and do it, they cannot do it, so why teach them; why show them this great information when they cannot use them at home?
This may explain Lance’s reluctance to engage in innovative instruction using graphing calculators that could benefit the students. Although he believed students’ access to graphing calculators was necessary, which he thought should start in middle school, he was convinced it was not sufficient. He believed that besides, and indeed before the experience with graphing calculators, students needed to have the basic skills in mathematics.
The low standards of exams was another problematic issue to both participants at the low-SES school. They believed that the standards of the state exams had been set too low in order for the students from inner city schools to pass. Lance thought that there were no incentives to use the graphing calculators as an investigation or visualization tool and expressed his frustrations rather blatantly: “…so why am I gonna bust my butt to teach them some of the high-level stuff…I may as well work on the basic stuff for them…I mean that is what the state is telling me basically.” Since Lance saw the state as lowering the exam standards so that students could pass by “merely guessing the multiple choice-section of the exam,” he did not see the need to involve the students in learning that would take advantage of the powerful characteristics of graphing calculators.
Participants’ Perceptions of the Factors Influencing the Use of Graphing Calculators
Table 4 shows how the participants’ perceptions of the factors influencing the use of graphing calculator were categorized.
Table 4. Factors influencing the use of graphing calculator
| Low-SES School | High-SES School | |||
|---|---|---|---|---|
| Lance | Lorna | Hakeem | Heather | |
| Teachers’ philosophy of teaching and learning mathematics | Yes | Yes | Yes | Yes |
| Topic of study | Yes | Yes | Yes | Yes |
| State requirements | Yes | Yes | Yes | Yes |
| Teachers expectations of students | Yes | Yes | Yes | Yes |
From all of the participants’ comments, it was inferred that their philosophy of teaching and learning mathematics in turn influenced their perception of the role of graphing calculator in mathematics instruction (see Table 4). Lorna had this to say about her students’ use of the graphing calculators to solve a system of equations:
I couldn’t even get them to develop the understanding as to why the intersection was the answer…they really…it was…they were getting the answer but I didn’t feel it helped them mathematically, I felt like it got them the answer and if the goal of the class was to get the answer then we were good but the goal of the class was to have an understanding and I do not think it [graphing calculator] gave them that…they never really…these kids are low level…and we are skipping the process of learning math and giving them calculators to get answers.
Lorna’s philosophy of teaching mathematics was to have her students not just write down the answer but also to understand the process of getting it. Since she perceived her students as lacking in basic skills, she believed that they needed to gain those skills first before using the graphing calculators in order to gain an understanding of the process of solving mathematical problems.
Lance perceived mathematics to be a process consisting of bits and pieces and his responsibility, as a teacher, was to ensure that these pieces were brought together in order to move to the next level. He believed that these bits and pieces required basic skills in mathematics, which he also perceived his students to be lacking in. As a result, he believed that the students needed to acquire “some basic understanding, some basic math skills” before using the graphing calculator in the process of integrating the bits and pieces of mathematics.
Moreover, Hakeem’s view of teaching mathematics was through scaffolding as illustrated below:
Well, I think scaffolding works very well for me and it is just like when you are building up a building and you start off with a whole bunch of stuff so that you can build a strong foundation with beams and support and then once those are in place you start going down the steps…that is what I view myself…
For this reason Hakeem first laid the foundation, which provided the framework for modeling and teaching the students to use a variety of techniques including the use of graphing calculator, to solve real-world problems. He perceived his students as being able to do all levels of mathematics given proper tools like the graphing calculator and that learning should be tied to real-world applications.
Heather mentioned that she viewed mathematics as having fun, and that the graphing calculator made it possible to investigate fun activities. She also believed that students were able to do all levels of mathematics given proper tools and that the graphing calculator was such a tool.
The participants shared the belief that some lessons lent themselves to the use of graphing calculator better than others. For example, Lorna said:
During the graphing unit, I use it everyday. So right now we are in the span where we do use it every day…so they use it to get their tables, they will use it to get their solutions to a system of equations, and that is just about it.
Hakeem had this to say:
When I get to the graphing unit, I use them frequently…when I get to probability and statistics; I use them probably three out of five days...there are certain topics that may really lent themselves to the use of graphing calculator…there is solving functions on graphing calculators but I don’t want students to be bothered by it when I am starting off and we are just learning how to get the foundation…
It appeared that another motivation to use the graphing calculators came from the state directives, which required all students to have access to graphing calculators during the state exams. Lorna noted that it would be unfair for the students not to experience the use of the graphing calculator when they were bound to use during exams: “…just because the state says that they can use on the state exams, so it is not fair for them not to have it…so, because the state has set that precedent we have got to do that.” Heather wanted to make sure that: “…everybody passes the regents exams although I haven’t had any of my kids who have done the regents exam yet…” Hakeem also expressed the same feeling: “…the state emphasizes that we use graphing calculators, so I think that because of that we have to emphasize the use of them in classrooms.” Lance appeared to agree with the other participants by stating that:
It was more or less that everything was going towards that, being able to use the graphing calculator and now we can be able to do all this graphing, something like that… it was almost like a new wave type of thing…now you can be able to look at a table, be able to graph, be able to change the x and the y axis, so it was something new, you were always being told to use technology as much as you can…this was a perfect way to do it.
The participants’ expectations of their students appeared to have influenced them also. The participants at the high-SES school believed that their students could do high-level math with the help of tools like the graphing calculator. For example, Heather believed using graphing calculators would give the students “an extra jump, now before they get to the next math course or anything higher.” This shows that her high expectations of the students influenced her perception of the graphing calculator use.
The expectations of the participants at the low-SES school of what the students could or could not learn with the help of the graphing calculator stemmed from their concerns about the students’ lack of basic skills. For example, referring to the role of graphing calculators in the advancement of mathematical teaching and learning, Lance remarked: “…they do not have the necessary skills to do all that stuff [high-level mathematics]…they need to get the skills first before they start using the calculator…” The participants at the low-SES school, therefore, believed that, without these foundational skills, the students were not able to learn high-level mathematics even with the help of graphing calculators.
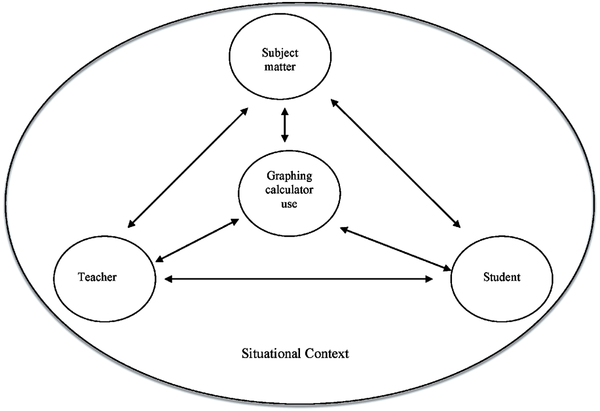
The results of this study indicate the participants’ perception of the role of graphing calculator was dependent on the situational context within which it was used and that the participants played a crucial role in determining the nature of graphing calculator use in mathematics instruction. In order to tease out the role of the situational context with regard to the factors that enhanced and/or constrained the use of graphing calculators, a four-component framework was conceptualized. This framework consists of four components: teacher, student, subject matter, and graphing calculator use (see Figure 1).
| Figure 1. A four-component model of mathematical learning using a graphing calculator |
|---|
|
The components of this framework were taken to be continuously in interaction with one another implying that a change or perturbation in one of the components affected all the other components. This study sought to determine the conditions that coalesced to bring forth the situational context within which the participants used the graphing calculator and how the interactions of the components influenced the nature of this use.
According to this framework, the teacher’s role in integrating graphing calculators into classrooms is pivotal since it is the teacher who guides instruction and shapes the instructional context in which the graphing calculator is used. The teacher’s perception of the use of graphing calculator, perception of students, perception of the role of basic skills in mathematics, and experience with graphing calculators also contributes to the conditions bringing about the teacher’s interaction with the situational context. Thus, the decisions s/he makes pertaining to the use of graphing calculator directly affects how the teacher and the students interact with the graphing calculator and with one another to perform different tasks. Taking the situational context at the low-SES school, for example, some of the conditions that combined to create the context in which the graphing calculator technology was integrated into mathematical instruction include students’ lack of basic skills and poor mathematical background, indiscipline and immaturity. The results of the study indicate that, unlike the participants at the high-SES school, the participants at the low-SES school, failed to involve their students in lessons that capitalized on the powerful characteristics of graphing calculators including the potential of the graphing calculator as an investigation tool, a visualization tool or a tool for exploring and discovering mathematical concepts. This shows how the interactions with the context affected the participants’ perceptions regarding the use of graphing calculator.
While comparing her students with those of a high-SES school, whom she perceived as having a strong mathematical background and strong math skills, Lorna argued that the graphing calculator use was different in the two contexts in the sense that at the high-SES school the graphing calculator was used to help students learn higher-level math while at the low-SES school it was used to help students get answers. This shows how Lorna’s perception would change if the context was different. According to Lorna, a perturbation of the situational context would occur through holding the students to high expectations, tackling the discipline and immaturity, and working on improving the students’ mathematical skills; a change that she argued should begin at middle school. This perturbation would bring about a change in the interactions among the components in the model, ultimately affecting the nature of using the graphing calculator. Therefore, the school and classroom environment afford certain conditions that influence the teacher and students’ actions and interactions with the graphing calculator within the classroom.
One can, therefore, trace the entanglement and interconnection that exists between the context and the contextual components and the use of graphing calculator. For example, a child from a low-SES background is more likely to have a poor mathematics background and a low skill base. This child is also likely to be in a school where the teachers do not hold students to high expectations and may in fact, throughout his/her high school life be tracked into lower-level classes where the appropriate use of graphing calculators is limited. The child is also more likely to not have the physical access to a graphing calculator at home.
The participants’ interaction with the subject matter is also worth noting because, similar to Simmt’s (1997) findings, their philosophies of teaching and learning mathematics influenced their perceptions of the use of graphing calculators. Moreover, some of the topics lent themselves to using the graphing calculator like the graphing unit showing how the subject matter influenced how, when, and for what activities the graphing calculator was used.
The results also indicate that that, unlike the lack of consensus of the participants in Fleener’s (1995b) study on whether or not calculators should be used until students had achieved conceptual mastery, these participants all seemed to agree that conceptual mastery should precede the use of graphing calculators. In addition, the participants feared students’ dependency on graphing calculators and their negative effects to the students’ computational skills. This seems to contradict findings of existing research, which indicate the contrary. This disconnect can be attributed to the challenge the participants faced of integrating graphing calculators into instruction and/or their own beliefs about graphing calculators. For this reason, teacher education programs should give teachers opportunities to reflect on their personal philosophies and beliefs about graphing calculators (Lee & McDougall, 2010), combined with reflection on their beliefs about mathematics, its teaching and learning (Simmt, 1997). According to Kastberg and Leatham (2005), these opportunities to reflect should be accompanied by opportunities to experience teaching and learning with graphing calculators. One of the ways of doing so is through exposure to research on how teachers have effectively used graphing calculators in their classrooms (Doerr & Zangor, 2000). These considerations will, thus, ensure the perturbation of teacher’s beliefs so that they are informed by the current research and connected to their own mathematical understandings.
With this framework, one can identify the circumstances where internal or external factors constrained or enhanced the participants’ use of graphing calculators and how the interaction of the components influenced the nature of graphing calculator use. Since the perturbation in one of the interactions affects all the other interactions, it is important to determine the requisite changes and perturbations that would result in the effective use of the graphing calculator as a tool of educational reform. In other words, efforts should be made to ensure that teachers engage their students in the types of instruction and learning opportunities that entail appropriate use of the graphing calculators. This is important for the use of the graphing calculator, as a tool of educational reform, to achieve the NCTM’s (2000) equity goal, rather than to end up exacerbating the already existing inequities between students of high-SES and low-SES schools. The continuous interactions of the components of this framework, thus, suggest that equity issues in connection to the nature of graphing calculator should be an ongoing process that is continuously locating for strategies that will afford all students appropriate access and use of graphing calculators. This framework also points out that the challenge of integrating graphing calculator into mathematics teaching and learning is related to humans than technology, and that the nature and impact of graphing calculator use can best be understood when studied in the context in which it takes place.
This research was previously published in the International Journal of Online Pedagogy and Course Design (IJOPCD), 6(2); edited by Chia-Wen Tsai and Pei-Di Shen, pages 29-45, copyright year 2016 by IGI Publishing (an imprint of IGI Global).
Abramovich, S. (2014). Revisiting mathematical problem solving and posing in the digital era: Toward pedagogically sound uses of modern technology. International Journal of Mathematical Education in Science and Technology , 45(7), 1034–1052. doi:10.1080/0020739X.2014.902134
Berger, M. (1998). Graphic calculators: An interpretive framework. For the Learning of Mathematics , 18(2), 13–20.
Bogdan, R., & Biklen, S. K. (2003). Qualitative research for education: An introduction to theory and methods . Boston, MA: Pearson Education Group, Inc.
Century, J. (1994). Making sense of the literature on equity in education . Newton, MA: Educational Development Center, Inc., Statewide Systemic Initiative Equity Leadership Institute.
Doerr, H. M., & Zangor, R. (2000). Creating meaning for and with the graphing calculator. Educational Studies in Mathematics , 41(2), 143–163. doi:10.1023/A:1003905929557
Fleener, M. J. (1995b). A survey of mathematics teachers' attitudes about calculators: The impact of philosophical orientation. Journal of Computers in Mathematics and Science Teaching , 14, 481–498.
Gutiérrez, R. (2002). Enabling the practice of mathematics teachers in context: towards a new equity research agenda. Mathematical Thinking and Learning , 4(2-3), 145–187. doi:10.1207/S15327833MTL04023_4
Hennessy, S., & Dunham, P. (2002). Equity issues affecting mathematics learning using ICT . In Winter, J., & Pope, S. (Eds.), Research in mathematics education (pp. 145–165). London: British Society for Research into Learning Mathematics. doi:10.1080/14794800008520107
Kastberg, S., & Leatham, K. (2005). Research on graphing calculators at the secondary level: Implications for mathematics teacher education. Contemporary Issues in Technology & Teacher Education , 5(1), 25–37.
Lee, J., & McDougall, D. (2010). Secondary school teachers' conceptions and their teaching practices using graphing calculators. International Journal of Mathematical Education in Science and Technology , 41(7), 857–872. doi:10.1080/00207391003777889
Lubienski, S. T. (2001). Are the NCTM standards reaching all students? An examination of race, class, and instructional practices. Paper presented at the annual meeting of the American Educational Research Association, Seattle.
Martin, D. B. (2000). Mathematics success and failure among African-American youth . New Jersey: Lance Erlbaum Associates.
McCulloch, A. W. (2011). Affect and graphing calculator use. The Journal of Mathematical Behavior , 30(2), 166–179. doi:10.1016/j.jmathb.2011.02.002
Mickelson, R., & Southworth, S. (2005). When opting out is not a choice: Implications for NCLB's transfer option from Charlotte, North Carolina. Equity & Excellence in Education , 38, 249–263. doi:10.1080/10665680591002632
National Council of Teachers of Mathematics. (2000). Principles and standards for school mathematics . Reston, VA: Author.
National Council of Teachers of Mathematics. (2005). Computation, calculators, and common sense: A position of the National Council of Teachers of Mathematics. Retrieved from http://www.sdctm.org/documents/newsletter/NCTMcomputation.pdf
National Council of Teachers of Mathematics Research Committee. (2005). Equity in school mathematics education: How can research contribute? Journal for Research in Mathematics Education , 36(2), 92–100.
Penglase, M., & Arnold, S. (1996). The graphics calculator in mathematics education: A critical review of recent research. Mathematics Education Research Journal , 8, 58–90.
Perry, T., Steel, C., & Hilliard, A. (2003). Young, gifted and black. Promoting high achievement among African American students . Boston: Beacon Press.
Rachel, K. (2014). Investigating a link between pre-calculus students' uses of graphing calculators and their understanding of mathematical symbols. The International Journal for Technology in Mathematics Education , 4, 157–166.
Secada, W. (1994). Equity in restructured schools. NCRMSE Research Review, 3(3), 11-13. University of Wisconsin- Madison, Wisconsin Center for Educational Research, Madison, WI.
Simmt, E. (1997). Graphing calculators in high school. Journal of Computers in Mathematics and Science Teaching , 16, 269–289.
Smith, D., & Smith, B. (2006). Perceptions of violence: The views of teachers who left urban schools. High School Journal , 89(3), 34–42. doi:10.1353/hsj.2006.0004
Struchens, M. E., & Silver, E. A. (2000). NAEP findings regarding race/ethnicity: The students, their performance, and their classrooms . In Silver, E. A., & Kenney, P. A. (Eds.), Results from the seventh mathematics assessment of the National Assessment of Educational Progress (pp. 45–72). Reston, VA: National Council of Teachers of Mathematics.
Tornroos, J. (2005). Mathematics textbooks, opportunity to learn and student achievement. Studies in Educational Evaluation , 31(4), 315–327. doi:10.1016/j.stueduc.2005.11.005
Vygotsky, L. S. (1978). Mind in society: The development of higher psychological processes . Cambridge, MA: Harvard University Press.