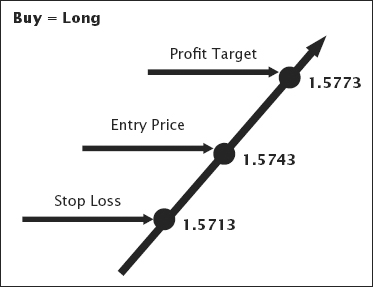
FIGURE 2.1 Concept of a Long Trade
This chapter starts with an explanation of how currencies are bought or sold in the market. We then decode a forex contract for long and short. The chapter also explains the three critical points in every trade and points out the bid/ask spread that brokers charge for each trade. This chapter also presents the four reasons that cause currencies to fluctuate on a daily basis. We then turn to the fraction theory, which helps us to decide on a long or short trade. The chapter ends with an explanation of how charts are read and how market structure is identified.
Forex traders make money by speculating on the movement of currency rates. There are only two ways to do this. The first way is to buy, expecting prices to rise. The second way is to sell, expecting prices to fall.
The current rate for AUD/USD is now 1.0325. You enter into a buy position because you expect the Australian dollar to strengthen further against the U.S. dollar. A buy trade is termed a “long position” in the forex market.
After three hours, the AUD/USD rate is at 1.0375. You were right, and you made 50 pips on this trade. Another way of saying this is that your long position took profit. Let’s have a look at Example 2.1 for an exact contract.
| Action | AUD | USD |
| Buy AUD100,000 at the current AUD/USD rate of 1.0325. | + 100,000 | − 103,250 |
| 3 hours later, sell AUD100,000 at the rate of 1.0375. | − 100,000 | + 103,750 |
| Total profit earned USD 500 | 0 | + 500 |
The current rate for EUR/USD is at 1.3142. You enter into a sell position because you expect the euro to further weaken against the U.S. dollar. A sell trade is termed a “short position” in the forex market.
After two hours, the EUR/USD rate is at 1.3112. You were right, and you made 30 pips on this trade. Another way of saying this is that your short position took profit. Let’s have a look at Example 2.2 for an exact contract.
| Action | EUR | USD |
| Sell 200,000 euros at the current EUR/USD rate of 1.3142. | − 200,000 | + 262,800 |
| 2 hours later, buy back 200,000 euros at the rate of 1.3112. | + 200,000 | − 262,240 |
| Total profit earned USD 600 | 0 | + 600 |
When you execute a position, there are essentially three points in every trade: entry price, profit target, and stop loss.
The entry price is defined as the price at which a trade is triggered. The profit target is defined as the price where the trade exits with a profit. The stop loss is defined as the price where the trade exits with a loss.
Let’s use an example for both a long and a short position.
Let’s take the current GBP/USD price as 1.5743. Because you expect the pound to appreciate against the U.S. dollar, you enter into a long position.
You decide to take a profit of 30 pips and a stop loss of 30 pips. Once these values are locked down in the broker’s platform, only two things can happen: The trade will hit either the profit target or the stop loss.
In this example:
Figure 2.1 reflects this trade.
FIGURE 2.1 Concept of a Long Trade

For a long position, the profit target is located above the entry price while the stop loss is located below the entry price. In this example, you take an equal amount of pips for the exit: 30 pips above the entry price and 30 pips below the entry price.
Whenever a trade reflects an equal distance between the entry price to the profit target and between the entry price to the stop loss, the trade is said to have a risk to reward ratio of 1:1. Figures 2.2 and 2.3 show an actual progression of a long trade that took profit.
FIGURE 2.2 Enter for Long Position
Source: Created with FX Primus Ltd, a PRIME Mantle Corporation PLC company. All rights reserved.
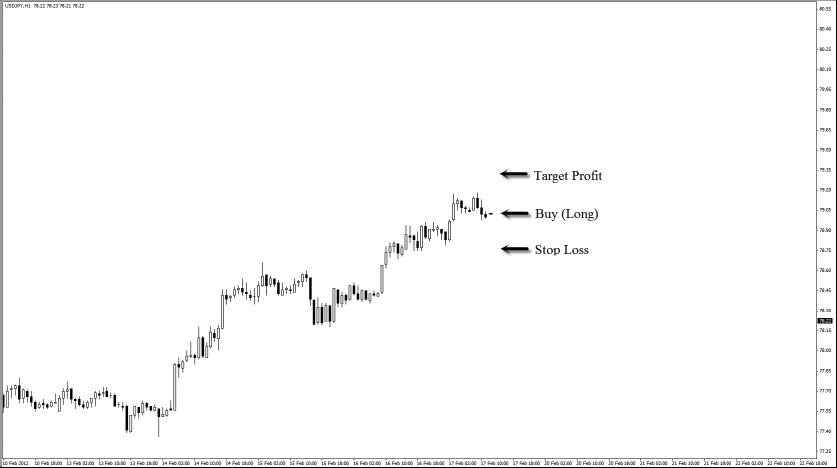
FIGURE 2.3 Exit with a Profit
Source: Created with FX Primus Ltd, a PRIME Mantle Corporation PLC company. All rights reserved.

Figures 2.4 and 2.5 show an actual progression of a long trade that hit a stop loss.
FIGURE 2.4 Enter for Long Position
Source: Created with FX Primus Ltd, a PRIME Mantle Corporation PLC company. All rights reserved.
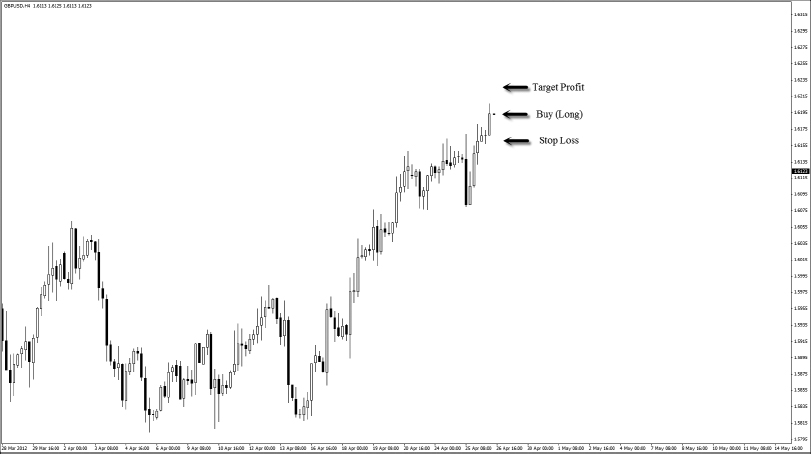
FIGURE 2.5 Exit with a Stop Loss
Source: Created with FX Primus Ltd, a PRIME Mantle Corporation PLC company. All rights reserved.

Let’s take the current NZD/USD price as 0.8138. You expect the New Zealand dollar to fall against the U.S. dollar; hence, you enter into a short position.
You decide to take a profit of 60 pips and a stop loss of 30 pips. Once these values are locked down in the broker’s platform, only two things can happen: The trade will hit either the profit target or the stop loss.
In this example:
Figure 2.6 reflects this trade.
FIGURE 2.6 Concept of a Short Trade
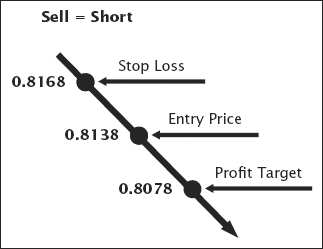
For a short position, the profit target is located below the entry price while the stop loss is located above the entry price. In this example, you set a 30 pip stop loss but a profit target of 60 pips. This is termed a 1:2 risk to reward ratio.
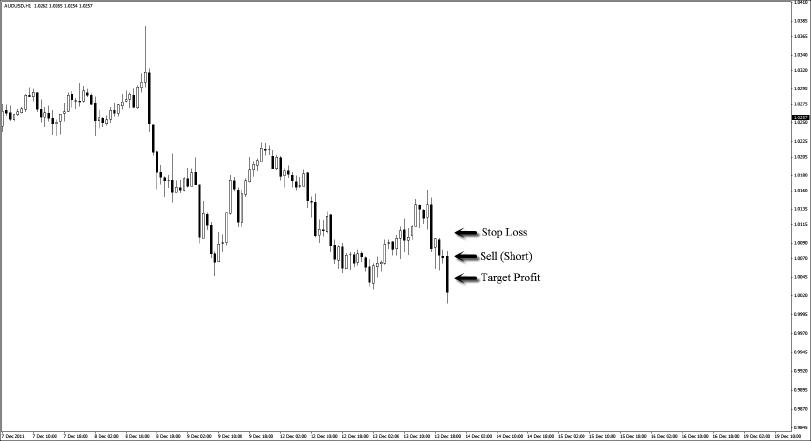
Figures 2.7 and 2.8 show an actual progression of a short trade that took profit.
FIGURE 2.7 Enter for a Short
Source: Created with FX Primus Ltd, a PRIME Mantle Corporation PLC company. All rights reserved.
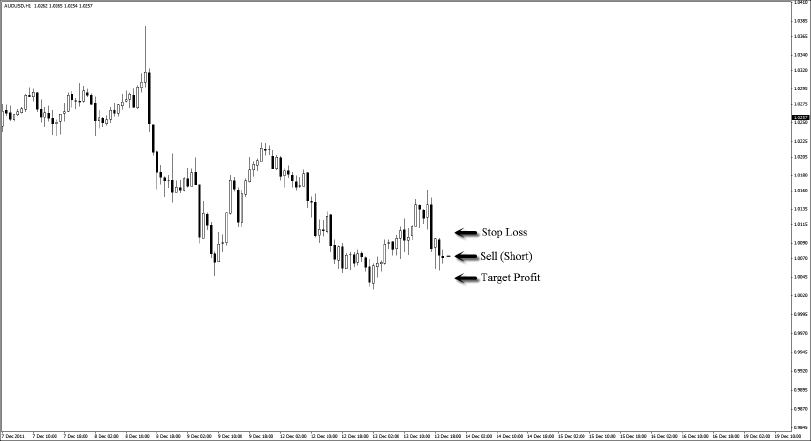
FIGURE 2.8 Exit with a Profit
Source: Created with FX Primus Ltd, a PRIME Mantle Corporation PLC company. All rights reserved.
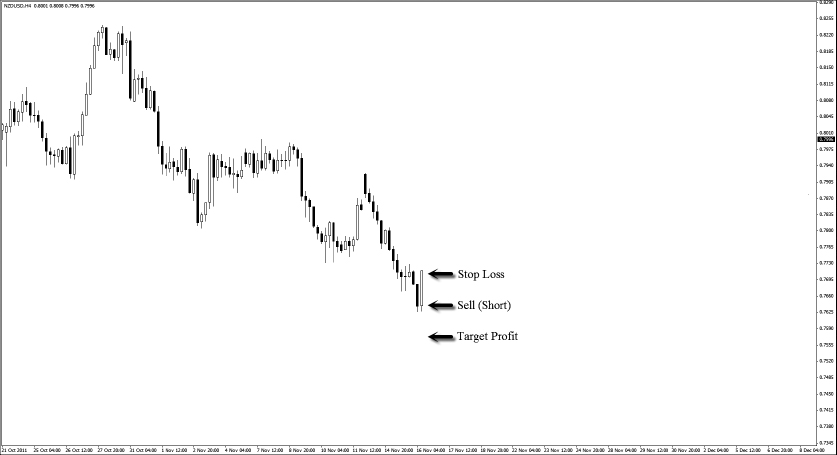
Figures 2.9 and 2.10 show an actual progression of a short trade that hit a stop loss.
FIGURE 2.9 Enter for a Short
Source: Created with FX Primus Ltd, a PRIME Mantle Corporation PLC company. All rights reserved.
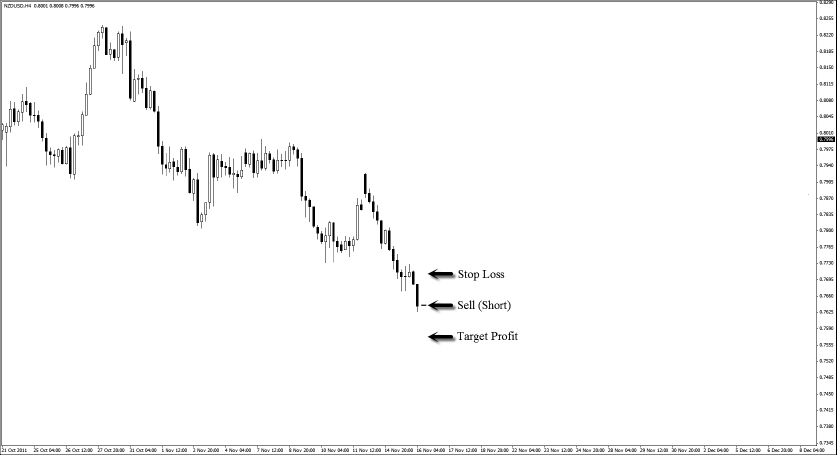
FIGURE 2.10 Exit with a Loss
Source: Created with FX Primus Ltd, a PRIME Mantle Corporation PLC company. All rights reserved.
The greatest lesson in this segment is this: Always put a stop loss for every trade. To most traders, having a profit target is second nature, but hardly anyone thinks about putting a stop loss. The purpose of a stop loss is simple yet critical. It is essentially a level that tells you to exit the trade with an acceptable loss because the trade is not going your way.
Far too many times in my career as a trader and coach, I have seen countless traders blow up their accounts simply because they refuse to put a stop loss for every trade. When it comes to trading the forex market, we will never be right all the time. The purpose of a stop loss is to help us, not harm us.
Traders run the risk of blowing up their entire account by leaving a trade “naked,” or without a stop loss. Do not adopt this practice. Interestingly enough, the same group of traders who blow up their accounts by not placing a stop loss is the same group who walks away from the forex market thinking that it’s risky.
So far, we have been talking about forex prices as a single quote. In reality, there are actually two quotes for each price: the bid price and the ask price. The bid price is the price at which the trader selects to sell. It is also the price at which the broker is willing to buy.
The ask price is the price at which the trader selects to buy. It is also the price at which the broker is willing to sell. The difference between the bid price and the ask price is known as the spread. The spread is the transaction fee that the broker charges for executing a trade.
In Figure 2.11, the EUR/USD quote is given as 1.3089/1.3091.
FIGURE 2.11 EUR/USD Quote on FXPRIMUS Market Watch
Source: Created with FX Primus Ltd, a PRIME Mantle Corporation PLC company. All rights reserved.
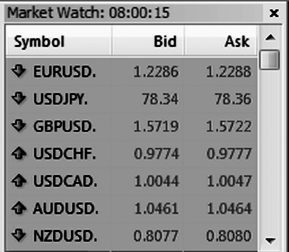
This figure tells us that the bid price is 1.3089 and the ask price is 1.3091. We can also infer that the spread is 2 pips. This means that the broker FXPRIMUS charges a transaction fee of 2 pips for every trade that is executed on its platform.
If you believe that the EUR/USD will rise, you would click “Buy,” and the trade will be triggered on the ask price of 1.3091. If you believe that the EUR/USD will fall, you would click “Sell,” and the trade will be triggered on the bid price of 1.3089.
There are three important facts for us to take note when it comes to spread:
Typically, spreads on more liquid pairs are smaller, with illiquid pairs reflecting higher spreads. Since every forex quote is accompanied by both the bid and the ask price, when you execute a buy or long position, you enter on the ask price and exit on the bid price.
Figure 2.12 shows an example. To earn 30 pips, the market has to move 32 pips.
FIGURE 2.12 Long Position on EUR/USD
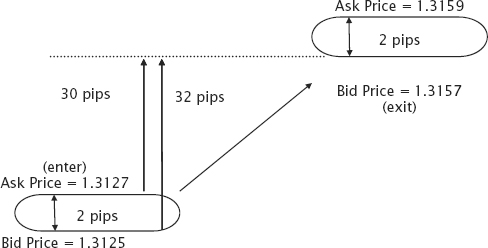
With a spread of 2 pips on the EUR/USD, a long position is executed on the ask price of 1.3127. To make 30 pips profit, the market has to move 32 pips to cover the pip spread that is paid to the broker. The long position is then exited on the bid price of 1.3157.
Similarly, when you execute a sell or short position, you enter on the bid price and exit on the ask price. Figure 2.13 shows an example. To earn 30 pips, the market has to move 33 pips.
FIGURE 2.13 Short Position on GBP/USD
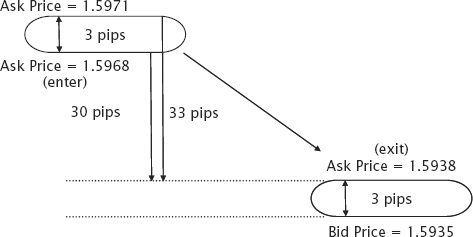
With a spread of 3 pips on the GBP/USD, a short position is executed on the bid price of 1.5968. To make 30 pips profit, the market has to move 33 pips to cover the pip spread that is paid to the broker. The short position is then exited on the ask price of 1.5938.
Now that we have a better understanding of how money is made on the forex market, let’s take a look at reasons that cause currency pairs to move up and down.
The value of a currency rises or falls in relation to the forces of demand and supply. When the demand for a currency exceeds the available supply, the value of the currency tends to rise. Conversely, when the supply of a currency exceeds the available demand, the value of the currency tends to fall.
Let’s look at four of the most important factors that cause prices of currencies to fluctuate: economic factors, political factors, natural disasters, and speculation.
When traders look at economic factors, they are searching for one key word: growth. When growth is non-existent or negative, the value of the country’s currency tends to fall. This is because the currency is not viewed as attractive or valuable, and traders start selling it.
Conversely, when growth is positive, the value of the country’s currency tends to rise. This is because more traders end up buying the currency. Traders look at several economic factors to gain an idea of how a country is performing. Let’s take a look at a couple of them.
Everyone needs to spend, whether on goods or services. Consumer spending directly affects the money supply of a country, which directly affects the country’s currency and subsequent exchange rate with other nations. When consumer spending increases, the general health of the economy increases, and subsequent demand for the country’s currency will lift its value against other currencies.
On the flip side, when consumer spending declines, the economy falters and the general sentiment of the currency turns bad. This causes the country’s currency to fall against other currencies.
As shown in this report:
“The pound rose for a second day versus the dollar after the government’s quarterly economic growth report showed consumer spending rose more than forecast, boosting speculation the country will avoid a recession.”
Bloomberg Businessweek, February 24, 2012
The current account balance is a measure of how much money is flowing out of the country compared with how much is flowing in from foreign sources. If there is a net inflow of funds, the country is said to have a current account surplus. If there is a net outflow of funds, the country is said to have a current account deficit.
Continuous records of current account deficits may lead to a natural depreciation of a country’s currency. This is because money for trade, income, and aid is leaving the country to make payments in a foreign currency. The current account is made up of three components:
Current account = Trade balance + Net income + Unilateral transfers
The trade balance is simply the total value of exports minus the total value of imports. Net income is defined as the difference between money received and money paid out. It includes salaries, interest payments, and dividends. Unilateral transfers include taxes, foreign aid, and one-way gifts.
For most countries, the largest component of the current account is generally the trade balance. As an example, the United States has experienced high current account deficits for the last few decades primarily because of its large trade deficit.
As shown in this report:
“The yen weakened after official data showed Japan had a record current account deficit in January. The yen slid 0.3 percent to 81.33 per dollar as of 8:53 am in Tokyo. It declined 0.2 percent to 106.85 per euro.”
Bloomberg Businessweek, March 8, 2012
In Chapter 7, we will discuss more specific economic news that affects the currency market and how to trade such news for profit.
When a country is mired in a political crisis, demand for its goods and services is affected. These problems would cause foreign capital coming into the country to cease and also cause foreign capital to leave the country. The combined effect leaves the home currency weaker against other currencies.
An upcoming election can also have a big impact on a country’s currency. Traders typically view elections as events that give rise to potential political instability and uncertainty, which equates to greater volatility in the currency.
This effect is more strongly felt when governments change hands. A new government often signifies a change in ideology and management, which translates to new rules, new laws, and new policies that ultimately will affect the value of the currency.
The change in the currency value could be either positive or negative. Political parties that make a stand on promoting economic growth and reining in high government debt levels tend to boost a currency’s value.
As shown in this report:
“Egypt’s pound fell on Wednesday to its lowest level against the U.S. dollar since January 2005 after the biggest anti-government protests of President Hosni Mubarak’s three-decade rule. The pound fell as low as 5.830 against the U.S. currency.”
Reuters, January 26, 2011
Natural disasters, such as earthquakes, tornadoes, and floods, can bring about devastating effects to a country. Loss of life, damaged infrastructure, and abrupt changes to daily living all have a negative impact on the nation’s currency.
Economic output will also be severely affected because of the damage caused. Money that could have otherwise been used to drive economic initiatives is now channeled towards rebuilding supply chains and infrastructure.
The problem is further compounded by a decrease in consumer spending and loss of consumer and investor confidence. Ironically, other nations may benefit from the tragedy because of a jump in import orders from the disaster-stricken nation. All of these factors combined take a toll on the currency of the nation.
As shown in these reports:
“Australia’s currency fell to the lowest level as confidence about growth prospects for the country waned in the wake of heavy flooding in the state of Queensland. The AUDUSD fell 0.5% to buy 99.60 U.S. cents, adding to a loss of 2.5% this week.”
Market Watch, January 6, 2012
“The New Zealand dollar declined in the Asian session on Tuesday after Christchurch, New Zealand’s second-largest city was struck by a strong earthquake. NZD/USD fell from 0.7634 to 0.7550 extending its losses further to just below 0.7500. NZD/USD’s level of 0.74 was last seen on December 28, 2012.”
RTTNews, December 22, 2011
“Indonesia’s rupiah fell to its lowest level in almost three weeks after northwestern Indonesia was hit by a magnitude 8.7 earthquake. Indonesia’s rupiah weakened 0.2 percent to 9,205 per dollar after strengthening 0.4 percent before the quake. It touched 9,208, the weakest level since March 23.”
Bloomberg Businessweek, April 11, 2012
Speculators trade the forex market purely for profit. There are basically two categories of speculators in the market: retail traders and hedge funds. On average, more than 90% of the daily trading volume in the forex market is speculative in nature.
Speculative moves are sometimes called “smart money” or “hot money” because these moves are the first to move in and out of countries. As an example, if speculators believe that a country’s economy has expanded too much and is in danger of overheating, they may get out of the currency in anticipation of cooling measures by the government. This would cause more supply than demand for the currency, causing it to depreciate.
One of the world’s most remembered speculative plays on the forex market happened on September 16, 1992, also known as Black Wednesday. On that fateful day, currency speculator George Soros bet heavily against the pound and made USD1 billion in the process. Two weeks prior to Black Wednesday, currency speculators, including Soros, sold billions of pounds, hoping to buy them back cheaply and profit on the difference.
The British government decided to intervene by hiking interests rates to 12%. The Treasury also tried to prop up the pound by spending £27 billion of reserves. However, the government measures were all but futile.
On the evening of September 16, the British Conservative government announced its exit from the European exchange rate mechanism (ERM), conceding defeat that it could not hold the British pound/Deutsche mark floor of 2.778. Within a few hours of the announcement, the pound tumbled 3% and was down more than 12% within three weeks. In 1997, the UK Treasury estimated the cost of Black Wednesday to be GBP3.4 billion.
Let’s now take a look at the fraction theory, which helps us ascertain long or short trades. Let’s take a look at the EUR/USD currency pair. Instead of writing it in the normal quote of EUR/USD, we write it in the form of a fraction like this:

In this fraction, the euro is the numerator while the U.S. dollar is the denominator. If the numerator becomes bigger while the denominator keeps constant, the entire fraction becomes bigger. This means that if the euro strengthens for whatever reason, the EUR/USD currency pair will head higher. The euro can strengthen for a variety of reasons, and we discuss some of the scenarios throughout the book.
Similarly, if the denominator becomes bigger while the numerator keeps constant, the entire fraction becomes smaller. This means that if the U.S. dollar strengthens for whatever reason, the EUR/USD currency pair will head lower. The crux of the fraction theory is in pairing the strongest currency against the weakest currency at any point of time.
If we pair the strongest currency in the numerator against the weakest currency in the denominator, we get a strong uptrend. Our job in this case is to go long. If we pair the weakest currency in the numerator against the strongest currency in the denominator, we get a strong downtrend. Our job in this case is to go short.
Here’s an example of a strong/weak pairing:
On April 3, 2012, Federal Reserve policy makers announced that they would consider additional stimulus only if the economy lost momentum or if inflation stayed below the 2% target. This contrasted with their January meeting minutes, in which some policy makers saw the economy requiring additional action “before long.” The Federal Open Market Committee minutes were more hawkish than expected and caught the market by surprise, which strengthened the U.S. dollar.
On the same day, Spain held its bond auction program. The auction proved to be a huge disappointment as Spain managed to sell only 2.69 billion euros out of a maximum target of 3.5 billion euros. Additionally, Spanish credit-default swaps widened out to 450 basis points—the highest reading in three months. This event weakened the euro.
Using fraction theory to explain these events, we can say that the euro weakened because of Spain’s disappointing bond auction and the U.S. dollar strengthened because of the hawkish stance by the Federal Reserve. This combined action caused the EUR/USD to plummet, free-falling 300 pips in one day (see Figure 2.14).
FIGURE 2.14 EUR/USD Plummets 300 Pips
Source: Created with FX Primus Ltd, a PRIME Mantle Corporation PLC company. All rights reserved.

There are three types of charts which traders use on the broker’s platform. The three charts include line chart, bar chart, and candlestick chart.
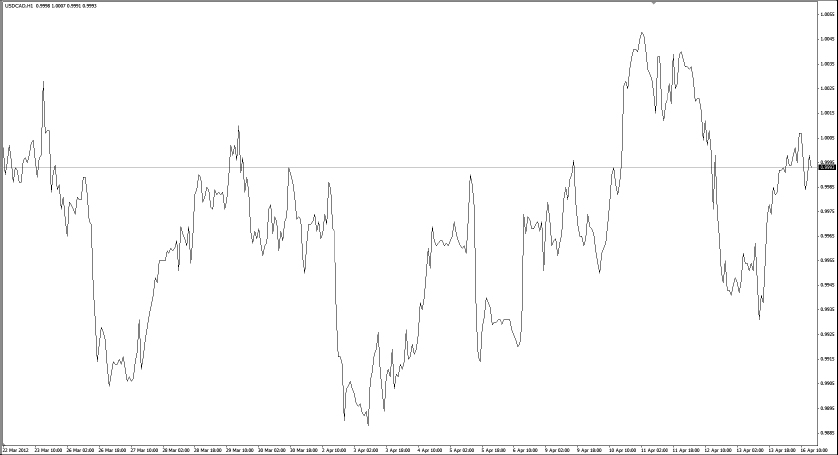
The line chart is plotted by connecting the closing prices over a specific time frame. With a simple line, the price trend of a particular currency can be seen. The line chart is applicable for all currency pairs, across all time frames. As a trader, it is important to select the time frame that you are comfortable with. A short time frame can help you to spot minor trends for quick profits, while a longer time frame can help you to align yourself with the dominant trend.
The simplicity of the line chart comes with one glaring drawback: Because all the line ever records is the closing price, traders are not able to see any drastic moves prior to the close of the period. Hence, traders are not able to utilize vital market information to aid their decision-making process.
Figure 2.15 presents a line chart for USD/CAD using the 5-minute time frame.
FIGURE 2.15 USD/CAD on a 5-Minute Time Frame
Source: Created with FX Primus Ltd, a PRIME Mantle Corporation PLC company. All rights reserved.
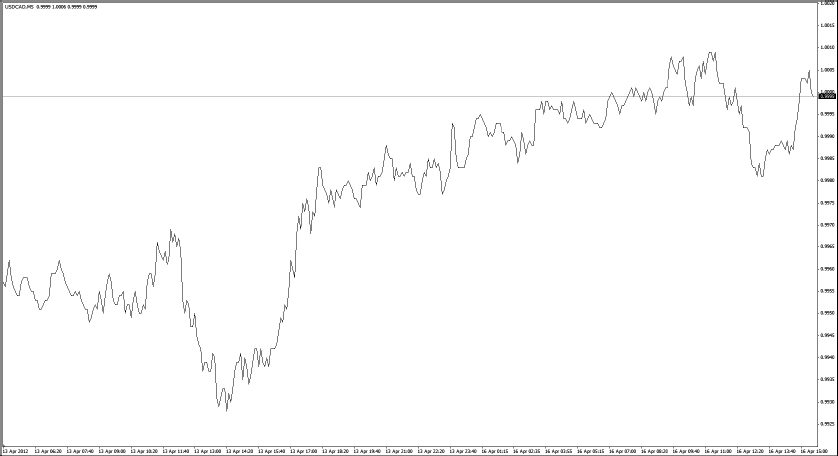
Figure 2.16 presents a line chart for USD/CAD using the hourly time frame.
FIGURE 2.16 USD/CAD on an Hourly Time Frame
Source: Created with FX Primus Ltd, a PRIME Mantle Corporation PLC company. All rights reserved.
A bar chart gives slightly more information than a line chart because it records the open, high, low, and close of the market price for the currency pair. Unlike the line chart, which gives data at only one point in time, the bar chart offers more data about the price changes during the selected time frame. Bar charts are sometimes referred to as OHLC charts, because they capture the price for open, high, low, and close.
Figure 2.17 shows an example of a price bar.
FIGURE 2.17 Price Bar
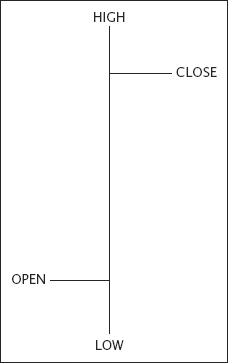
The OHLC readings on bar charts are:
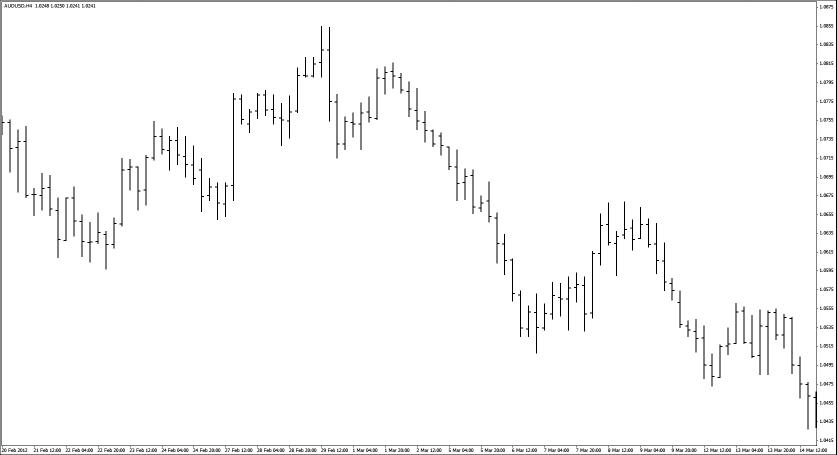
The individual vertical bars in the chart (low and high) indicate the currency pair’s trading range as a whole. Depending on the time frame selected, bar charts can summarize price activity over the past minute, hour, day, or even month.
Figure 2.18 shows the bar chart for USD/JPY in a 15-minute time frame.
FIGURE 2.18 USD/JPY in a 15-Minute Time Frame
Source: Created with FX Primus Ltd, a PRIME Mantle Corporation PLC company. All rights reserved.
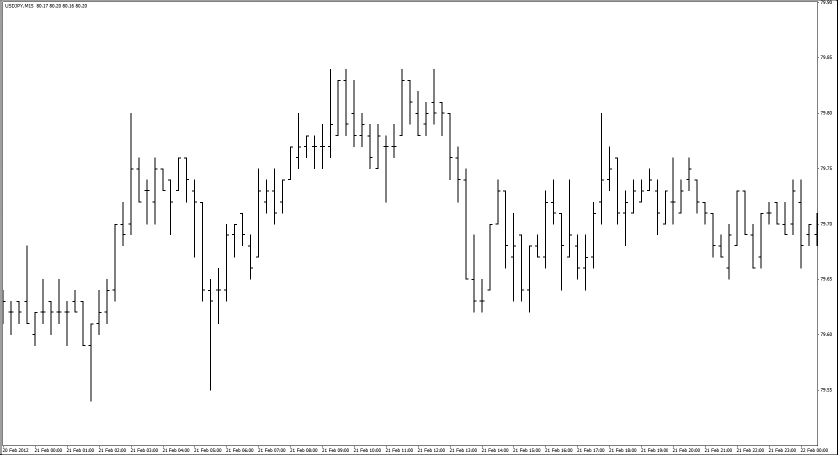
Figure 2.19 shows the bar chart for AUD/USD in a 4-hour time frame.
FIGURE 2.19 AUD/USD in a 4-Hour Time Frame
Source: Created with FX Primus Ltd, a PRIME Mantle Corporation PLC company. All rights reserved.
Candlestick charts were invented by the Japanese in the 1700s to study the movements in the price of rice on Japanese commodity exchanges. Candlestick charts show the same information as bar charts but in a more visually appealing way.
Take a look at the two candlesticks in Figure 2.20.
FIGURE 2.20 Bull and Bear Candlesticks
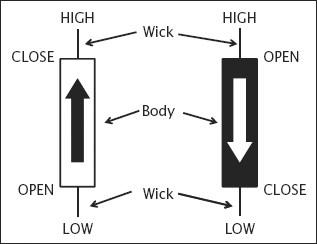
The OHLC readings are the same as with bar charts. Please see the explanatory note before Figure 2.17 for a definition of each reading.
A candlestick is considered bullish if the closing price is higher than the opening price. A candlestick is considered bearish if the closing price is lower than the opening price. In Figure 2.20, the candlestick on the left is considered bullish and the one on the right is considered bearish.
The “real body” of the candlestick represents the range between the opening price and the closing price for a particular time frame. Real bodies can be either long or short.
The “wicks,” or shadows, above and below the candlestick represent the highest and lowest prices reached during a particular time frame. Shadows can be long or short.
Figure 2.21 shows a bullish candlestick on the 30-minute (M30) time frame for the EUR/USD currency pair.
FIGURE 2.21 Bullish Candlestick
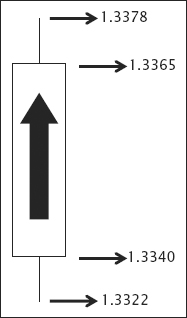
Here’s how we would interpret the candlestick, assuming that the candle started forming at 11 A.M.: At 11 A.M., the price for EUR/USD was 1.3340. At 11:30 A.M., the price for EUR/USD closed higher at 1.3365. In the half-hour period, prices fluctuated such that the highest price reached was 1.3378 and the lowest price reached was 1.3322.
Figure 2.22 shows a bearish candlestick on the 4-hour (H4) time frame for the USD/JPY currency pair.
FIGURE 2.22 Bearish Candlestick
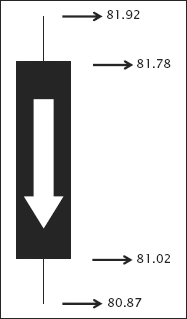
Here’s how we would interpret the candlestick, assuming that the candle started forming at 2 P.M.: At 2 P.M., the price for USD/JPY was 81.78. At 6 P.M., the price for USD/JPY closed lower at 81.02. In the 4-hour period, prices fluctuated such that the highest price reached was 81.92 and the lowest price reached was 80.87.
In summary, reading candlesticks can give us an idea of which group—buyers or sellers—was in control at any point of time.
Now that we understand how to read the candlesticks, let’s turn to market structure. The forex market has three segments: trend, range, and breakout.
A trend can go either up or down. A trend that is moving upwards is called an uptrend. A trend that is moving downwards is called a downtrend.
An uptrend is identified as prices having a series of higher highs and higher lows. The highs are the peaks that prices reach intermittently. The lows are the valleys that prices fall to before heading up again. Hence, an uptrend is formed when there is a series of highs going higher and a series of lows going higher.
Figure 2.23 shows an example of an uptrend.
FIGURE 2.23 Series of Higher Highs and Higher Lows
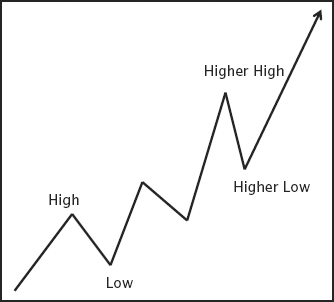
Figure 2.24 shows an example of EUR/USD (1-hour time frame) moving in an uptrend.
FIGURE 2.24 EUR/USD Moving in an Uptrend
Source: Created with FX Primus Ltd, a PRIME Mantle Corporation PLC company. All rights reserved.
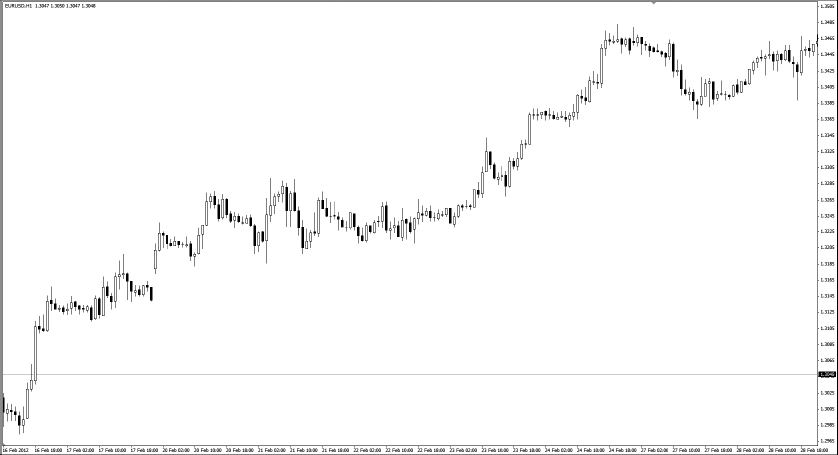
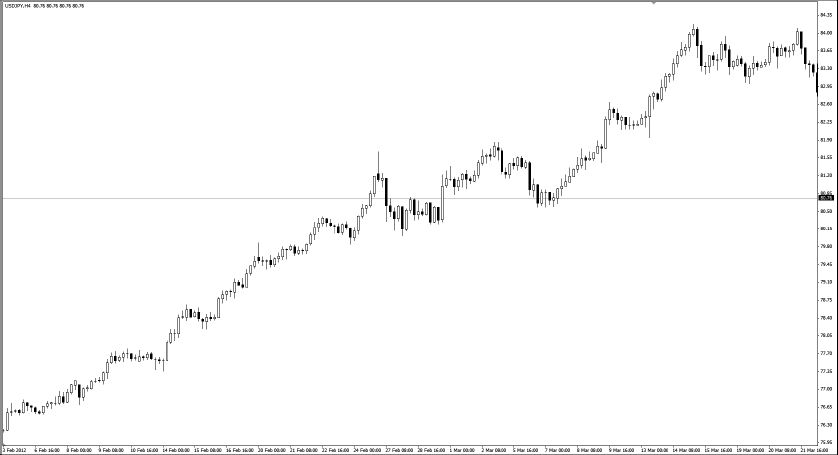
Figure 2.25 shows an example of USD/JPY (4-hour time frame) moving in an uptrend.
FIGURE 2.25 USD/JPY Moving in an Uptrend
Source: Created with FX Primus Ltd, a PRIME Mantle Corporation PLC company. All rights reserved.
A downtrend has prices moving in a series of lower highs and lower lows. (See Figure 2.26.)
FIGURE 2.26 Series of Lower Lows and Lower Highs
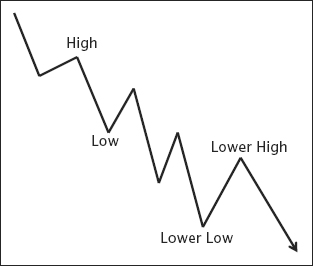
Figure 2.27 shows an example of USD/JPY (1-hour time frame) moving in a downtrend.
FIGURE 2.27 USD/JPY Moving in a Downtrend
Source: Created with FX Primus Ltd, a PRIME Mantle Corporation PLC company. All rights reserved.
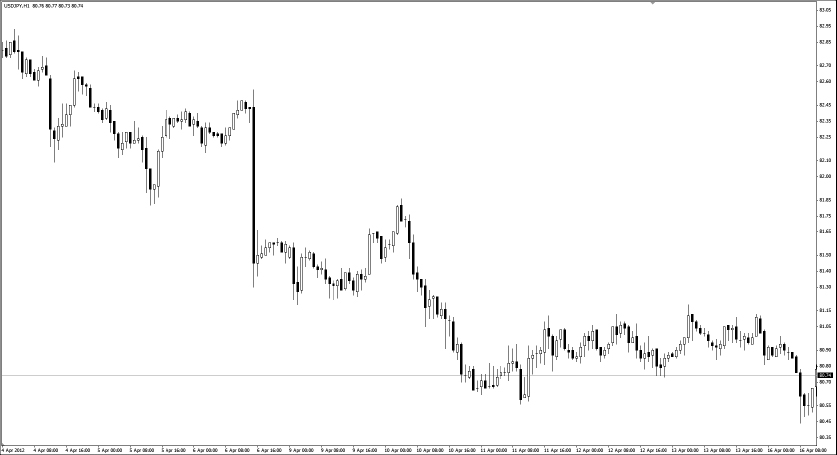
Figure 2.28 shows an example of EUR/AUD (4-hour time frame) moving in a downtrend.
FIGURE 2.28 EUR/AUD Moving in a Downtrend
Source: Created with FX Primus Ltd, a PRIME Mantle Corporation PLC company. All rights reserved.
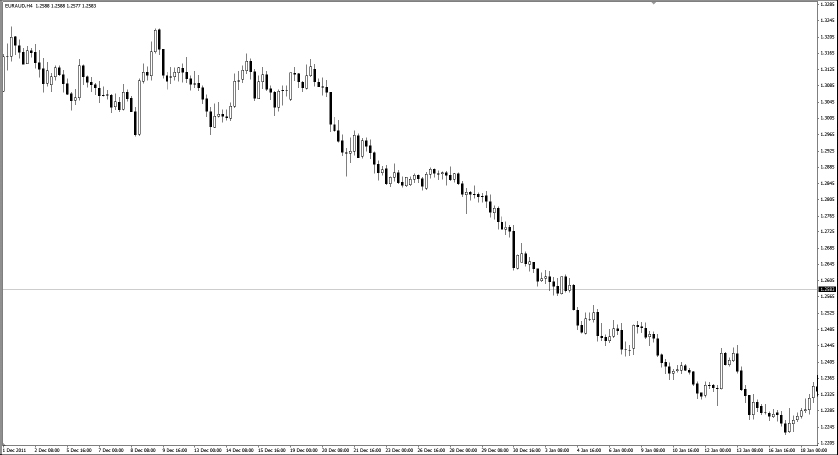
Traders use a trending strategy when the market is moving in an uptrend or a downtrend. When the market is in an uptrend, we would go long. If the market is moving in a downtrend, we would go short.
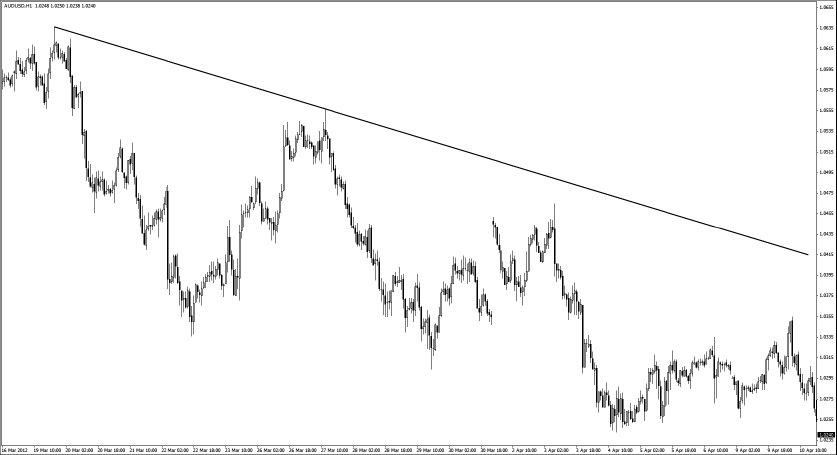
Trend lines are lines that are drawn to show the prevailing direction of price. They are visual representations to give us insight into where prices could go next. In an uptrend, we draw a trend line by joining the significant higher lows. In a downtrend, we draw the trend line by joining the significant lower highs.
The steeper the angle of the trend line, the stronger the momentum. However, it is important to note that trends with steep angles are very often short-lived.
Traders use trend lines to show three things:
Figure 2.29 shows an example of an uptrend line drawn on USD/JPY (4-hour time frame)
FIGURE 2.29 USD/JPY Moving in an Uptrend
Source: Created with FX Primus Ltd, a PRIME Mantle Corporation PLC company. All rights reserved.
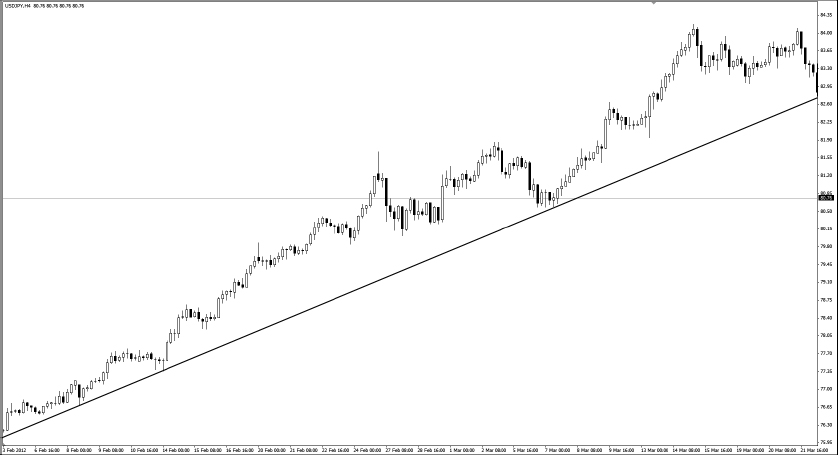
Figure 2.30 shows an example of a downtrend line on the AUD/USD (1-hour time frame)
FIGURE 2.30 AUD/USD Moving in a Downtrend
Source: Created with FX Primus Ltd, a PRIME Mantle Corporation PLC company. All rights reserved.
In an uptrend, it is easy for us to conclude that prices rise because there are more buyers than sellers. However, this is not true. In the forex market, the number of contracts bought always equals the number of contracts sold. As an example, if you want to buy five lots of EUR/USD, the contract must be available from someone who wants to sell it. Conversely, if you want to sell three lots of USD/CHF, someone must be willing to buy it.
Hence, the number of long and short positions in the forex market is always equal. If the number of contracts bought and sold is always equal, why do prices move up and down?
The reason lies in the intensity of emotions between the buyers and the sellers. In an uptrend, the buyers are in control because they don’t mind paying a high price. They buy high because they expect prices to rise even higher. Sellers are nervous in an uptrend, and they agree to sell only at a higher price. The price moves up because the intensity of the buyers’ greed overpowers the fear and anxiety of the sellers. The uptrend starts to fail only when buyers refuse to buy at higher prices anymore.
In a downtrend, the sellers are in control because they don’t mind selling at a low price. They sell low because they expect prices to drop even further. Buyers are nervous in a downtrend, and they agree to buy only at a discount. The price moves down because the intensity of the sellers’ greed overpowers the buyers’ fear and anxiety. The downtrend starts to fail only when sellers refuse to sell at lower prices anymore.
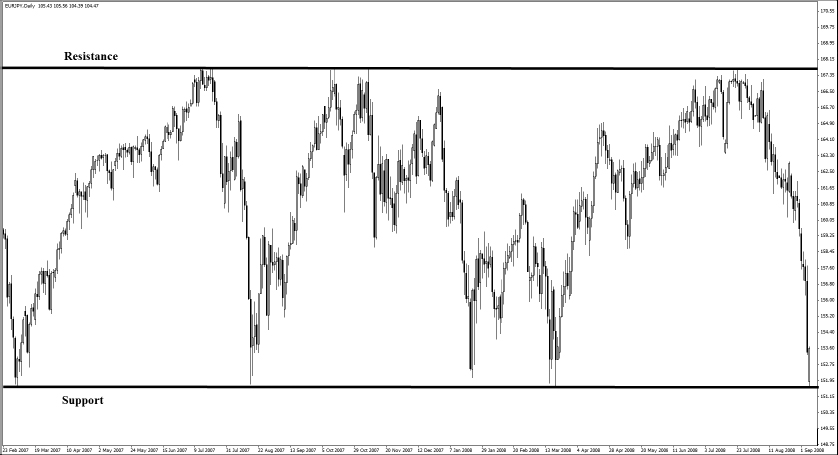
A range occurs when the price is trading in a channel between two borders. Using an analogy of a bouncing rubber ball, the price seems to “bounce” between a floor and a ceiling. The ceiling is called an area of resistance while the floor is called an area of support. (See Figure 2.31.)
FIGURE 2.31 Concept of a Range
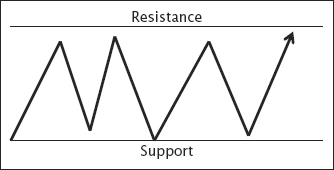
Figure 2.32 shows an example of GBP/JPY (30-minute time frame) moving in a range.
FIGURE 2.32 GBP/JPY Moving in a Range
Source: Created with FX Primus Ltd, a PRIME Mantle Corporation PLC company. All rights reserved.
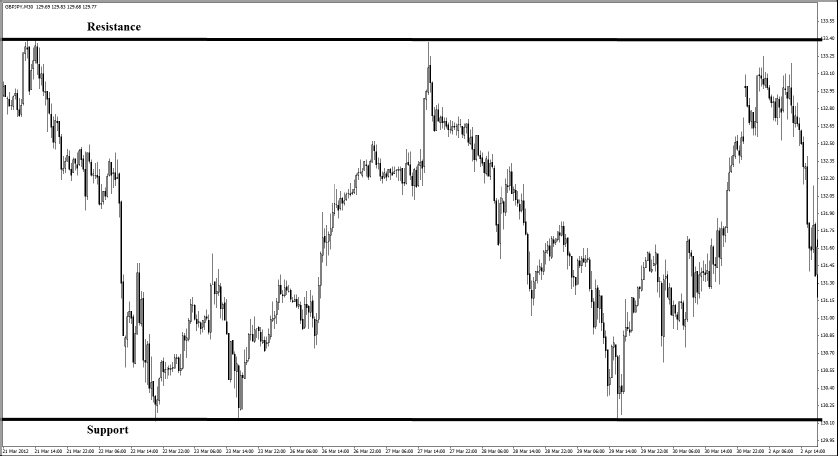
Figure 2.33 shows an example of EUR/JPY (daily time frame) moving in a range.
FIGURE 2.33 EUR/JPY Moving in a Range
Source: Created with FX Primus Ltd, a PRIME Mantle Corporation PLC company. All rights reserved.
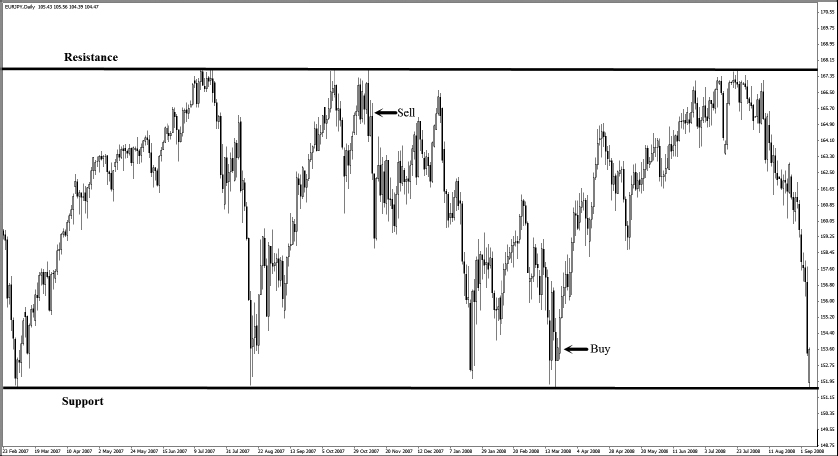
In a range, traders go short once prices bounce off levels of resistance because prices tend to head downwards. Similarly, traders execute long orders once prices bounce off levels of support because prices tend to head upwards.
Figure 2.34 shows an example of where traders place buy and sell orders in a range.
FIGURE 2.34 Concept of a Range
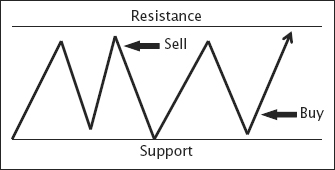
Figure 2.35 shows an example of where traders place buy and sell orders on the GBP/JPY (30-minute time frame).
FIGURE 2.35 GBP/JPY Moving in a Range
Source: Created with FX Primus Ltd, a PRIME Mantle Corporation PLC company. All rights reserved.
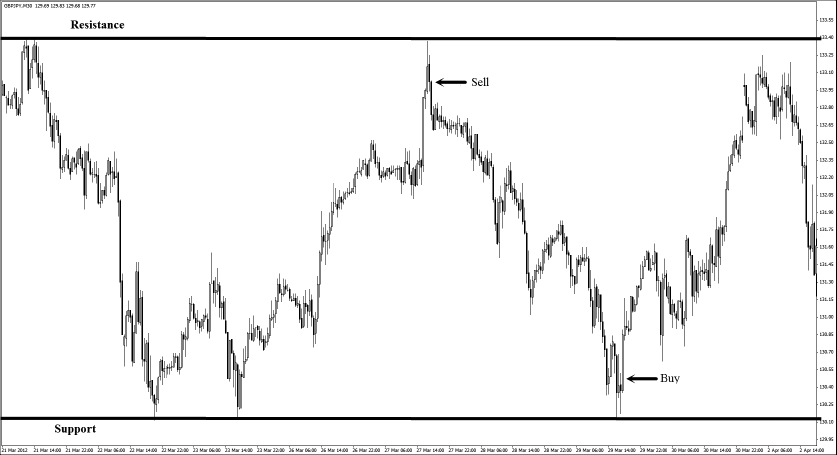
Figure 2.36 shows an example of where traders place buy and sell orders on the EUR/JPY (daily time frame).
FIGURE 2.36 EUR/JPY in a Range
Source: Created with FX Primus Ltd, a PRIME Mantle Corporation PLC company. All rights reserved.
A breakout occurs when prices push above the resistance area or below the support area after bouncing between a trading channel for a period of time. Momentum is greatest on breakout points; hence traders tend to capitalize on these specific movements by going long once prices break upward from a trading range or by going short once prices break downward from a trading range.
Figure 2.37 shows an example of a breakout from the resistance area.
FIGURE 2.37 Breakout from the Resistance Area
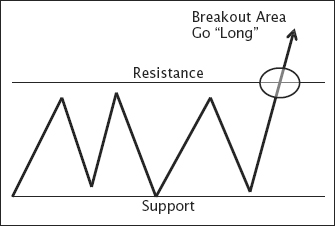
Figure 2.38 shows an example of a breakout on USD/JPY (1-hour time frame).
FIGURE 2.38 USD/JPY Breakout
Source: Created with FX Primus Ltd, a PRIME Mantle Corporation PLC company. All rights reserved.
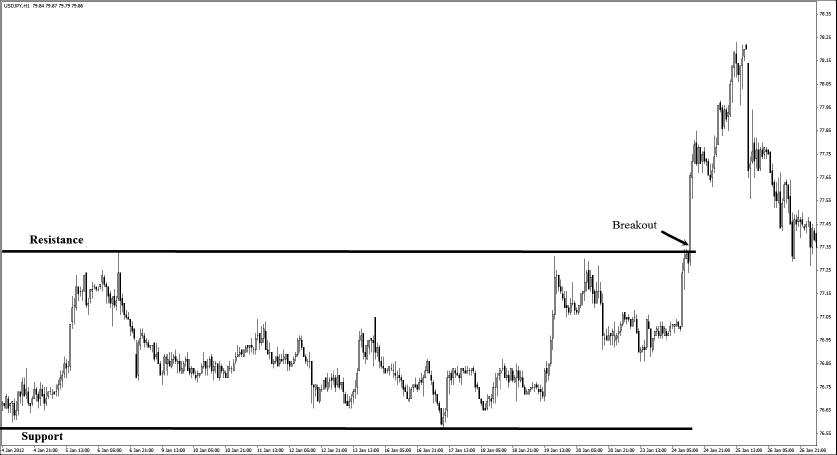
Figure 2.39 shows an example of a breakout on EUR/CHF (daily time frame).
FIGURE 2.39 EUR/CHF Breakout
Source: Created with FX Primus Ltd, a PRIME Mantle Corporation PLC company. All rights reserved.
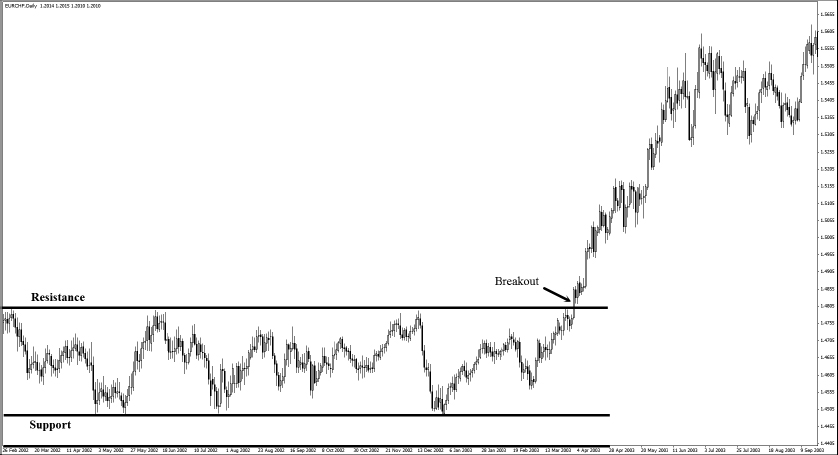
Figure 2.40 shows an example of a breakout from the support area.
FIGURE 2.40 Breakout from the Support Area
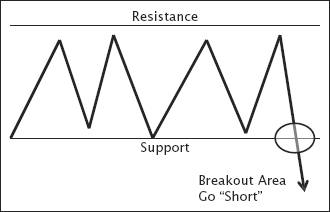
Figure 2.41 shows an example of a breakout on NZD/USD (1-hour time frame).
FIGURE 2.41 NZD/USD Breakout
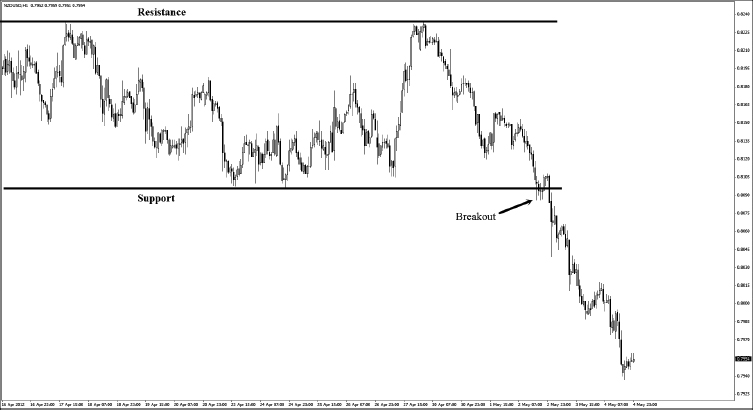
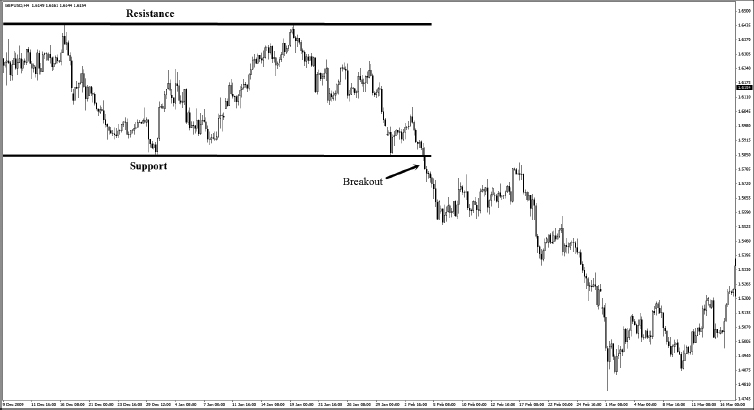
Figure 2.42 shows an example of a breakout on GBP/USD (4-hour time frame).
FIGURE 2.42 GBP/USD Breakout
Traders make money in the forex market by entering long and short trades. Traders go long on a currency pair when they expect the base currency to rise against the counter currency. Traders go short on a currency pair when they expect the base currency to fall against the counter currency.
There are essentially three points in every trade: entry price, stop loss, and profit target. The entry price is the price at which the trade is triggered. The stop loss is a level to cut the trade with a loss when it doesn’t go the intended way. The profit target is a level to exit the trade with a profit when the market moves the intended way.
For a long position, the profit target is located above the entry price, and the stop loss is placed below it. For a short position, the profit target is located below the entry price, and the stop loss is placed above it.
Brokers charge a fee for every long or short trade executed on their platform. This is termed the spread. In general, spreads are lower for the most liquid pairs, such as EUR/USD and USD/JPY. For long positions, traders would execute on the ask price and exit on the bid price. For short positions, traders would execute on the bid price and exit on the ask price.
Four main factors cause forex prices to fluctuate: economic factors, political factors, natural disasters, and speculation. Since currencies are quoted in pairs, the fraction theory helps traders to get a sense of the market’s general direction.
The main crux of the fraction theory is to pair the strongest currency against the weakest currency at any point. If we pair the strongest currency in the numerator against the weakest currency in the denominator, the result will be a strong uptrend. In such cases, it is prudent for traders to go long. If we pair the weakest currency in the numerator against the strongest currency in the denominator, the result will be a strong downtrend. In such cases, it is prudent for traders to go short.
The three most popular ways to read a forex chart are: line chart, bar chart, and candlestick chart. The candlestick chart is the most popular choice of traders worldwide for two reasons. First, the candlestick shows the four most important price points at any given period: the open, high, low, and close prices. Second, it shows the intensity of the fight between the bulls and the bears. This is characterized by the heights of the shadows (the highs and lows) and the lengths of the candlestick bodies.
The forex market can be broken down into three simple structures: trend, range, and breakout. An uptrend occurs when prices move in a consistent fashion of higher highs and higher lows. A downtrend occurs when prices move in a consistent fashion of lower highs and lower lows.
A range occurs when prices tend to bounce between two levels of support and resistance. A breakout occurs when prices move strongly above the level of resistance or strongly below the level of support.