Chapter 6
Strategies for Scalpers
As a scalper, you love strategies characterized by high-volume trading. These strategies are designed to enter the market frequently, taking small profits each time.
Most scalping strategies employ either indicators (including custom indicators) or price action (including candlestick patterns) or a combination of both. Ideally, the strategies should be employed on the lowest time frames available on the broker’s platform.
The two scalping techniques discussed here—rapid fire and piranha—are developed on the M1 (1-minute) and M5 (5-minute) charts respectively. These two time frames give you ample opportunities to enter in and out of the market several times a day. Although scalping can be very exciting, the constant monitoring of market movements can give rise to fatigue and loss of focus.
Hence, you need to know when to take a break or call it a day. Failure to do so could result in unwarranted mistakes. To overcome this, establish simple guidelines or rules for yourself.
As an example, say: “I will take a break after trading for one hour” or “I will stop trading after I hit my daily target of 20 pips.”
Remember, overtrading does not necessarily yield more profits. As a scalper, your most important tools are a very reliable computer, a high-speed Internet connection, and a pot of coffee to help you stay awake.
STRATEGY 1: RAPID-FIRE STRATEGY
The rapid-fire strategy was designed with two criteria in mind:
1. The most liquid currency pair in the world
2. The lowest time frame available
This criterion led to the development of the strategy on the minute chart (M1) for the EUR/USD currency pair.
The M1 time frame is fast-paced and exhilarating. If you are not careful, the adrenaline rush you experience can cloud your trading decisions. This problem is compounded by the high frequency of trading opportunities that the strategy presents. On average, there are about 30 to 40 trading opportunities for the rapid-fire strategy every day.
This is the reason why the rapid-fire strategy employs two indicators to assist you in spotting objective trades throughout the day. You can then fire off the trade rapidly once you decide to take it.
Time Frame
The rapid-fire strategy works with the 1-minute (M1) time frame. Each candlestick on the chart represents 1 minute of price movement.
Indicators
We use these indicators for the rapid-fire strategy:
1. Parabolic SAR with default setting:
a. Step 0.02
b. Maximum 0.2
2. Simple moving average (SMA), period 60, and apply to close.
Parabolic SAR
The “step” is also known as the acceleration factor (AF), and it starts at a minimum value of 0.02. Maximum 0.2 means that the AF can reach a maximum of 0.2, no matter how long the uptrend or downtrend extends. A higher step basically moves the SAR closer to the price action, which makes a reversal more likely. If the step is set too high, the indicator reverses often and produces whipsaws.
The Parabolic SAR is an indicator developed by J. Welles Wilder to find trends in market prices. The acronym “SAR” stands for “stop and reverse.”
SAR(i) = SAR(i − 1) + AF × {EPRICE − SAR(i − 1)}
Where:
SAR (i) = the value of the indicator on the current bar;
SAR(i − 1) = the value of the indicator on the previous bar;
AF = the acceleration factor. This factor is increased by 0.02 each time a new EPRICE is recorded.
EPRICE (Extreme Price) = the highest price reached during the current uptrend or the lowest price during a downtrend. In each trend, when the price reaches a new high or low, the EPRICE will be updated to that value.
Traders utilize the positions of the Parabolic SAR to generate buy or sell signals. A bullish signal is generated when the dots of the Parabolic SAR is below the price, causing traders to expect the upward momentum to continue. Conversely, a bearish signal is generated when the dot is above the price, causing traders to expect the downward momentum to continue.
The indicator works extremely well when markets are moving in a trend.
Simple Moving Average 60
A simple moving average (SMA) is calculated by adding the price of the candlestick over a given number of periods and then dividing this total sum by the number of periods. Since this strategy uses minute candlesticks, SMA 60 (apply to close) is the sum of closing prices for 60 candles divided by 60. The figures are dynamic, which means that old data are dropped as new ones are added. This rolling figure causes the moving average to move along the time scale.
The most common use of the SMA is to identify the direction of market momentum. When the market price is above the moving average, the market is deemed to have a bullish momentum and traders will look for an entry to go long. When the market price is below the moving average, the market is deemed to have a bearish momentum and traders will look for an entry to go short.
Currency Pairs
The strategy is designed specifically for the EUR/USD, the most traded currency pair in the world.
Strategy Concept
The strategy concept is a trend-scalping strategy, which means it works best in a trend. The strategy combines two trend indicators, SMA 60 and Parabolic SAR with default setting (step 0.02). The SMA 60 is used to identify the direction of the momentum. This means that we look to long EUR/USD when the price is above the SMA 60. Similarly, we look to short EUR/USD when the price is below the SMA 60.
The Parabolic SAR is used to give the exact entry signal for both long and short positions. When the price for EUR/USD goes above the Parabolic SAR, we fire off a long trade. When the price for EUR/USD goes below the Parabolic SAR, we fire off a short trade.
Long Trade Setup
Here are the steps to execute a long trade using the rapid-fire strategy:
1. Look for the market price to go above the SMA 60.
2. Wait for the Parabolic SAR to move above the market price.
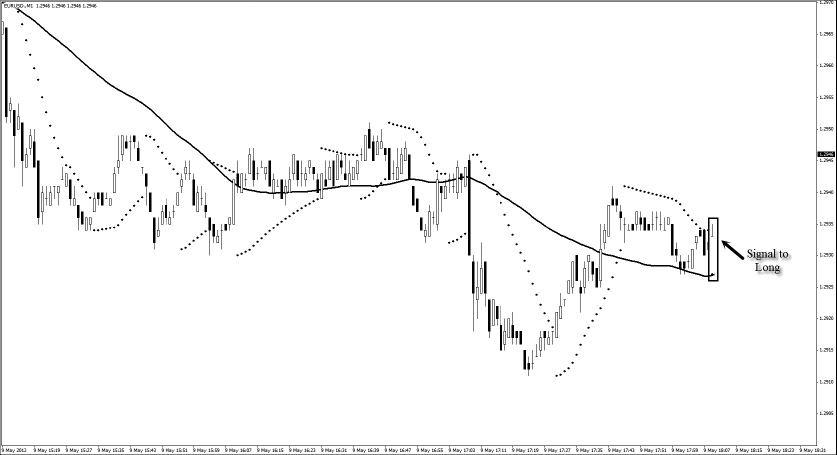
3. Once the market price goes above the Parabolic SAR, the Parabolic SAR will appear below the market price. This is the signal to enter for long. (See
Figure 6.1.)
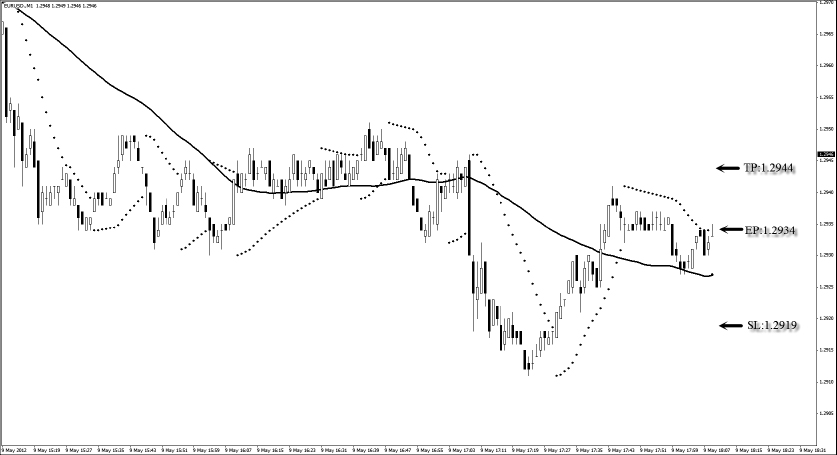
4. The stop loss is set at 15 pips below the entry price.
5. The profit target is set at 10 pips above the entry price. (See
Figure 6.2.)
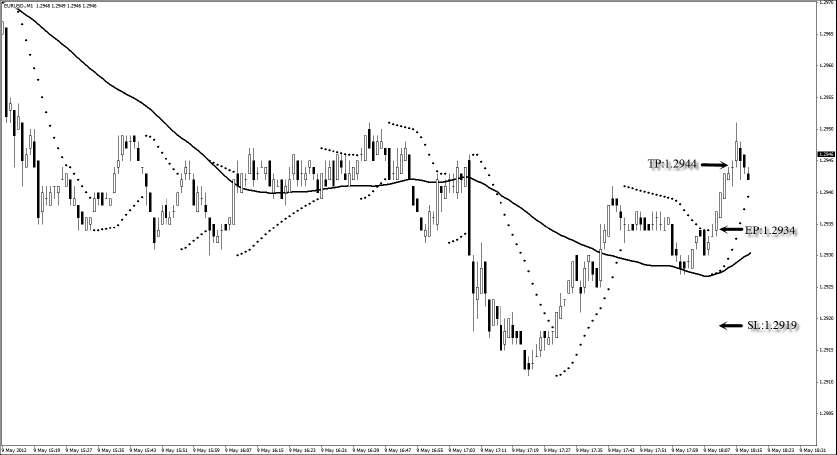
From the long example in Figure 6.3:
Entry price = 1.2934
Stop loss = 1.2919
Profit target = 1.2944
The risk for this trade is 15 pips, and the reward is 10 pips. The risk to reward ratio is 1.5:1, which yields a 2% return if we take a 3% risk.
Short Trade Setup
Here are the steps to execute a short trade using the rapid-fire strategy:
1. Look for the market price to go below the SMA 60.
2. Wait for the Parabolic SAR to move below the market price.
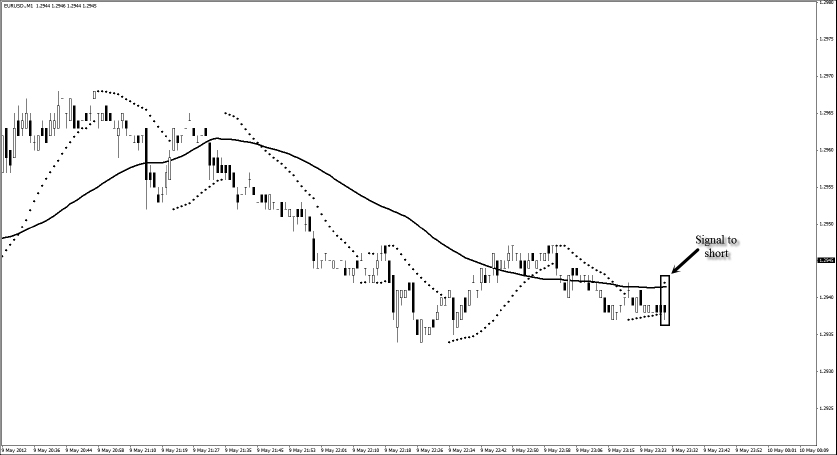
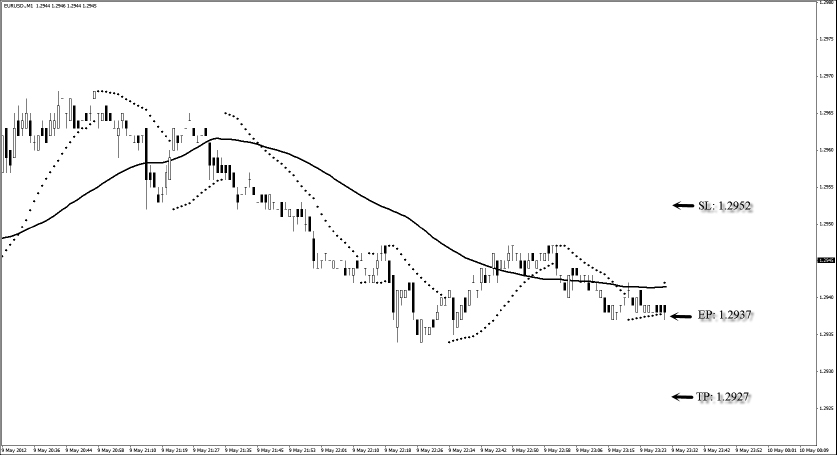
3. Once the market price goes below the Parabolic SAR, the Parabolic SAR will appear above the market price. This is the signal to enter for short. (See
Figure 6.4.)
4. Set the stop loss at 15 pips above the entry price.
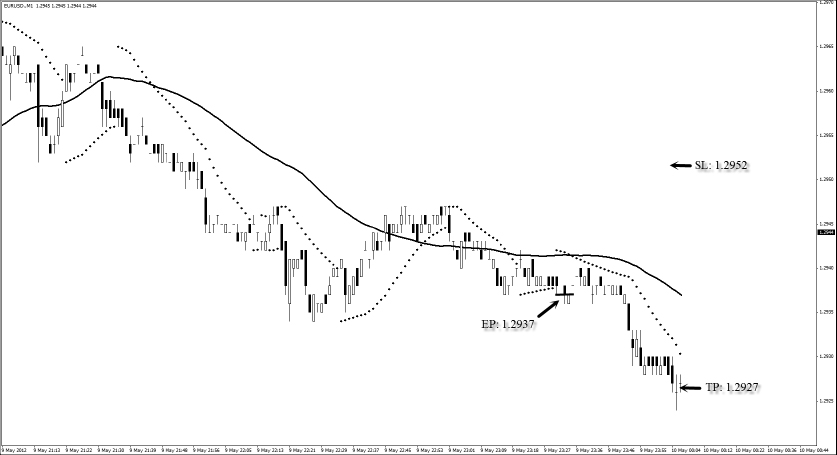
5. Set the profit target at 10 pips below the entry price. (See
Figure 6.5.)
From the short example in Figure 6.6:
Entry price = 1.2937
Stop loss = 1.2952
Profit target = 1.2927
The risk for this trade is 15 pips, and the reward is 10 pips. The risk to reward ratio is 1.5:1, which yields a 2% return if we take a 3% risk.
Strategy Roundup
The rapid-fire strategy could give you another trade signal even before the current trade exits. It is not uncommon to encounter consecutive trading signals one after the other, simply because of the low time frame used.
As a scalper, you have to decide how to manage the trades, especially when the setups come fast and furious. Do you exit the previous trade before entering a new one, ignore any new trade signals until the current trade exits, or simply fire off whenever there is a trade signal?
Remember, the rapid-fire strategy works best in a trending environment. It requires fast thinking and nimble reactions. It is most suitable for action-driven traders who can maintain their composure while in the thick of action.
STRATEGY 2: PIRANHA STRATEGY
The forex market spends most of its time either in a trend or in a range. The rapid-fire scalping strategy works best in a trend. The piranha strategy was developed to work when markets move in a range.
Let us get right into the world of the piranhas. Piranhas take small frequent bites off their prey until it is totally devoured. Although a single bite may not cause much harm, the frequency of the bites causes the attack to be deadly. In much the same way, the piranha strategy was developed to give scalpers ample opportunities to bite the market and chew off small profits each time.
This strategy is designed specifically for the GBP/USD currency pair, using the 5-minute (M5) time frame. On average, there are about 15 to 20 trading opportunities for the piranha strategy every day.
Time Frame
The piranha strategy works with the 5-minute (M5) time frame. This means that each candlestick on the chart represents 5 minutes of price movement.
Indicators
We use this indicator for the piranha strategy:
One set of Bollinger Bands
a. Period 12, Shift 0.
b. Deviation 2 (default).
Developed by technical trader John Bollinger, Bollinger Bands consist of three lines, with the simple moving average in the center and the outer Bands plotted using standard deviation formula away from the simple moving average.
Standard deviation is a measure of price volatility. When markets become more volatile, the Bands widen and move farther from the center moving average line. The formulas to calculate the upper and lower Bands are:
Upper band = SMA + (D × Std Dev)
Lower band = SMA − (D × Std Dev)
Where:
SMA = Simple moving average
D = Deviation value (e.g., 1, 2, 3, etc.)
Std Dev = Standard deviation
Due to the complexity of the formula, I will not focus too much on it; instead, I focus more on the significance of the upper and lower Bands.
When prices approach the upper band, it is considered to be in an overbought region. When prices approach the lower band, it is considered oversold. At these extreme levels, markets tend to consolidate and move back to the center moving average line.
By setting a higher deviation value, the price volatility measure will be magnified, and you will get a Bollinger band with wider upper and lower Bands.
Currency Pairs
The strategy is designed for the cable, which is the nickname for the currency pair GBP/USD.
Strategy Concept
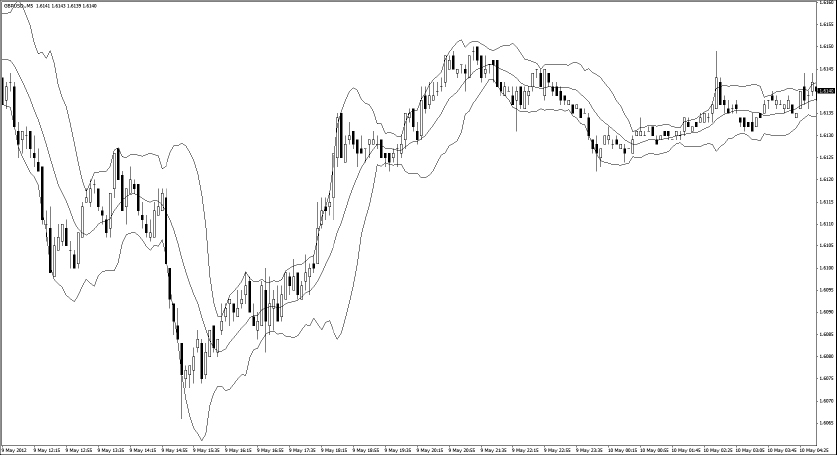
Bollinger Bands are used to identify the trading band of the GBP/USD. The Bands help us to mimic the nature of the piranhas by giving objective entries for long and short positions. (See Figure 6.7.)
Long trades are taken when market prices touch the bottom band; short trades are taken when market prices touch the upper band.
Piranhas are active in relatively calm waters, such as rivers, but not in the rough open seas with strong currents and waves. In much the same way, avoid trading this strategy at times of major news releases during the U.S. and U.K. trading hours, as such environments reflect the rough open seas with strong currents and waves. We use the GBP/USD currency pair on the M5 time frame to illustrate both long and short trades.
Long Trade Setup
Here are the steps to execute a long trade using the piranha strategy:
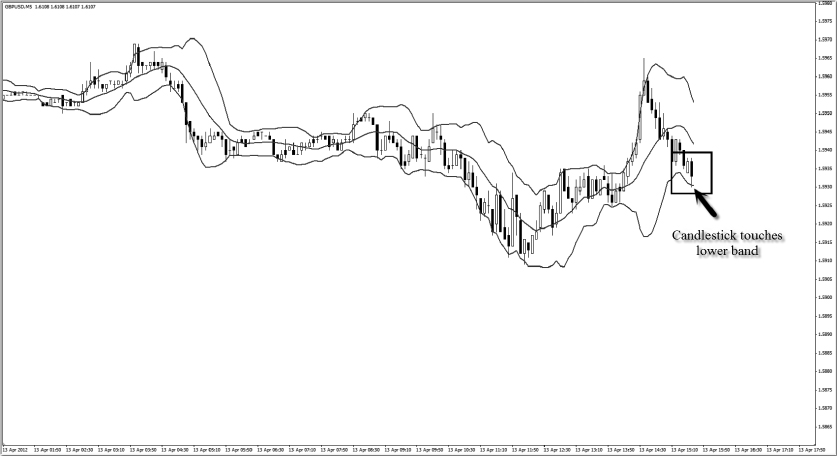
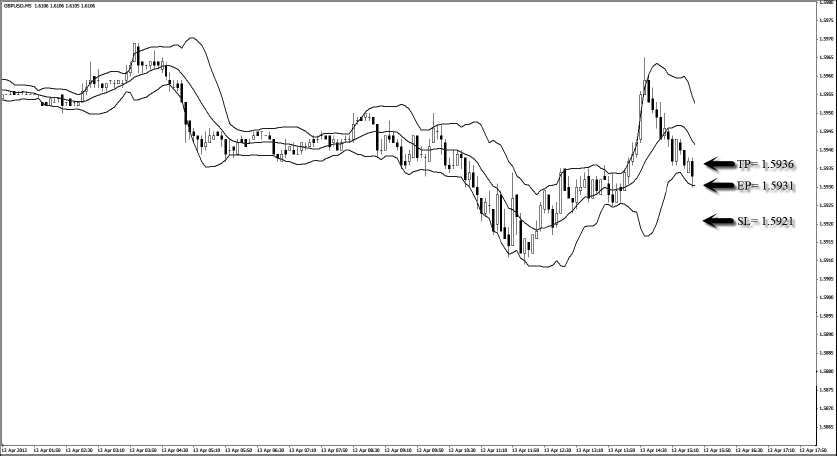
1. Wait for the market to touch the lower band of the Bollinger Bands.
2. Enter for a long when the market price touches the lower band of the Bollinger Bands. (See
Figure 6.8.)
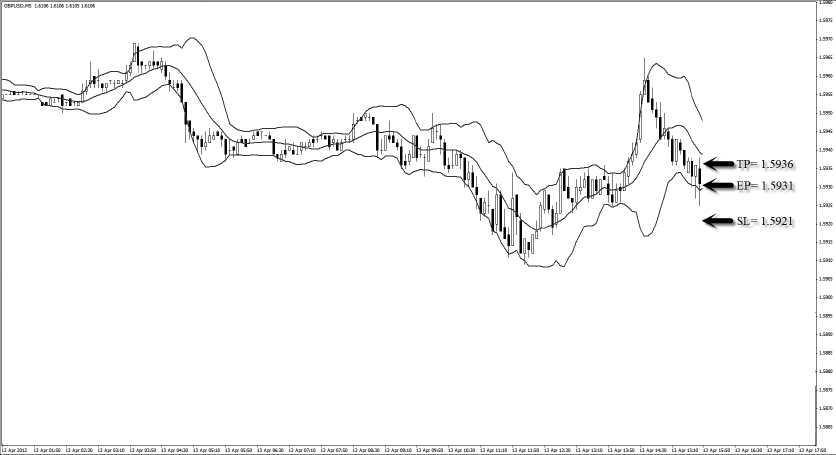
3. Set the stop loss at 10 pips below the entry price.
4. Set the profit target at 5 pips above the entry price. (See
Figure 6.9)
From the long example in Figure 6.10:
Entry price = 1.5931
Stop loss = 1.5921
Profit target = 1.5936
The risk for this trade is 10 pips, and the reward is 5 pips. The risk to reward ratio is 2:1, which yields us a 1.5% return if we take a 3% risk.
Short Trade Setup
Here are the steps to execute a short trade using the piranha strategy:
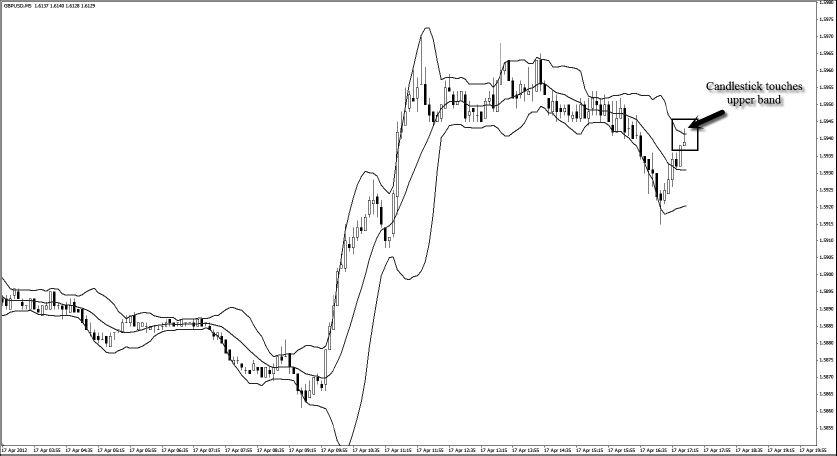
1. Wait for the market to touch the upper band of the Bollinger Bands.
2. Enter for a short when the market touches the upper band of the Bollinger Bands. (See
Figure 6.11.)
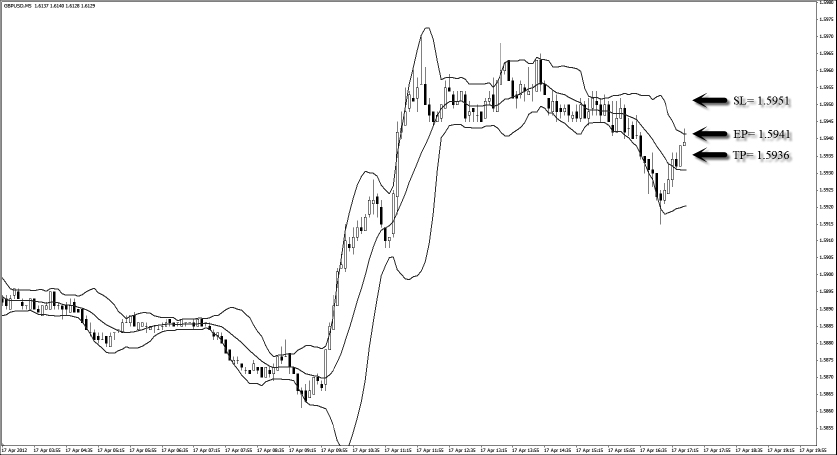
3. Set the stop loss at 10 pips above the entry price.
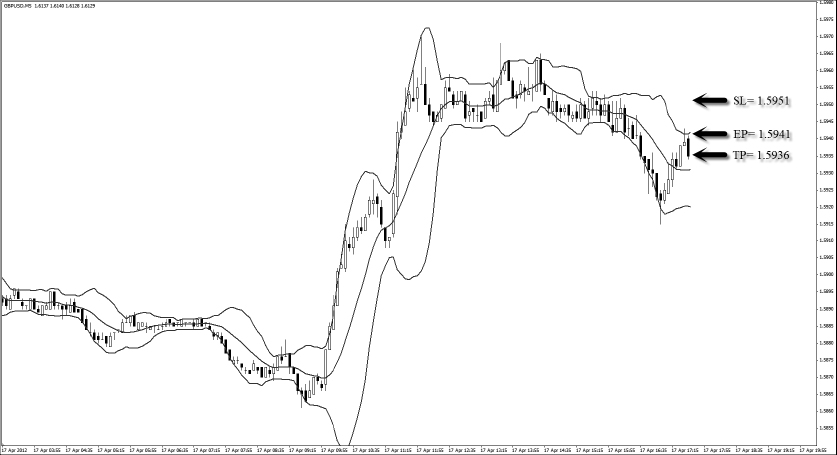
4. Set the profit target at 5 pips below the entry price. (See
Figure 6.12.)
From the short example in Figure 6.13:
Entry price = 1.5941
Stop loss = 1.5951
Profit target = 1.5936
The risk for this trade is 10 pips, and the reward is 5 pips. The risk to reward ratio is 2:1, which yields us a 1.5% return if we take a 3% risk.
Strategy Roundup
At the beginning of this section, I mentioned that piranhas attack their prey until it is totally devoured. In much the same way, once your trade hits a stop loss, the loss is telling you that there is nothing left of your prey and it’s time to look for a new one.
Hence, hitting a stop loss is a telltale sign that the market is no longer trading in a band and it is starting to move into a trend. So how do you look for the next prey?
The answer is to look for a trade that is in the opposite direction of your stop-loss trade. For example, if you took a long trade that resulted in a stop loss, look to short the GBP/USD at the next opportunity with the same rules.
This is an important consideration and a neat trick for you to navigate yourself in trending markets. As this strategy was designed primarily for range trading, it fails badly when the market goes into a strong trend.
