Chapter 7
Strategies for Day Traders
As a day trader, your biggest pet peeve is holding trading positions overnight. You are more concerned with finishing the day without an open position than the actual result of the trade itself.
Your trades are characterized by profit targets of around 20 to 50 pips per trade. Most day trading strategies involve a combination of both technical and fundamental analysis.
For technical analysis, chart patterns, candlestick patterns, and indicators are important considerations. For fundamental analysis, trading important news, such as non-farm payrolls (NFP) and interest rates, is the focus.
Four strategies are discussed in this section. The first two—fade the break and trade the break—are centered on technical analysis. The next two—gawk the talk and balk the talk—are centered on fundamental analysis, or news trading.
All strategies are developed using the 15-minute (M15) time frame and the 30-minute (M30) time frame. The biggest reason why these time frames are most suited for day traders is because the positions are most likely to exit in a day. As a day trader, the biggest frustration that you will face is the constant dilemma of leaving a trade open or exiting it manually. Sometimes, Murphy’s Law strikes when you decide to exit the trade manually, sending your trade to its intended profit level had you left it open in the first place.
To prevent such scenarios, set some guidelines for yourself when it comes to closing off your open positions. An example could be “I will close off my position exactly at 11 P.M. every day, regardless of the trading result.” An objective rule like that can help you to manage your positions better—and prevent Murphy’s Law from striking in the future.
STRATEGY 3: FADE THE BREAK
The forex market is a constant battle between bulls and bears. Sometimes this fight occurs between retail and institutional traders. It is common knowledge that institutional traders prey on unassuming retail traders who sometimes engage in emotional trading.
Fade the break is a strategy that follows the trail of the institutional traders. It allows retail traders like you and me to pick up the clues of the smart money. Let’s get right into it.
Time Frame
The fade the break strategy works with the 15-minute (M15) or 30-minute (M30) candle. This means that each candle on the chart represents 15 or 30 minutes of price movement.
Indicators
No indicators are used for this strategy. We use support and resistance levels only.
Currency Pairs
This strategy is suitable for all currency pairs listed on the broker’s platform, especially the seven major currency pairs of:
EUR/USD
USD/JPY
GBP/USD
USD/CHF
USD/CAD
AUD/USD
NZD/USD
Strategy Concept
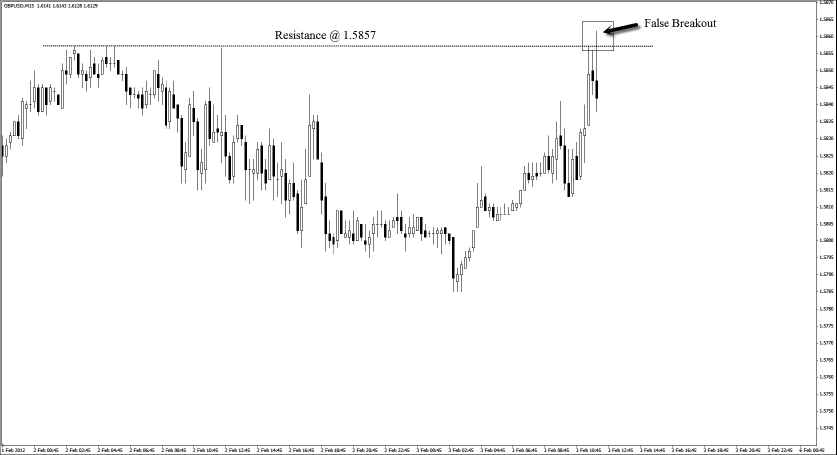
Markets often reverse after a failure to break above the resistance level or below the support level. At the resistance level, the failure is characterized by the shadow of the candle that goes above the resistance level but fails to close above it. Subsequently the price falls back below the resistance level.
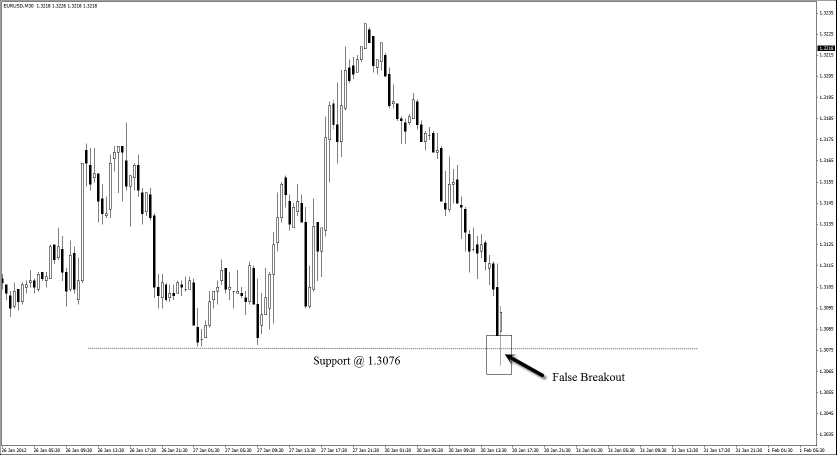
At the support level, the failure is characterized by the shadow of the candle that goes below the support level but fails to close below it. Subsequently the price rises above the support level.
Many retail traders get caught at exactly these levels because they take the “break” of the resistance as a signal that prices will continue to go up. Similarly, they assume that the break of the support is a signal that prices will continue to move down. Let’s see how to trade this setup when it occurs.
Long Trade Setup
We use the EUR/USD on the M30 time frame to illustrate long trades. Here are the steps to execute the fade the break strategy for long:
1. Identify the support level.
2. Identify a candle that has a shadow that goes below the support level.
3. Wait for that candle to close as a bull candle. This is called the false-break candle. (See
Figure 7.1.)
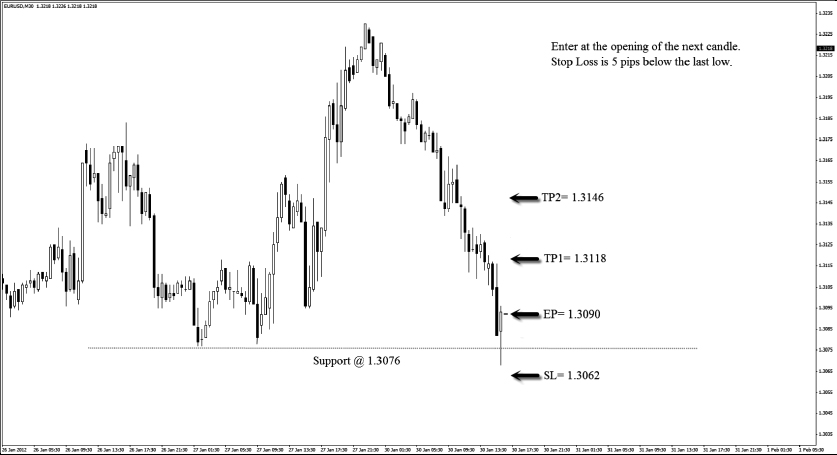
4. Enter at the opening of the next candle.
5. Set a stop loss of 5 pips below the low price of the false break candle.
6. Set two profit targets for this trade. Set the two targets at a risk to reward ratio of 1:1 and 1:2 respectively. (See
Figure 7.2.)
7. In this example, the stop loss is 28 pips, the first profit target is 28 pips from the entry price, and the second profit target is 56 pips from the entry price.
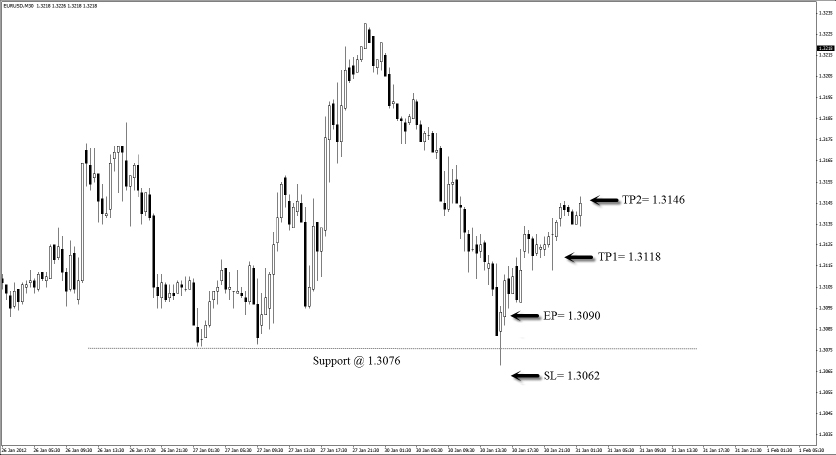
From the long example in Figure 7.3:
Entry price = 1.3090
Stop loss = 1.3062
Profit target 1 = 1.3118
Proft target 2 = 1.3146
The risk for this trade is 28 pips, and the reward is 56 pips if both targets are hit. The risk to reward ratio is 1:2, which yields a tidy 6% return if we take a 3% risk.
Short Trade Setup
We use the GBP/USD on the M15 time frame to illustrate short trades. Here are the steps to execute the fade the break strategy for short:
1. Identify the resistance level.
2. Identify a candle that has a shadow that goes above the resistance level.
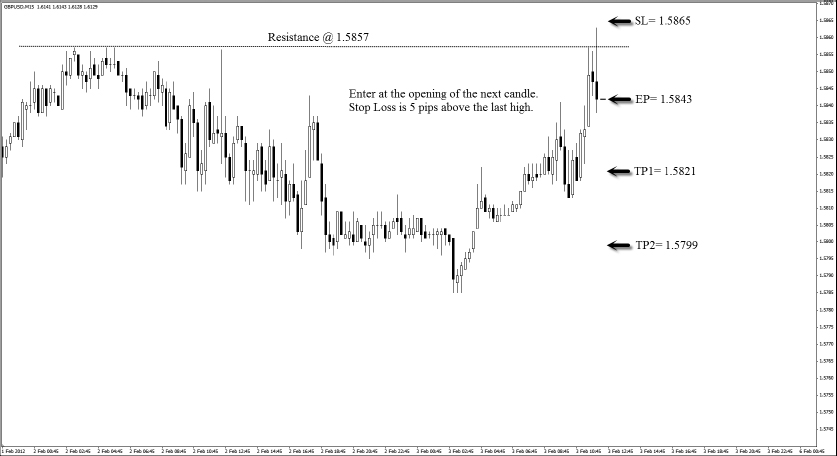
3. Wait for that candle to close as a bear candle. This is called the false-break candle. (See
Figure 7.4.)
4. Enter at the opening of the next candle.
5. Set a stop loss of 5 pips above the high price of the false-break candle.
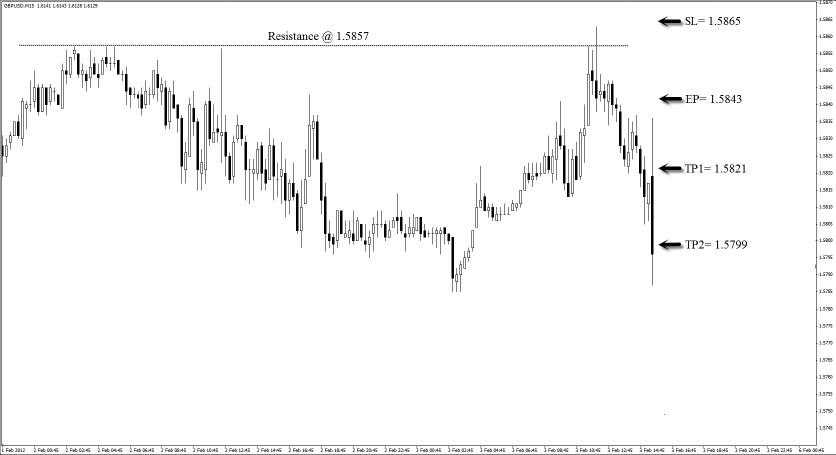
6. Set two profit targets for this trade. Set the two targets at a risk to reward ratio of 1:1 and 1:2 respectively. (See
Figure 7.5.)
7. In this example, the stop loss is 22 pips, the first profit target is 22 pips from the entry price, and the second profit target is 44 pips from the entry price.
From the short example in Figure 7.6:
Entry price = 1.5843
Stop loss = 1.5865
Profit target 1 = 1.5821
Proft target 2 = 1.5799
The risk for this trade is 22 pips, and the reward is 44 pips if both targets are hit. The risk to reward ratio is 1:2, which yields a tidy 6% return if we take a 3% risk.
Strategy Roundup
The main reason why false breaks occur is due to the tussle between retail and institutional traders. Both groups of traders easily identify levels of support and resistance, and false breaks are big clues for us retail traders that there is a lack of momentum to push prices further.
Remember that false breaks are traps to catch day traders off guard. However, fade the break helps us to turn these traps into opportunities.
STRATEGY 4: TRADE THE BREAK
In the previous strategy, we discussed a method to trade the market when prices fail to close above resistance or below support. In trade the break, we see exactly where to place our entries and exits for both short and long positions. The biggest difference between trade the break and fade the break is that for trade the break, prices have to close above resistance or below support.
For this strategy, the trick is not so much in the entry price but in the stop loss. Many retail traders have no problem identifying areas of entry since the directional bias is to follow the momentum. However, the correct placement of the stop loss is what separates winners from losers.
You see, as with the previous fade the break strategy, both retail and institutional traders closely watch areas of support and resistance. More often than not, these areas are the biggest battlegrounds between these two groups of traders. This is why prices sometimes reverse quickly once they break above resistance or below support.
When we learn how to place the stop loss correctly for these trades, many potential “losers” can in fact turn into winners. Let’s get right into it.
Time Frame
Trade the break works with the 15-minute (M15) or 30-minute (M30) candle. This means that each candle on the chart represents 15 minutes or 30 minutes of price movement.
Indicators
No indicators are used for this strategy.
Currency Pairs
This strategy is suitable for all currency pairs listed on the broker’s platform, especially the seven major currency pairs of:
EUR/USD
USD/JPY
GBP/USD
USD/CHF
USD/CAD
AUD/USD
NZD/USD
Strategy Concept
Trade the break is all about momentum. A big clue is seen when prices close above resistance or below support. This clue tells us that momentum is building strongly on one side. When prices close above resistance, that candle is called the breakout candle. A long trade is then taken at the opening price of the next candle. The stop loss is placed below the midpoint of the prior range because we do not expect prices to fall back below that point.
When prices close below support, that candle is also called the breakout candle. A short trade is then taken at the opening price of the next candle. The stop loss is placed above the midpoint of the prior range because we do not expect prices to rise above that point.
Long Trade Setup
We use the AUD/USD on M15 time frame to illustrate long trades. Here are the steps to execute the trade the break strategy for long:
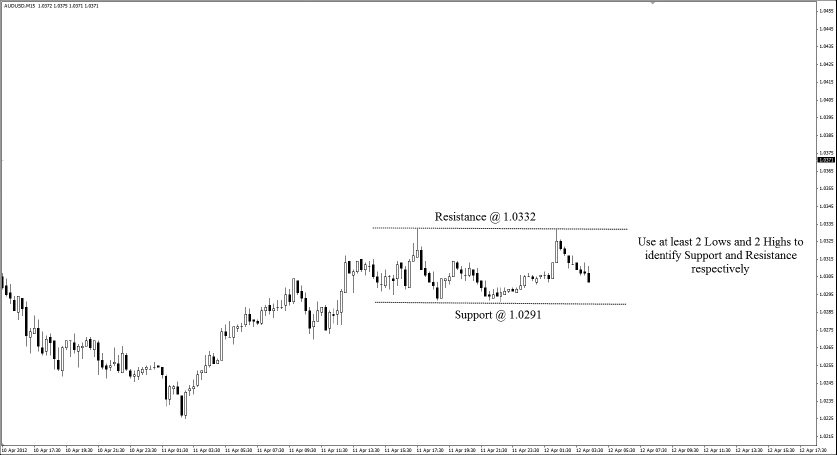
1. Use at least two lows and two highs to identify the support and resistance levels. (See
Figure 7.7.)
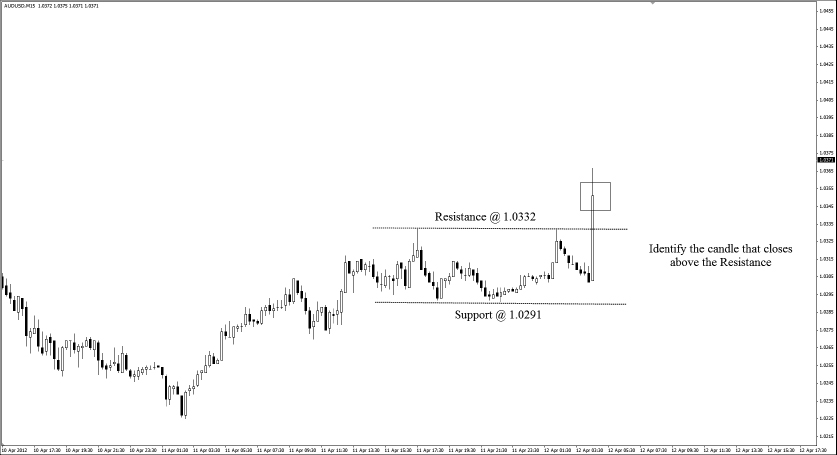
2. Identify a candle that closes above the resistance. This is the breakout candle. (See
Figure 7.8.)
3. Enter long at the opening of the next candle.
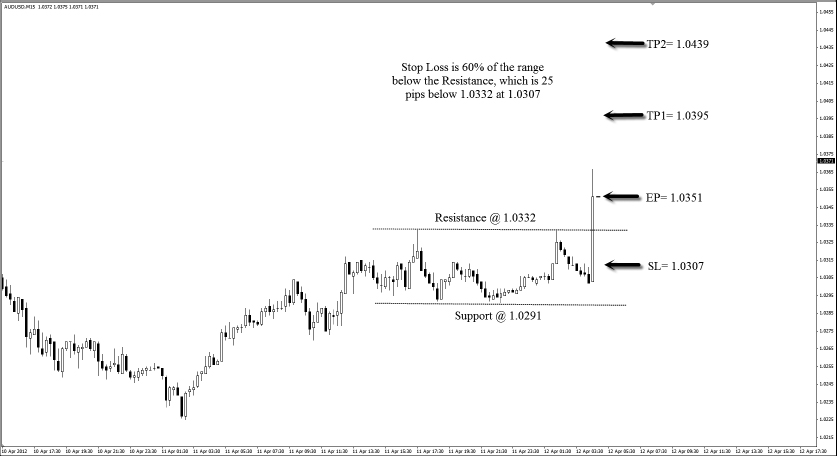
4. Set the stop loss at the 60% mark of the range (distance between the support and resistance) below the resistance. In this example, the distance between the support and resistance is 41 pips; the stop loss is set at 25 pips below the resistance.
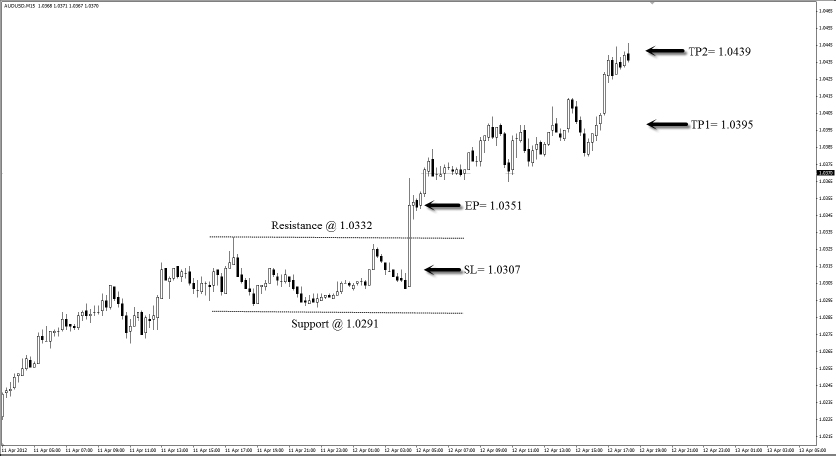
5. Set two profit targets for this trade. The targets are set at a risk to reward ratio of 1:1 and 1:2 respectively. Since the stop loss is 44 pips (distance between the EP and the SL), the first profit target will be 44 pips, and the second profit target will be 88 pips. (See
Figure 7.9.)
From the long example in Figure 7.10:
Entry price = 1.0351
Stop loss = 1.0307
Profit target 1 = 1.0395
Proft target 2 = 1.0439
The risk for this trade is 44 pips, and the reward is 88 pips if both targets are hit. The risk to reward ratio is 1:2, which yields a tidy 6% return if we take a 3% risk.
Short Trade Setup
We use the AUD/USD on M15 time frame for illustrating short trades. Here are the steps to execute the trade the break strategy for short:
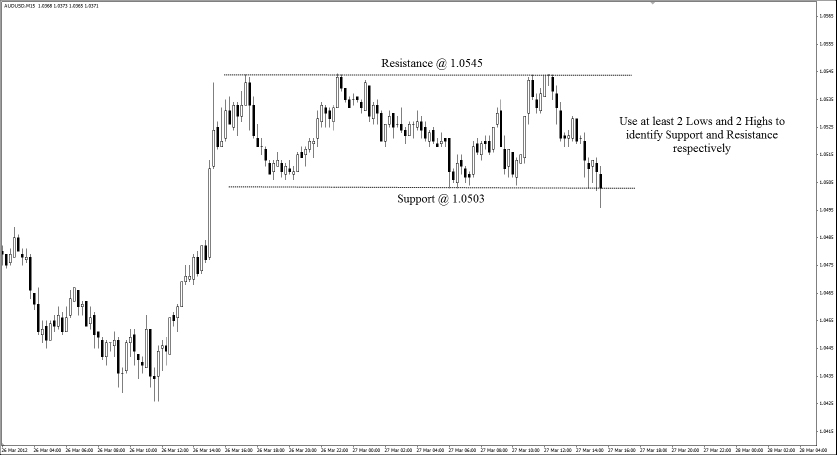
1. Use at least two lows and two highs to identify the support and resistance levels. (See
Figure 7.11.)
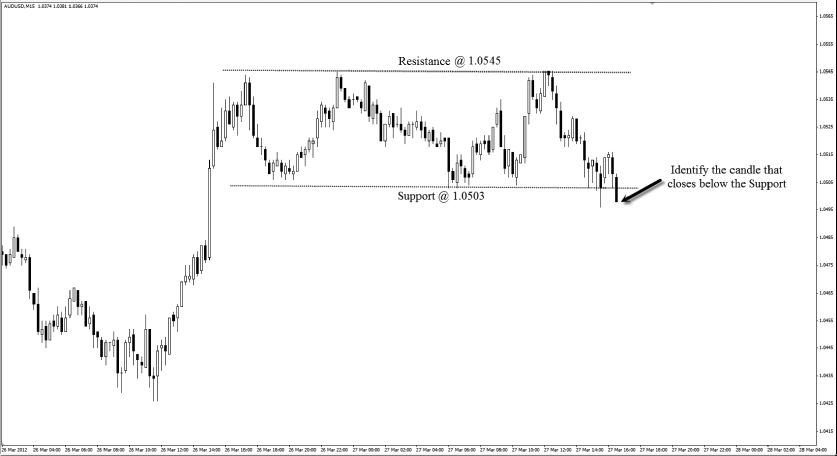
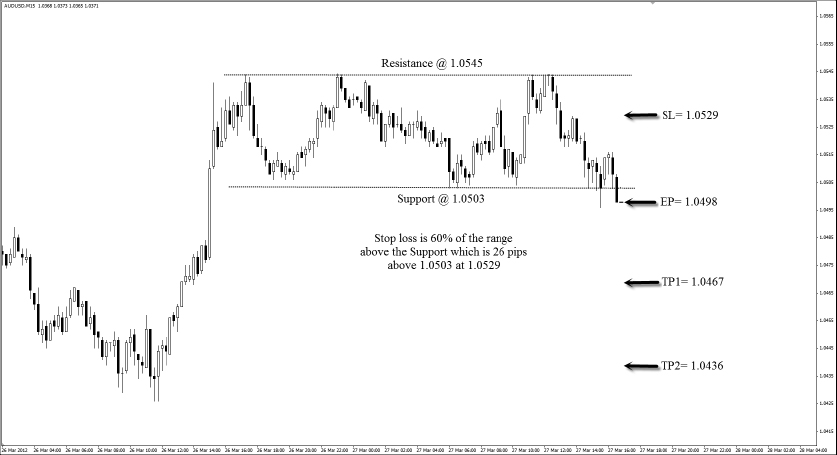
2. Identify a candle that closes below the support. This is the breakout candle. (See
Figure 7.12.)
3. Enter short at the opening of the next candle.
4. Set the stop loss at the 60% mark of the range (distance between the support and resistance) above the support. In this example, the distance between the support and resistance is 42 pips; the stop loss is set at 26 pips above the support.
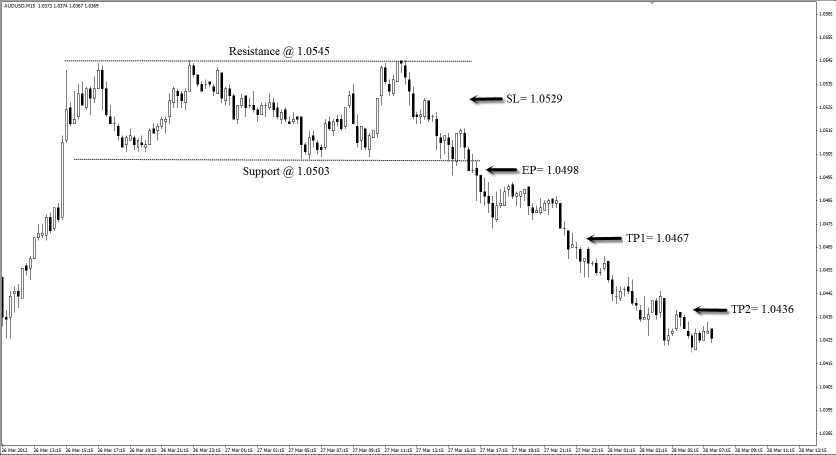
5. We set two profit targets for this trade. The targets are set at a risk to reward ratio of 1:1 and 1:2 respectively. Since the stop loss is 31 pips (distance between EP and SL), the first profit target is 31 pips, and the second profit target is 62 pips. (See
Figure 7.13.)
From the short example in Figure 7.14:
Entry price = 1.0498
Stop loss = 1.0529
Profit target 1 = 1.0467
Proft target 2 = 1.0436
The risk for this trade is 31 pips, and the reward is 62 pips if both targets are hit. The risk to reward ratio is 1:2, which yields a tidy 6% return if we take a 3% risk.
Strategy Roundup
As a trader, our job is not to predict but to react. In other words, we should not second-guess where the market is going and execute trades based on assumptions. Whenever the market approaches resistance or support levels, traders tend to jump in prematurely, which can yield disastrous consequences when the markets don’t go the way we want.
Instead, a better option is to wait for the story to unfold. It certainly pays to wait for a confirmation before jumping onboard the breakout bandwagon. The confirmation comes in the form of the breakout candle that closes above the resistance or below the support. This is the market’s way of telling us that it has enough momentum to continue the run.
By now, you must have realized that the two strategies—fade the break and trade the break—work hand in hand. Both strategies require us to pause and wait for a confirmation candle before deciding what to do. These candles are either false-break candles or breakout candles. With these two strategies, we can take a trade regardless of market direction.
TRADING THE NEWS
Trading the news is one of the best ways I know of making good profits in a short time with bearable risk. This is because volatility is highest during these announcements, and traders tend to look out for these times to capitalize on price movements for a quick profit.
If you are a trader who loves making trading decisions around news announcements, the next two strategies are for you. One of the greatest advantages of news trading is accessibility. Today, more than ever before, we are able to access the results as soon as they are released and trade off them.
Many free websites report economic news events almost hourly. The one that I use daily is a site called forexfactory.com. The site is very user friendly, and the economic calendar allows you to view the upcoming news at a glance.
The news comes with color-coded flags, with red flags signifying the greatest potential impact. I prefer trading these red flags as opposed to the orange or yellow ones because the potential for big movements is higher. These red flags are also the basis for the events discussed in the next section.
The top seven news that cause the greatest moves in the forex market are discussed next.
Interest Rates
As discussed in Chapter 2, central banks usually raise or lower interest rates to achieve a particular inflation target. If the current inflation is below their target, banks may cut the rate to entice consumers to spend more, given the cheaper borrowing rate. In this way, banks increase the demand for goods and services.
An increase in demand for goods and services would result in an increase in inflation. Conversely, banks may hike their rate if the current inflation reading is above their target. Making borrowing costs more expensive puts a curb on demand and spending and thus lowers inflation. High interest rates subsequently cause funds to flow into that particular country as compared to a country with relatively lower rates.
Key point: When a country raises interest rates, its currency tends to strengthen.
Gross Domestic Product
Gross domestic product (GDP) is considered the broadest measure of a country’s economy because it represents the monetary value of all goods and services produced within a country’s borders in a specific time period, usually a year. Most countries target economic growth at a rate of about 2% per year. When GDP figures are rising, demand for the nation’s currency increases. This causes its currency to rise in value against other currencies. In much the same way, a decreasing GDP could mean that a country is not growing. In fact, a recession is defined as two consecutive quarters of negative growth.
Hence, lower GDP figures tend to decrease the country’s value because growth is stunted and confidence is affected. This causes foreign capital to leave the country and, in turn, lowers the value of its currency against other currencies.
Key point: When GDP figures are better than expected, the currency tends to strengthen.
Employment
Employment data is highly sought after by retail traders. In the United States, this news is termed the non-farm payrolls (NFP), and it accounts for about 80% of the workers who contribute to the GDP. The NFP is released on the first Friday of every month and is arguably the most traded piece of news worldwide.
The NFP report is statistical data from the U.S. Bureau of Labor Statistics. It represents the total number of paid U.S. workers of any business, excluding:
- General government employees
- Private household employees
- Employees of nonprofit organizations that provide assistance to individuals
- Farm employees
The figures in an NFP report indicate the number of jobs created in that particular month. Increasing employment levels signal robust growth, which directly increases consumer spending and causes confidence to rise. Naturally, the added effect of consumer spending and confidence brings about demand for US dollars and causes it to rise.
An increase in unemployment levels in a country tends to signal a slowdown in growth because consumer spending falls. This slowdown impacts demand for goods and services and causes business confidence to drop as well. Even those still employed tend to worry about the future and reduce spending. As demand continues to falter, the currency supply builds up, and its value decreases against other currencies.
Key point: When employment figures are higher than expected, the currency tends to strengthen.
Trade Balance
The trade balance measures the ratio of exports to imports for a given country’s economy. If exports are higher than imports (called a trade surplus), the trade balance will be positive. If imports are higher than exports (called a trade deficit), the trade balance will be negative.
Trade balance is derived primarily from three factors:
1. The price of goods in a country
2. Tax and tariff levies on imported or exported goods
3. The exchange rate between two currencies
This last factor is fundamental to forex trading. Since the trade balance depends so heavily on the current state of exchange rates between two countries, the trade balance is a key indicator of a country’s economic health.
Key point: When trade balance figures are higher than expected, the currency tends to strengthen.
Consumer Price Index
The consumer price index (CPI) is the best measure of inflation for any country. It measures the change in the cost of a fixed basket of products and services, including housing, electricity, food, and transportation. The CPI is published monthly. In some countries, the CPI is called the inflation index or the cost-of-living index.
A high CPI figure shows that the inflation in a country is high. Most countries tend to keep the annual inflation rate between the 2% and 3% mark. If inflation is stubbornly above the figures set by a country, its central bank will lean toward a higher interest rate to cool inflationary pressures.
The expectation of a higher interest rate and the subsequent interest rate hike by the central bank will cause the currency to appreciate.
Key point: When CPI figures are higher than expected, the currency tends to strengthen in anticipation of an interest rate hike.
Purchasing Manufacturing Index
In the United States, the Purchasing Manufacturing Index (PMI) measures the activity level of about 400 purchasing managers in the manufacturing sector. A reading above 50 indicates expansion, and a reading below 50 indicates contraction.
Purchasing managers are surveyed on five subtopics with these breakdowns:
1. Production level—25%
2. New orders—30%
3. Supplier deliveries—15%
4. Inventories—10%
5. Employment level—20%
Traders watch these surveys closely because purchasing managers have early access to data about their company’s performance. Hence the PMI alone can act as a leading indicator for the overall economic health of the country. A rising trend has a positive effect on the nation’s currency.
Variations of the PMI include:
- Institute for Supply Management (ISM) Non-Manufacturing Report on Business (United States)
- Construction PMI (Great Britain)
- Services PMI (United States, Great Britain)
- Ivey PMI (Canada)
Key point: When PMI figures are higher than expected, the currency tends to strengthen.
Retail Sales
Figures for retail sales give the best gauge for consumer spending and possible clues into inflation data and, ultimately, the direction of interest rates. Retail sales track the dollar value of merchandise sold within the retail trade by sampling companies engaged in the business of selling end products to consumers. Generally, the most volatile components are transportation, accommodation, and food prices.
If retail sales growth is stagnant or slowing down, it tells us that consumers are not spending at previous levels, and could signal a recession due to the fact that personal consumption is needed to maintain robust growth in the economy.
Key point: When retail sales figures are higher than expected, the currency tends to strengthen in anticipation of an interest rate hike.
Rule of 20
News traders compare three different news figures:
1. Previous
2. Forecast
3. Actual
Previous figures denote the data that were last released. Forecast figures tell us what the analysts or economists expect the figures to be this time round. Actual figures are the reported data when they come out. Here’s an inside scoop: Traders trade based on expectations. This means that the previous figures are not really important to their trading decisions. In fact, on their own, forecasted figures do not have much weight either.
The trick is to compare the forecasted figures with the actual figures. This is where the Rule of 20 comes in. The Rule of 20 states: If the deviation between the actual and forecasted figures exceeds 20%, trade in the direction of the deviation.
Let’s use the U.S. NFP as an example. If forecasted figures are 300K, a 20% deviation is 60K. This means we can long the U.S. dollar if NFP numbers come in above 360K, or we can short the U.S. dollar if NFP numbers come in below 240K. Specifically, going long on the U.S. dollar means going long on USD/JPY or going short on EUR/USD. Similarly, going short on the U.S. dollar means going short on USD/JPY or going long on EUR/USD.
There are two special cases for the Rule of 20: PMI and interest rates. For PMI, the deviation between the actual and forecasted figures must exceed 50 basis points (0.5%) before a trade can be taken. For interest rates, the deviation between the actual and forecasted figures must exceed 20 basis points (0.2%) before a trade can be taken.
Let’s look at how the Rule of 20 is applied to two strategies, gawk the talk and balk the talk.
STRATEGY 5: GAWK THE TALK
Time Frame
Gawk the talk works with the 15-minute (M15) or 30-minute (M30) candle. This means that each candle on the chart represents 15 minutes or 30 minutes of price movement.
Indicators
No indicators are used for this strategy.
Currency Pairs
The gawk the talk strategy is suitable for all currency pairs listed on the broker’s platform, especially the seven major currency pairs of:
EUR/USD
USD/JPY
GBP/USD
USD/CHF
USD/CAD
AUD/USD
NZD/USD
Strategy Concept
We use either the M15 or M30 charts to determine our entries because the news is usually released in 15-minute intervals. Examples include 8 A.M., 9:15 A.M., 10:30 P.M., and 11:45 P.M.
As discussed in the Rule of 20, trades are taken by comparing the forecasted figures with the actual figures. For this strategy, we go long on the affected currency when actual figures are greater than forecasted figures by a minimum factor of 20%. Since we trade in currency pairs, we focus on pairs which feature the U.S. dollar in either the base currency or counter currency.
As an example, if the news is a positive interest rate announcement by the Reserve Bank of Australia, we will take a long trade on the AUD/USD. If the news is a positive retail sales announcement by Switzerland, we take a short trade on the USD/CHF.
What about news announcements by the United States?
For news that affects the United States directly, it is best for us to trade the two most liquid pairs: EUR/USD and USD/JPY.
In summary, if the affected currency is the base currency, we go long on the currency pair. If the affected currency is the counter currency, we go short.
Long Trade Setup
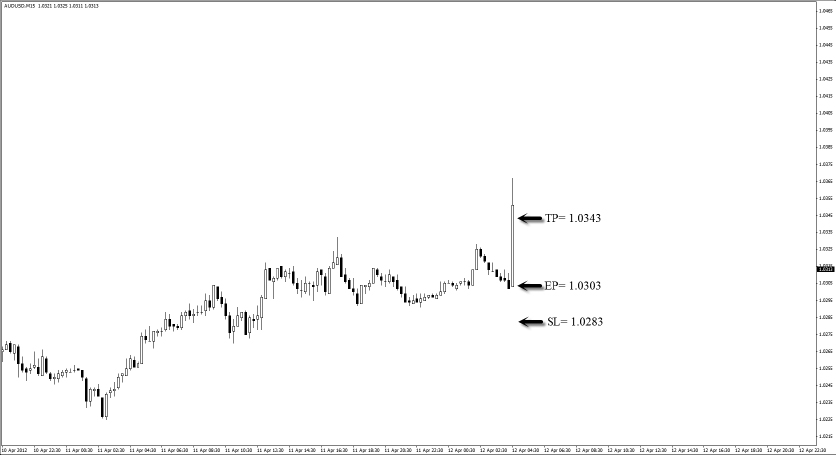
We use the Australian employment data on the M15 time frame for illustrating a long trade. Here are the steps to execute the gawk the talk strategy for long:
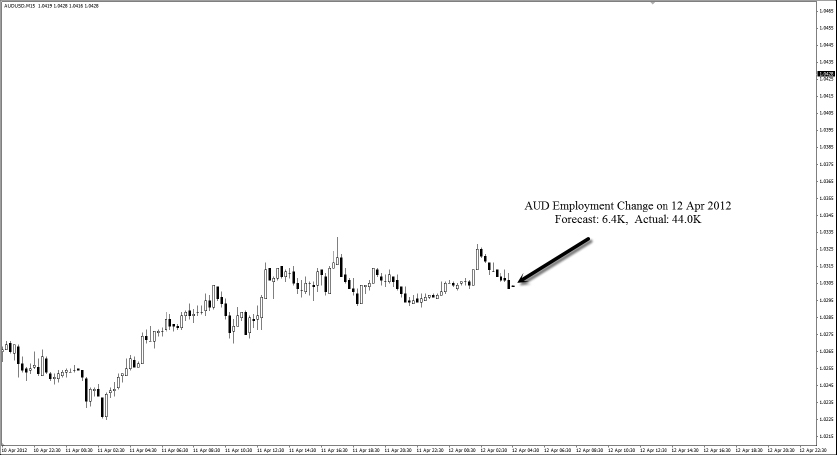
1. Identify the currency to trade the news (AUD employment change).
2. Enter long on AUD/USD once the actual figure released is higher than the forecasted figure by 20% or more. (See
Figure 7.15.)
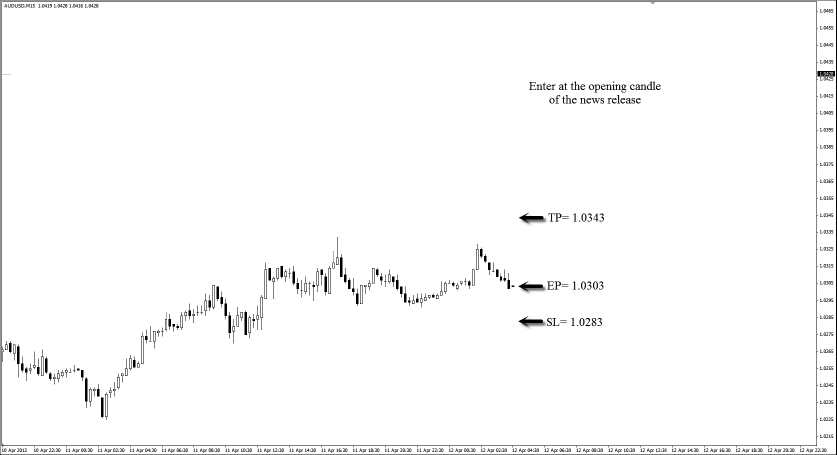
3. Set a stop loss of 20 pips from the entry price.
4. Set a profit target of 40 pips from the entry price. (See
Figure 7.16.)
From the long example in Figure 7.17:
Entry price = 1.0303
Stop loss = 1.0283
Profit target = 1.0343
The risk for this trade is 20 pips, and the reward is 40 pips. The risk to reward ratio is 1:2, which yields a tidy 6% return if we take a 3% risk.
Short Trade Setup
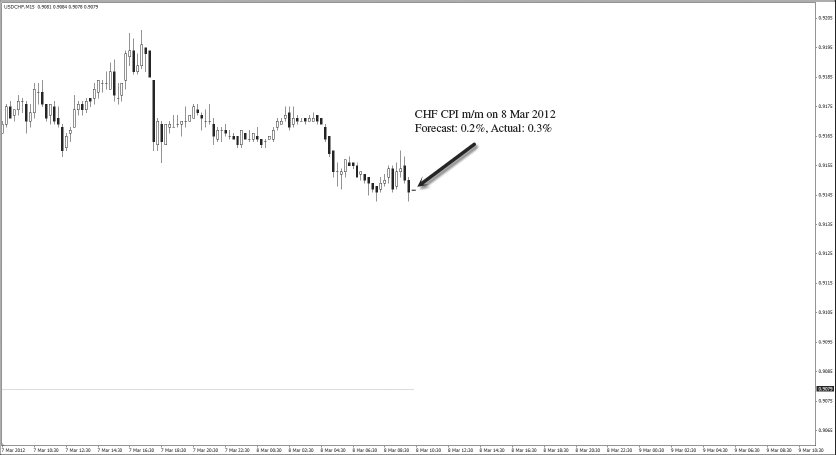
We use the Swiss CPI to illustrate a short trade. Here are the steps to execute the gawk the talk strategy for short:
1. Identify the currency to trade for the news (CHF CPI month on month [m/m]).
2. Enter short on USD/CHF once the actual figure released is higher than the forecasted figure by 20% or more. (See
Figure 7.18.)
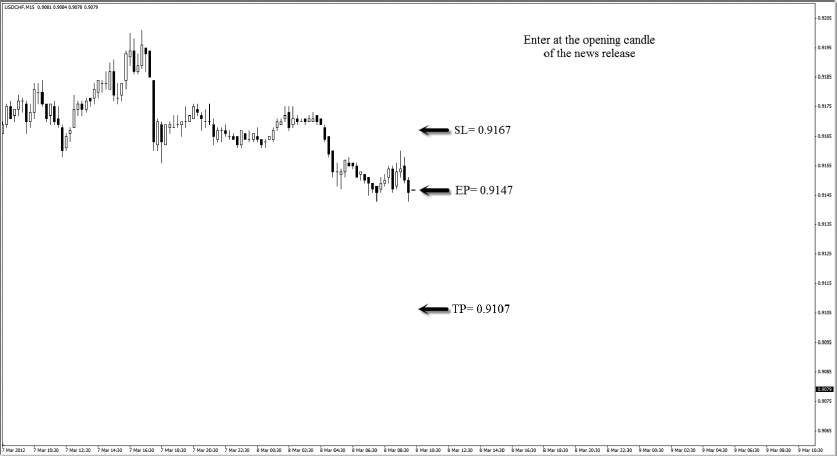
3. Set a stop loss of 20 pips from the entry price.
4. Set a profit target of 40 pips from the entry price. (See
Figure 7.19.)
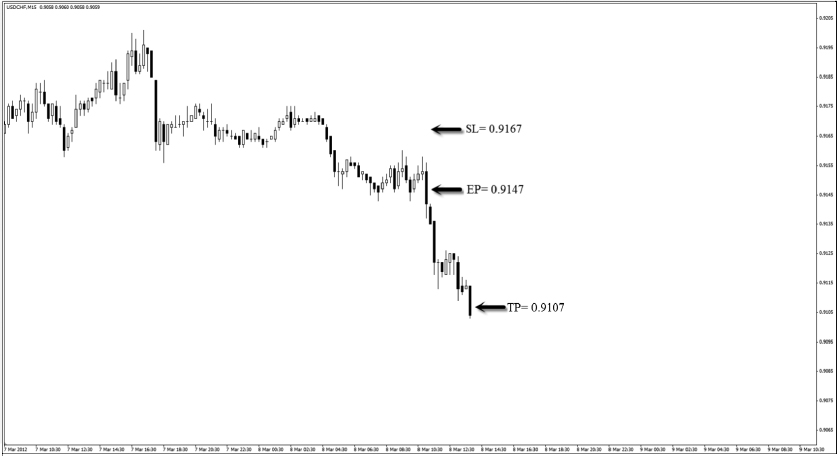
From the short example in Figure 7.20:
Entry price = 0.9167
Stop loss = 0.9147
Profit target = 0.9107
The risk for this trade is 20 pips, and the reward is 40 pips. The risk to reward ratio is 1:2, which yields a tidy 6% return if we take a 3% risk.
Strategy Roundup
This strategy takes advantage of the market reaction when the actual figures for the affected currency are higher than the forecasted figures by a minimum factor of 20%.
1. For any news site you utilize, please remember to sync the timing of the news announcement to match the time zone of the country you are in.
2. Be mindful of whether the affected currency is in the base or counter currency of the forex quote. As an example, strong figures for USD would constitute a long trade on the USD/JPY but a short trade on the EUR/USD.
STRATEGY 6: BALK THE TALK
Fear is a greater driving force than pleasure. Humans tend to react more drastically in times of fear, or when they are presented with bad news. Fear is also the emotion that drives traders around the world to watch every single news announcement, for fear of missing out on key information.
Fear also results in sell-offs. Whenever there is bad news, the first reaction of traders is to sell. This is precisely why I mentioned in Chapter 5 that trading the news is one of the best ways I know of making good profits in a short time with bearable risk, especially since you can make a profit from either buying or selling.
Let’s see how bad news can become profitable news for traders like you and me.
Time Frame
Balk the talk works with the 15-minute (M15) or 30-minute (M30) candle. This means that each candle on the chart represents 15 minutes or 30 minutes of price movement.
Indicators
No indicators are used for this strategy.
Currency Pairs
This strategy is suitable for all currency pairs listed on the broker’s platform, especially the seven major currency pairs of:
EUR/USD
USD/JPY
GBP/USD
USD/CHF
USD/CAD
AUD/USD
NZD/USD
Strategy Concept
We use either the M15 or M30 charts to determine our entries because the news is usually released in 15-minute intervals. Examples include 8 A.M., 9:15 A.M., 10:30 P.M., and 11:45 P.M.
As discussed in the Rule of 20, trades are taken by comparing the forecasted figures with the actual figures. For this strategy, we go short on the affected currency when actual figures are lower than forecasted figures by a minimum factor of 20%.
Since we trade in currency pairs, we focus on pairs which feature the U.S. dollar in either the base currency or counter currency. As an example, if the news is a negative GDP announcement by Canada, we take a long trade on the USD/CAD.
If the news is a negative employment announcement by the United States, we take a long trade on EUR/USD or a short trade on USD/JPY.
Long Trade Setup
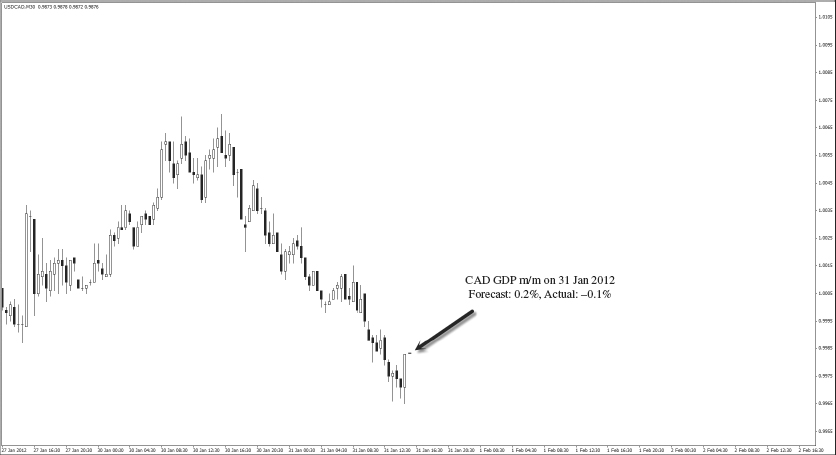
We use the Canadian gross domestic product (GDP) on M30 time frame for illustrating a long trade.
Here are the steps to execute the balk the talk strategy for long:
1. Identify the currency to trade the news (CAD GDP m/m).
2. Enter long on USD/CAD once the actual figure released is lower than the forecasted figure by 20% or more. (See
Figure 7.21.)
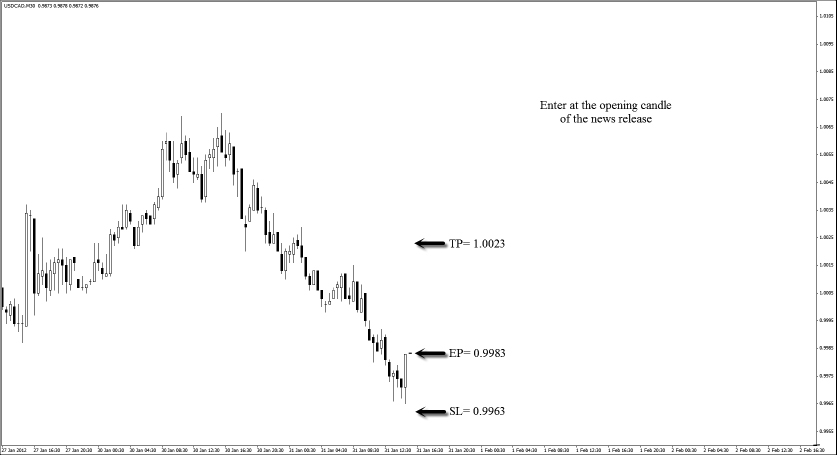
3. Set a stop loss of 20 pips from the entry price.
4. Set a profit target of 40 pips from the entry price. (See
Figure 7.22.)
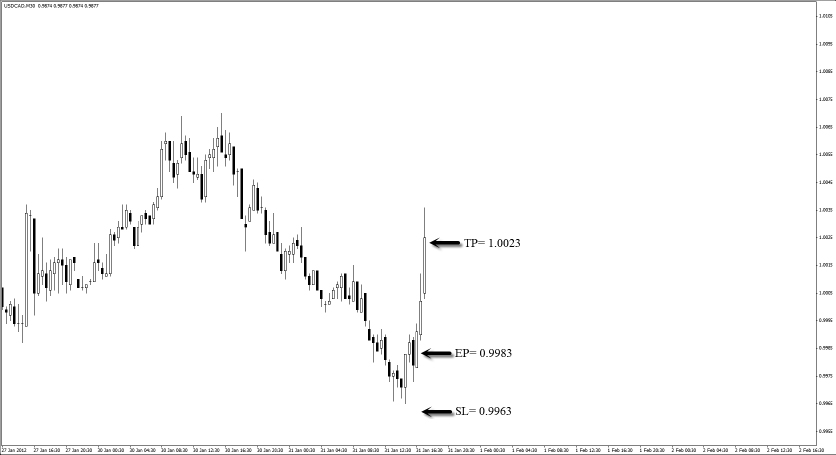
From the long example in Figure 7.23:
Entry price = 0.9983
Stop loss = 0.9963
Profit target = 1.0023
The risk for this trade is 20 pips, and the reward is 40 pips. The risk to reward ratio is 1:2, which yields a tidy 6% return if we take a 3% risk.
Short Trade Setup
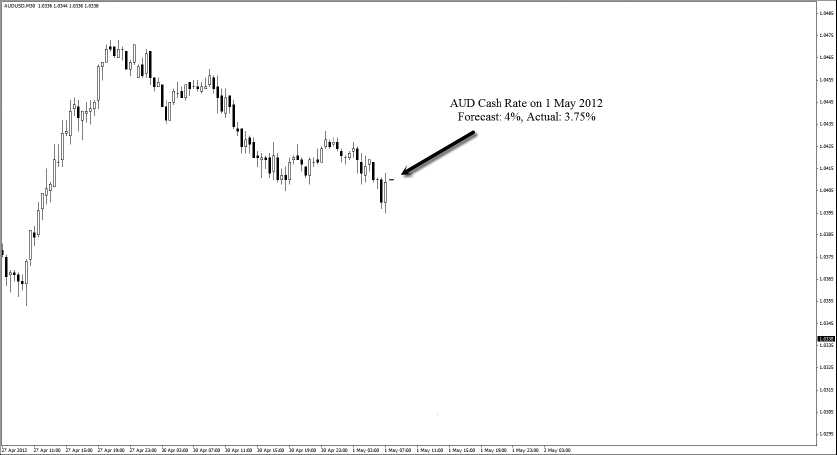
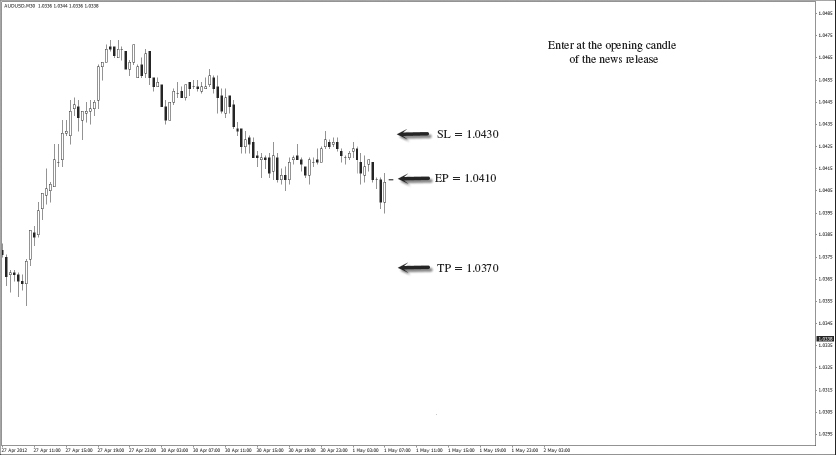
We use the interest rate announcement by Reserve Bank of Australia on M30 time frame to illustrate a short trade. Here are the steps to execute the balk the talk strategy for short:
1. Identify the currency to trade the news (AUD interest rate).
2. Enter short on AUD/USD once the actual figure released is lower than the forecasted figure by 20 basis points (0.2%) or more. (See
Figure 7.24.)
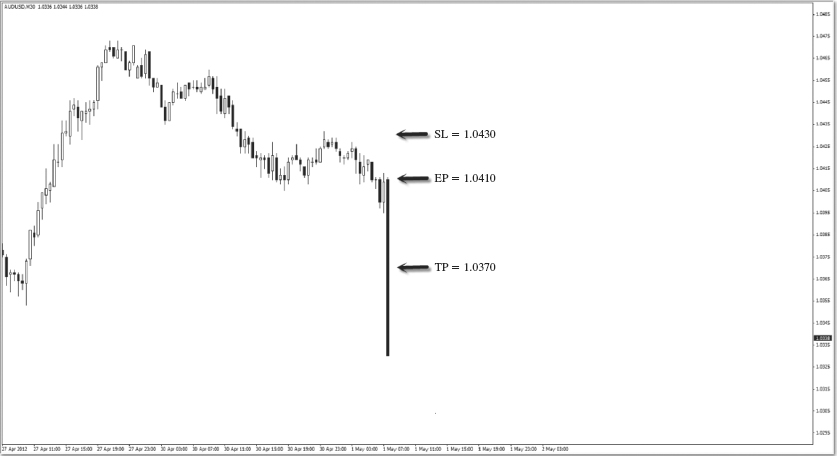
3. Set a stop loss of 20 pips from the entry price.
4. Set a profit target of 40 pips from the entry price. (See
Figure 7.25.)
From the short example in Figure 7.26:
Entry price = 1.0410
Stop loss = 1.0430
Profit target = 1.0370
The risk for this trade is 20 pips, and the reward is 40 pips. The risk to reward ratio is 1:2, which yields a tidy 6% return if we take a 3% risk.
Strategy Roundup
This strategy takes advantage of the market reaction when the actual figures for the affected currency are lower than the forecasted figures by a minimum factor of 20%.
Before taking a trade, it is important to note whether the affected currency is in the base currency or counter currency. As an example, if CHF is the affected currency, we look to go long on USD/CHF. If AUD is the affected currency, we look to go short on the AUD/USD.
Pay attention to the two special cases for Rule of 20: PMI and interest rates. For interest rates, the deviation has to be more than 20 basis points (0.2%). For PMI, the deviation has to be more than 50 basis points (0.5%).
