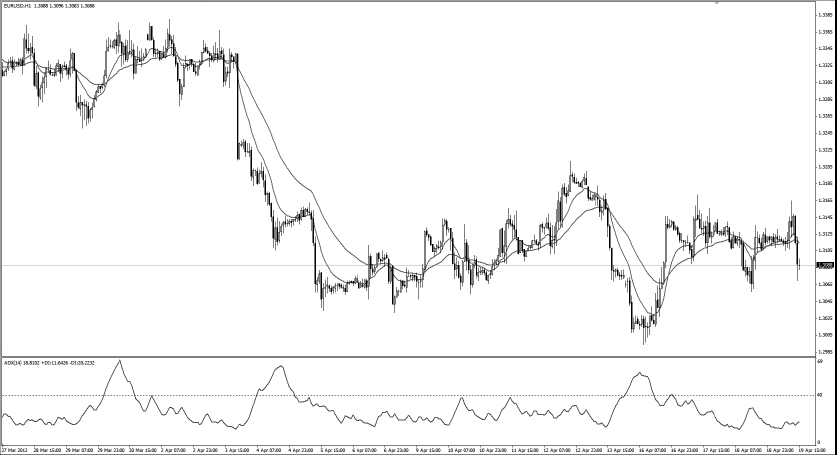
FIGURE 8.1 Trend Rider Strategy Concept
Source: Created with FX Primus Ltd, a PRIME Mantle Corporation PLC company. All rights reserved.
You are a swing trader primarily because you have a full-time job and don’t have much time to analyze the markets. That is why your trading strategy is considered fairly midterm, with several trading opportunities in a week. Depending on the currency pair, the profit potential per trade for swing traders can range from 50 pips to 150 pips or more. With trades having profits as high as the daily volatility, it is normal for these trades to take more than a day to exit.
Most swing trading strategies use indicators to pinpoint entries. This chapter covers five strategies suitable for all swing traders. The techniques are developed for use on middle time frames, such as the hourly (H1) and the 4-hourly (H4) charts.
Due to the strategies’ time frame, swing traders are presented with trading opportunities that most likely last more than a day but exit within a week.
Two of the most popular quotes in the forex market are the sentences “The trend is your friend until it bends” and “Always trade along the trend.” Each is good advice.
One of the main reasons why many retail traders fail to make consistent income is because they exit too early. How often have we had that experience when we jump into a trade, watch in delight as it goes our way, take a 30 pip profit with a smug grin, and then watch in horror as the trade goes another 500 pips in our direction?
The strategy discussed here will help traders of all levels, because it essentially prevents us from exiting our trade too early. This is achieved by not setting a predetermined profit target level but by employing a momentum indicator called the average directional movement index (ADX) to tell us when to exit the trade. I use this strategy often, because it only needs little monitoring but the payoff potential is huge.
The trend rider method works with the hourly (H1) or 4-hourly (H4) chart. This means that each candle on the chart represents 1 hour or 4 hours of price movement respectively.
We use three indicators for this strategy:
To understand the EMA, we first define the simple moving average (SMA).
An SMA is calculated by adding the closing price of the candlestick over a given number of periods and dividing this total sum by the number of periods. For example, SMA 12 is the sum of closing prices for 12 candles divided by 12. The figures are dynamic, which means that old data are dropped as new data are added. This rolling figure causes the moving average to move along the time scale.
The EMA is similar to the SMA except that more weight is given to recent prices. The formula for an EMA is:
Exponential Percentage = 2/(Time Period + 1)
For EMA 12:
Exponential Percentage = 2/(12 + 1) = 15%
This means that the most recent candle will be weighted 15% of the value of the EMA. For SMA 12, each candle has a uniform weight of only 8.3% (100/12).
The advantage of using an EMA over the SMA is its ability to pick up on price changes faster. I select EMA 12 because 12-hourly candles give me half a day’s worth of price action. EMA 36 is 36 hourly candles, giving me one and a half days’ worth of price action. Twelve 4-hourly candles give me two days’ worth of price action, and 36 4-hourly candles give me 6 days’ worth of price action on the 4-hourly chart.
The combination of EMA 12 and EMA 36 on either the hourly or 4-hourly time frame is important to give me a feel of the market over this time period.
The ADX indicator is used to measure the strength of a trend. It is plotted as a line with values ranging from 0 to 100.
A low reading indicates a weak trend while a high reading depicts a strong trend. The ADX is non-directional, which means it registers trend strength in both uptrends and downtrends. I select the level 40 as a guide to tell me when momentum of the trend is losing steam. The default setting is period 14, and this is the same setting we will use for the trend rider strategy.
The strategy is suitable for all currency pairs listed on the broker’s platform, especially the seven major currency pairs of:
The strategy uses moving average cross-over to detect an early change in momentum. Specifically, we get a signal to go long when the EMA 12 crosses above the EMA 36. Similarly, we get a signal to go short when the EMA 12 crosses below the EMA 36. The ADX indicator helps us to gauge the strength of the momentum. We set the 40 level as a benchmark, as any value above 40 indicates that momentum is very strong. Once the ADX crosses above 40 and comes back below, it is telling us that the momentum is losing steam and it’s time to exit the trade. (See Figure 8.1.)
FIGURE 8.1 Trend Rider Strategy Concept
Source: Created with FX Primus Ltd, a PRIME Mantle Corporation PLC company. All rights reserved.

I use the EUR/USD on the H4 time frame to illustrate a long trade. Here are the steps to execute the trend rider strategy for long:
FIGURE 8.2 EMA 12 Crosses EMA 36
Source: Created with FX Primus Ltd, a PRIME Mantle Corporation PLC company. All rights reserved.
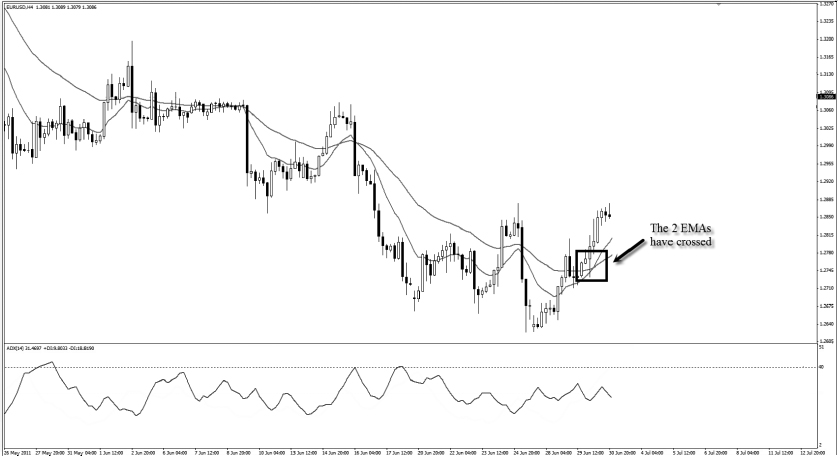
FIGURE 8.3 Candlestick Touches EMA 12
Source: Created with FX Primus Ltd, a PRIME Mantle Corporation PLC company. All rights reserved.
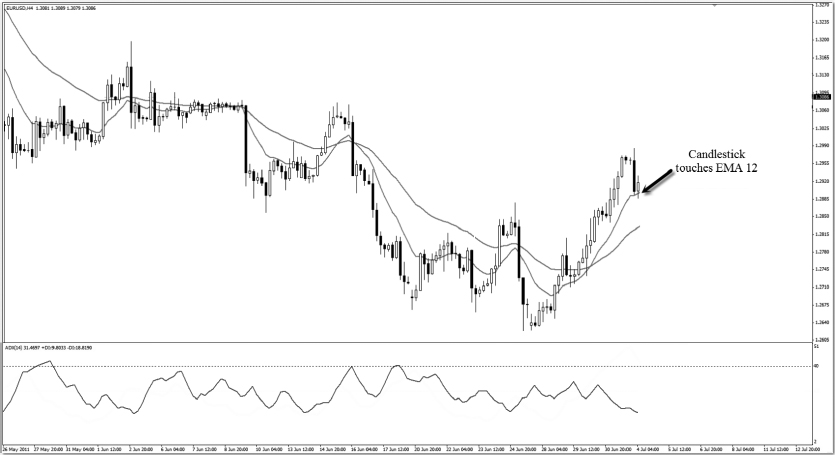
FIGURE 8.4 Set Stop Loss and Profit Target
Source: Created with FX Primus Ltd, a PRIME Mantle Corporation PLC company. All rights reserved.
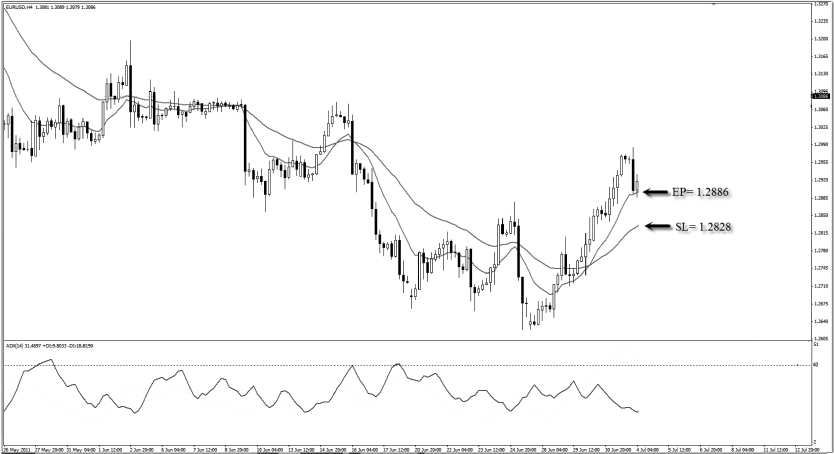
FIGURE 8.5 Exit Trade When ADX 14 Crosses Above 40 and Drops Back Below
Source: Created with FX Primus Ltd, a PRIME Mantle Corporation PLC company. All rights reserved.
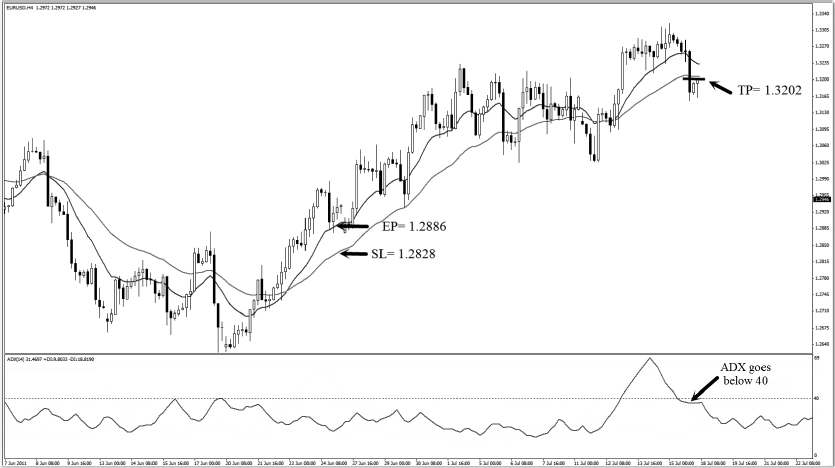
From the long example in Figure 8.5:
The risk for this trade is 58 pips, and the reward is 316 pips. The risk to reward ratio is 1:5.4, which yields a whopping 16.2% return if we take a 3% risk.
I use the AUD/USD on the H1 time frame to illustrate a short trade. Here are the steps to execute the trend rider strategy for short:
FIGURE 8.6 EMA 12 Crosses Below EMA 36
Source: Created with FX Primus Ltd, a PRIME Mantle Corporation PLC company. All rights reserved.
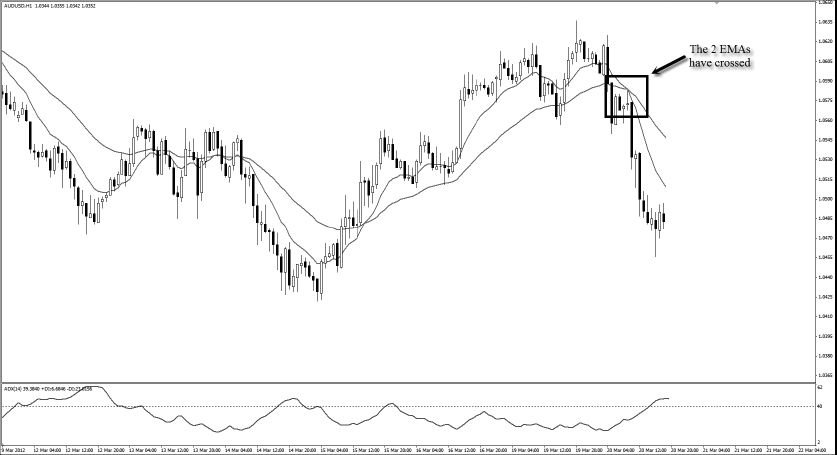
FIGURE 8.7 Candlestick Touches EMA 12
Source: Created with FX Primus Ltd, a PRIME Mantle Corporation PLC company. All rights reserved.
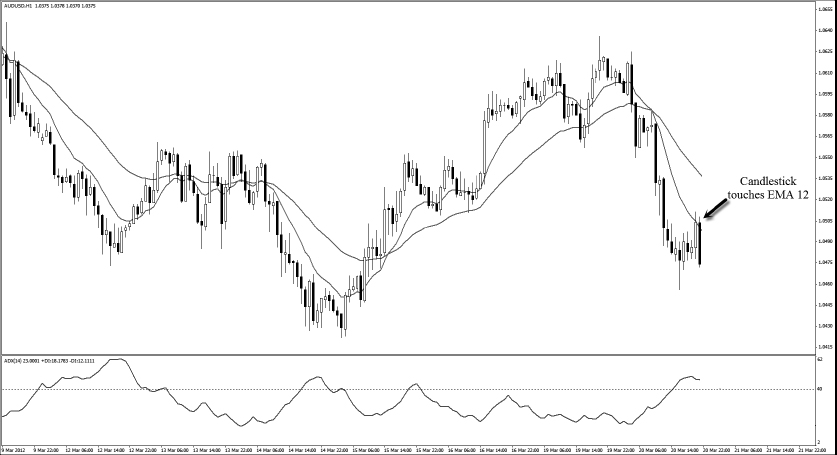
FIGURE 8.8 Set Stop Loss and Profit Target
Source: Created with FX Primus Ltd, a PRIME Mantle Corporation PLC company. All rights reserved.
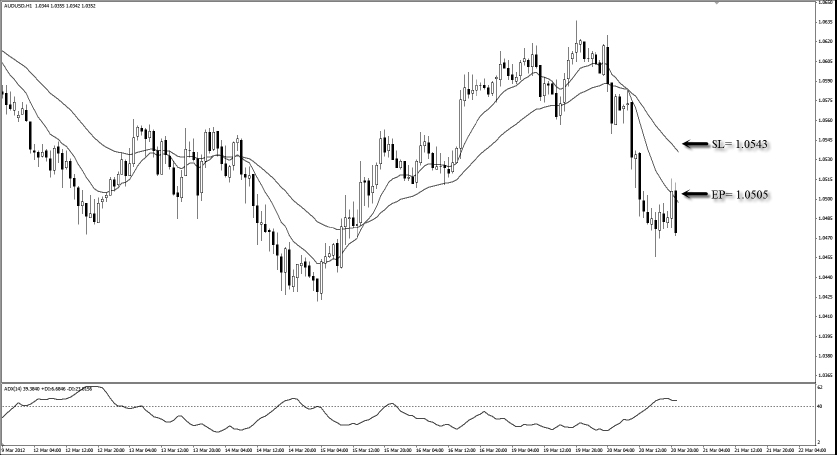
FIGURE 8.9 Exit Trade When ADX 14 Crosses Above 40 and Drops Back Below
Source: Created with FX Primus Ltd, a PRIME Mantle Corporation PLC company. All rights reserved.
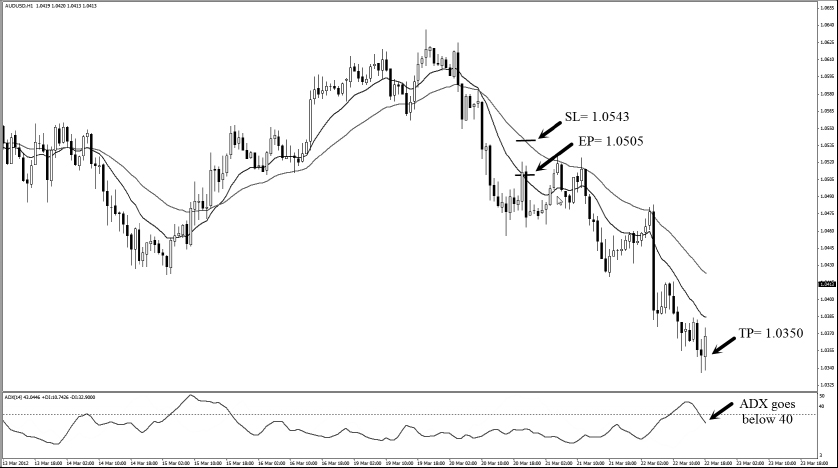
From the short example in Figure 8.9:
The risk for this trade is 38 pips, and the reward is 155 pips. The risk to reward ratio is 1:4, which yields a decent 12% return if we take a 3% risk.
The trend rider is one of the most effective strategies in the swing traders’ toolbox because there is no predetermined profit target.
One of the biggest reasons why retail traders fail to make good money in the forex market is because they exit too early, especially when the ongoing trade is registering a small profit. The use of the ADX indicator in this strategy prevents us from exiting a trade prematurely. Instead, it keeps us with the trend for the long haul. This is how big profits are generated.
Trend following is statistically valid in the sense that every successful trader vouches for it. Additionally, because of the highly favorable risk to reward ratio of trend following strategies, one good trade can more than compensate for the losses incurred during a bad patch. Again, the key to successful trend trading is not to cut your profits short.
The trigger of a trend can be anything from a political decision, to a central bank policy announcement, to the discovery of new resources, to a myriad of other possibilities. Trends move like waves in that they ebb and flow.
In an uptrend, you will find that, at a certain point in time, prices will pull back or retrace before continuing with the upward movement. Similarly for a downtrend, prices will retrace upward against the downward momentum before continuing their way down again.
This ebb-and-flow movement frustrates many trend traders, because these retracements often stop out their trades while the market moves in their direction again later.
Experienced trend traders usually wait for the retracement to happen before taking a trade in the direction of the trend. This is how the trend bouncer strategy came about. The Bollinger Bands indicator provides an objective way of identifying the ebb-and-flow movement of a trend.
Since this is a trend strategy, we have more than one profit target. In fact, we have three specific profit levels for this strategy. The strategy differs slightly from the trend rider in that there are specific levels for trend bouncer traders to exit with profits.
The trend bouncer method works with the hourly (H1) or 4-hourly (H4) chart. This means that each candle on the chart represents 1 hour or 4 hours of price movement respectively.
We use these indicators for this strategy:
Refer to the piranha strategy in Chapter 5 for an explanation on the Bollinger Bands indicator.
This strategy is suitable for all currency pairs listed on the broker’s platform, especially the seven major currency pairs of:
With the help of the Bollinger Bands, we can objectively identify the ebb-and-flow movement of a trend. When the candlestick hits the upper band of Bollinger Bands (MA 12, Dev 2), it indicates an upward momentum, and we prepare to go long. As prices retrace back to the MA 12 (the center line of the Bollinger Bands), a significant retracement has occurred, and it is a good time to enter for a long trade.
When the candlestick hits the lower band of the Bollinger Bands (MA 12, Dev 2), it indicates a downward momentum, and we prepare to go short. As prices retrace back to the MA12 (the center line of the Bollinger Bands), a significant retracement has occurred, and it is a good time to enter for a short trade. This trend strategy exits at three different targets.
We use the GBP/USD on the H4 time frame to illustrate a long trade. Here are the steps to execute the trend bouncer strategy for long:
FIGURE 8.10 Price Hits Upper Band of First Bollinger Bands (MA 12, Dev 2) and Retraces Down to the Center MA 12
Source: Created with FX Primus Ltd, a PRIME Mantle Corporation PLC company. All rights reserved.
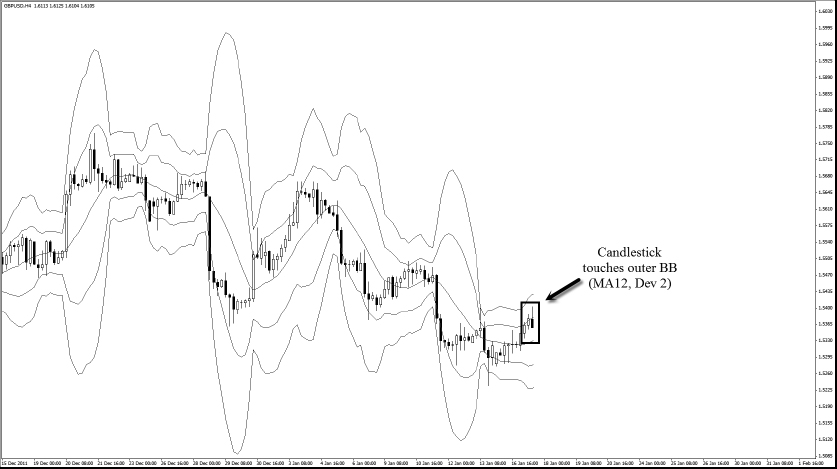
FIGURE 8.11 Price Touches MA 12
Source: Created with FX Primus Ltd, a PRIME Mantle Corporation PLC company. All rights reserved.
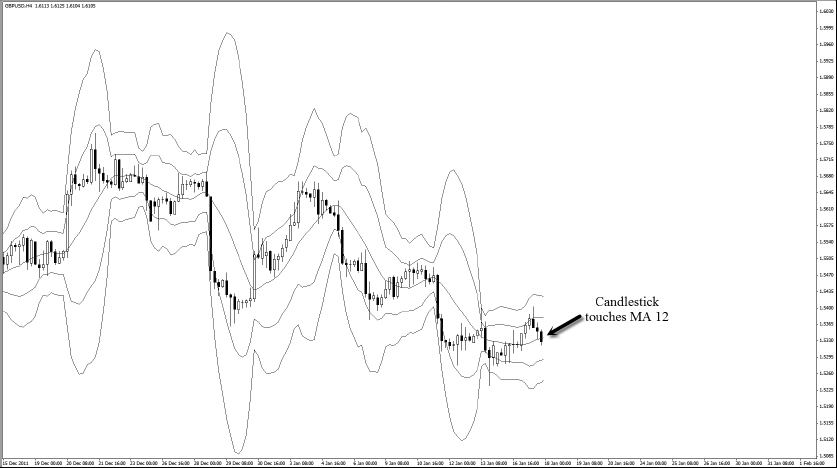
FIGURE 8.12 Set Stop Loss and Profit Targets
Source: Created with FX Primus Ltd, a PRIME Mantle Corporation PLC company. All rights reserved.
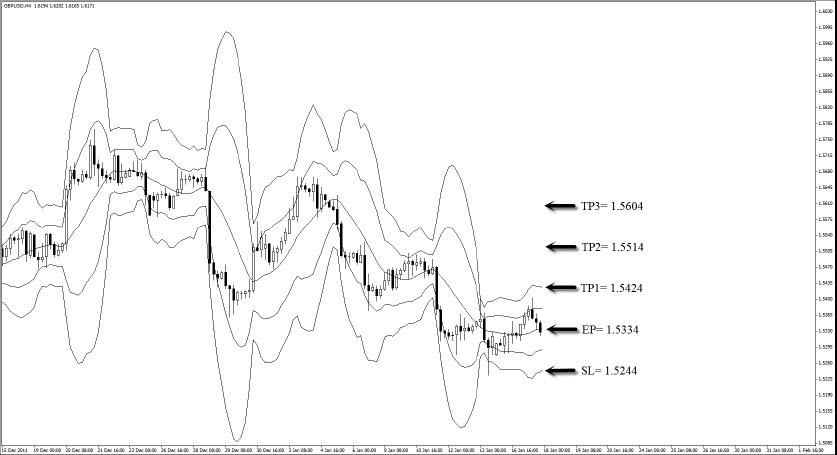
FIGURE 8.13 Trade Hits Profit Targets
Source: Created with FX Primus Ltd, a PRIME Mantle Corporation PLC company. All rights reserved.
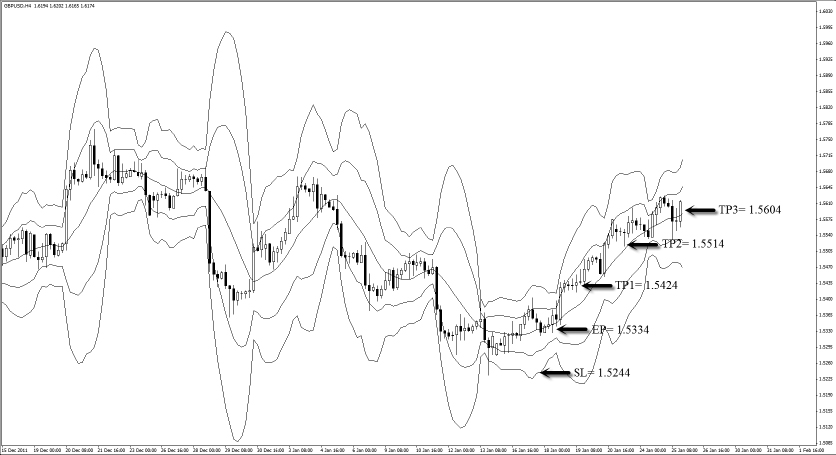
From the long example in Figure 8.13:
The risk for this trade is 90 pips, and the reward is 270 pips if all three targets are hit. The risk to reward ratio is 1:3, which yields a tidy 9% return if we take a 3% risk.
We use the NZD/USD on H1 time frame to illustrate a short trade. Here are the steps to execute the trend bouncer strategy for short:
FIGURE 8.14 Price Hits Lower Band of First Bollinger Bands (MA 12, Dev 2) and Retraces Back Up to Center MA 12
Source: Created with FX Primus Ltd, a PRIME Mantle Corporation PLC company. All rights reserved.
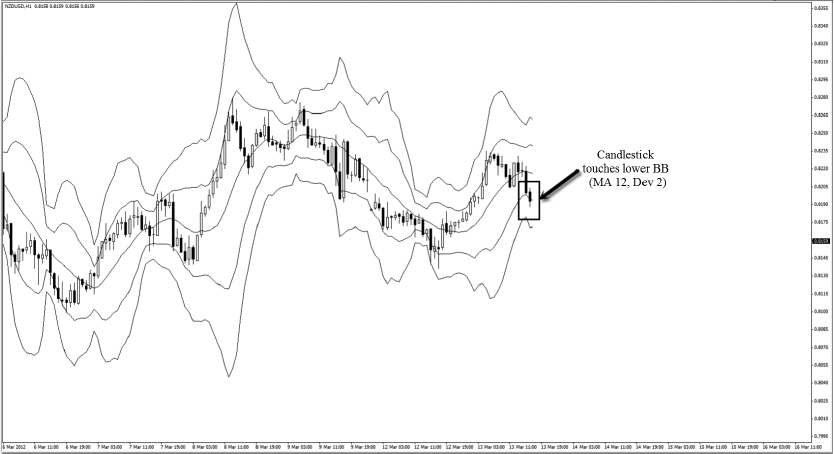
FIGURE 8.15 Price Touches MA 12
Source: Created with FX Primus Ltd, a PRIME Mantle Corporation PLC company. All rights reserved.
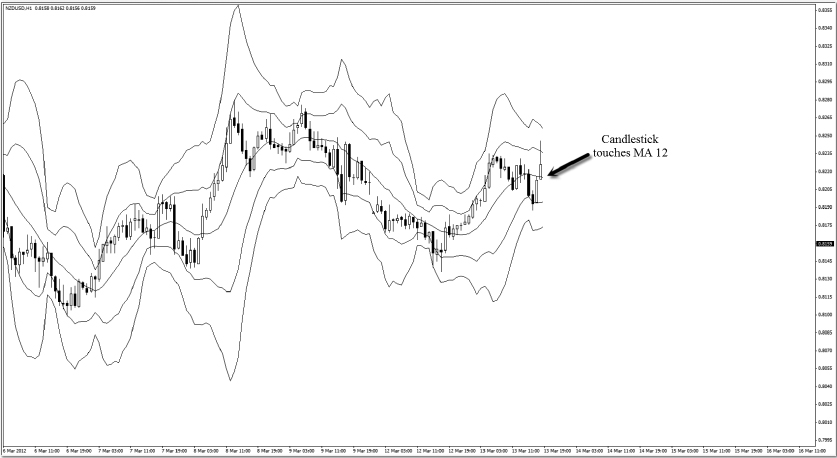
FIGURE 8.16 Set Stop Loss and Profit Targets
Source: Created with FX Primus Ltd, a PRIME Mantle Corporation PLC company. All rights reserved.
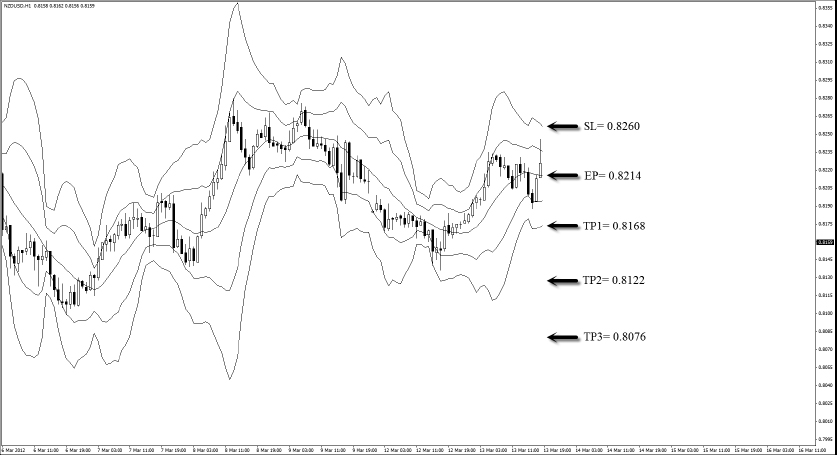
FIGURE 8.17 Trade Hits Profit Targets
Source: Created with FX Primus Ltd, a PRIME Mantle Corporation PLC company. All rights reserved.
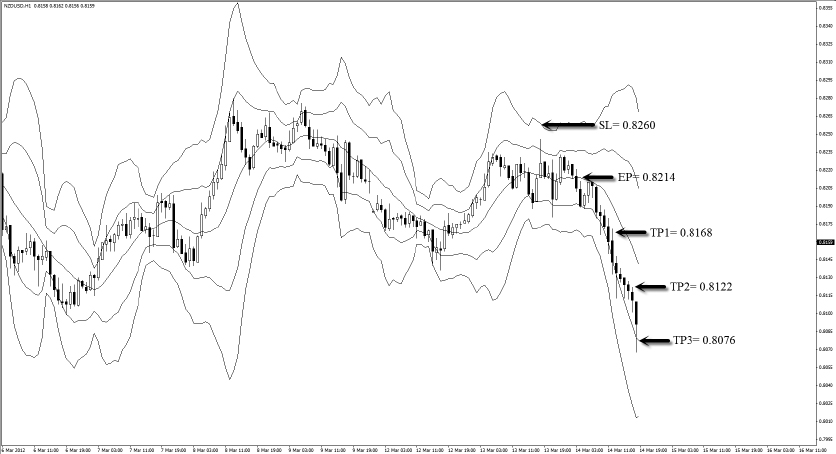
From the short example in Figure 8.17:
The risk for this trade is 46 pips, and the reward is 138 pips if all three targets are hit. The risk to reward ratio is 1:3, which yields a tidy 9% return if we take a 3% risk.
Understanding how trends move in ebbs and flows allow traders like you and me to identify the direction and timing of our entries. We enter during the “ebb” and let the “flow” ride us to our profit targets.
Unlike the trend rider strategy, the trend bouncer strategy has three predetermined profit targets. Traders who like to bank in profits in various stages prefer this strategy. The strategy is rooted in trend trading. With a momentum indicator like the Bollinger Bands, you will greatly increase your odds at being profitable in the long run.
Remember that smart money typically follows the trend. This strategy helps us to hop on board early when we identify the trend.
“I am using a wonderful strategy, but I have to constantly monitor the market in order not to miss a trade.” “Ah! I missed a trade again.” “According to my strategy, it looks like there may be a trade setup soon, but I have a movie date in the next hour. What should I do?”
Do these scenarios sound familiar to you?
Wouldn’t it be nice to have a strategy that actually prompts you when momentum of the market has switched to a new trend? In fact, the beauty of the fifth element strategy is that it tells you ahead of time when the entry price will be.
This is the third and final trend strategy in this segment. Let’s find out what’s so special about it.
The fifth element strategy works with the hourly (H1) or 4-hourly (H4) chart. This means that each candle on the chart represents 1 hour or 4 hours of price movement respectively.
We use this indicator for this strategy:
Moving average convergence divergence (MACD) with default settings:
The moving average was created by Gerald Appel in 1979. Today the MACD is one of the most popular indicators used by forex traders worldwide. The indicator calculates and displays the difference between the two EMAs at any time.
Since we are using the default setting, this difference is based on the EMA 12 and the EMA 26. As the market moves, the two moving averages move in tandem, widening (diverging) when the market is trending and tightening (converging) when the market is slowing down.
There are three important elements of the MACD indicator:
It is important to recognize that the histogram is a derivative of the price and not the price itself. The histogram is positive when the MACD line is above its SMA 9 and negative when the MACD line is below its SMA 9.
When prices rise, the histogram bar becomes longer as the speed of the price movement accelerates; the bar contracts as price movement decelerates. The same principle applies when prices are falling, but the histogram bars form at the bottom.
Up until now, I have described the traditional MACD. In the fifth element strategy, we use the Meta Trader 4 MACD. The difference between the traditional MACD and the Meta Trader 4 MACD is in the histogram. The traditional MACD’s histogram represents the difference between the MACD line and signal. The Meta Trader 4 MACD’s histogram however, represents only the MACD line, which is the difference between the EMA 12 and EMA 26.
The histogram is important to help us identify possible shifts in momentum and acts as a confirmation of the momentum. This is the main essence of the fifth element.
This strategy is suitable for all currency pairs listed on the broker’s platform, especially the seven major currency pairs of:
The MACD histogram indicates the direction and momentum of the market. When the MACD histogram switches from negative to positive, this indicates a possible upward shift in momentum. We wait for five positive bars on the histogram to confirm the momentum before entering a long trade on the fifth bar. No prizes for guessing why the name of this strategy is called the fifth element!
When the MACD histogram switches from positive to negative, this indicates a possible downward shift in momentum. We wait for five negative bars of the histogram to confirm the momentum before entering a short trade on the fifth bar.
We use the AUD/USD on the H4 time frame to illustrate a long trade. Here are the steps to execute the fifth element strategy for long:
FIGURE 8.18 MACD Histogram Goes from Negative to Positive
Source: Created with FX Primus Ltd, a PRIME Mantle Corporation PLC company. All rights reserved.
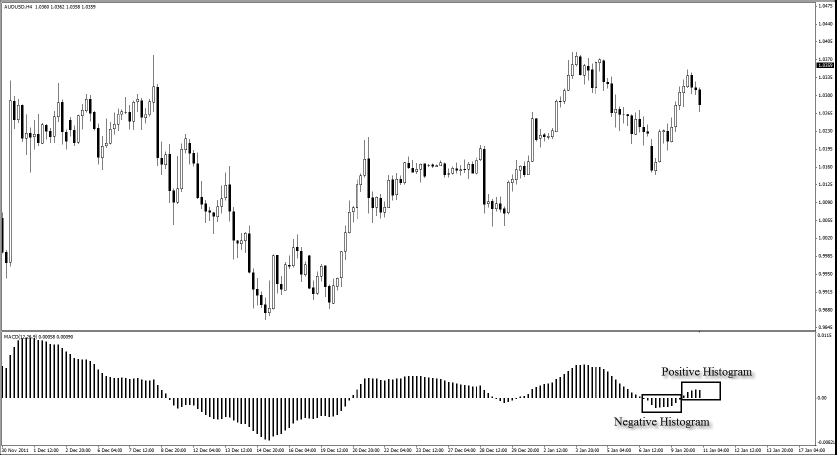
FIGURE 8.19 Four Positive Bars Form Before Going Long
Source: Created with FX Primus Ltd, a PRIME Mantle Corporation PLC company. All rights reserved.
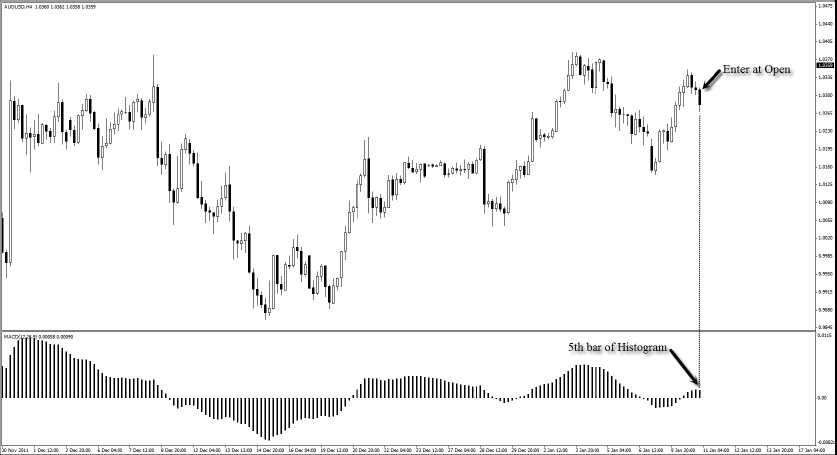
FIGURE 8.20 Set Stop Loss and Profit Targets
Source: Created with FX Primus Ltd, a PRIME Mantle Corporation PLC company. All rights reserved.
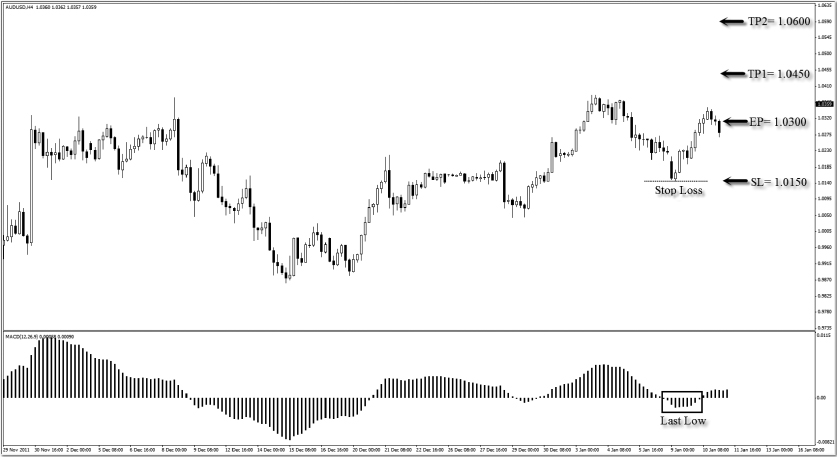
From the long example in Figure 8.21:
FIGURE 8.21 Trade Hits Profit Targets
Source: Created with FX Primus Ltd, a PRIME Mantle Corporation PLC company. All rights reserved.

The risk for this trade is 150 pips, and the reward is 300 pips if both targets are hit. The risk to reward ratio is 1:2, which yields a tidy 6% return if we take a 3% risk.
We use the EUR/USD on the H4 time frame to illustrate a short trade. Here are the steps to execute the fifth element strategy for short:
FIGURE 8.22 MACD Histogram Goes from Positive to Negative
Source: Created with FX Primus Ltd, a PRIME Mantle Corporation PLC company. All rights reserved.
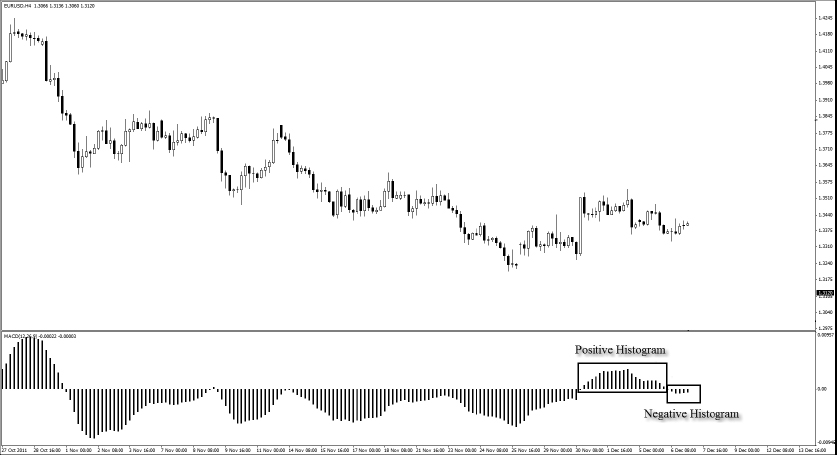
FIGURE 8.23 Four Negative Bars Form on Histogram Before Going Short
Source: Created with FX Primus Ltd, a PRIME Mantle Corporation PLC company. All rights reserved.
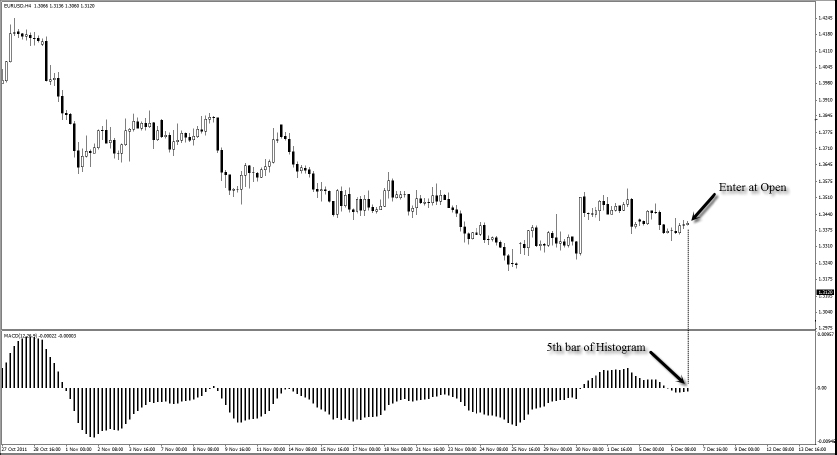
FIGURE 8.24 Set Stop Loss and Profit Targets
Source: Created with FX Primus Ltd, a PRIME Mantle Corporation PLC company. All rights reserved.
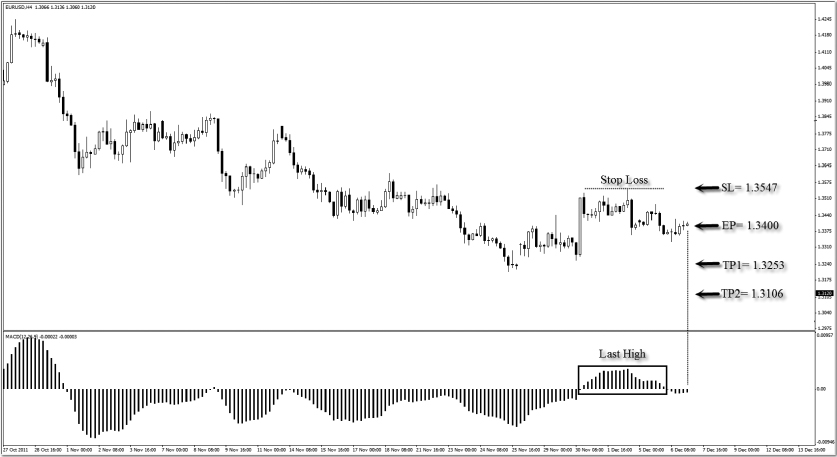
From the short example in Figure 8.25:
FIGURE 8.25 Trade Hits Profit Targets
Source: Created with FX Primus Ltd, a PRIME Mantle Corporation PLC company. All rights reserved.
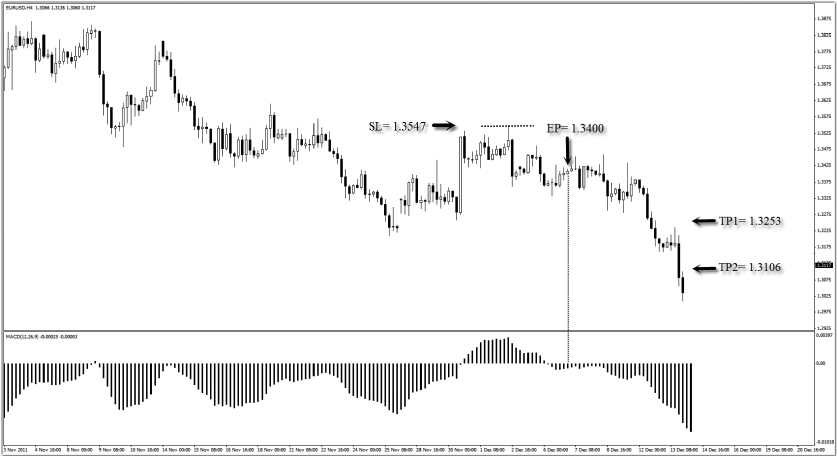
The risk for this trade is 147 pips, and the reward is 294 pips if both targets are hit. The risk to reward ratio is 1:2, which yields a tidy 6% return if we take a 3% risk.
The fifth element is an excellent swing trading strategy for beginners. The beauty of this strategy is that it does not require you to monitor the market for a long time. It also signals you well in advance as to when the entry of a trade is about to take place. As you know by now, the entry takes place on the fifth bar after the MACD histogram switches from negative to positive or from positive to negative.
Five bars of the histogram is equivalent to 5 hours on the H1 time frame or 20 hours on the H4 time frame. This means you need to monitor the market only on a 5-hourly basis if you are trading the H1 time frame or a 20-hourly basis if you are trading the H4 time frame. Knowing that the entry is always on the fifth bar of the histogram means that you are in total control of your time.
As an example, let’s say that you are trading the H1 time frame. You spot the MACD histogram switching from negative to positive. You glance at your watch and see that the time is 2:15 P.M.
The current bar is the first bar, and it corresponds to the 2 P.M. candle. What would be the likely time that you will enter the trade? The answer is 6 P.M., because that would be the start of the candle that corresponds to the fifth bar of the histogram. You have ample time to catch a two-hour movie before heading home again to prepare for the trade!
The forex market either trends or ranges. The last three strategies were dedicated to trading the trend. The next two strategies are used to trade the range.
Range strategies are based either on pure price action or on indicators, or using a combination of both. Oscillators are a class of indicators that are commonly used in range strategies, because the oscillator indicates a possible range that the price swings back and forth from.
Some common oscillators are the stochastic and the relative strength index (RSI). As a trader and coach, I have found that identifying ranges poses more challenges to traders than identifying trends. After all, a range looks obvious to us only after it is formed.
To make matters worse, when a range is clearly formed and we are using a range strategy, price action soars and causes the market to break out of a range again. Hence, identifying the range while it is still forming offers a huge advantage to traders.
The power ranger strategy serves to fill this gap. Let us take a look at how this is done through the use of a powerful oscillator.
The power ranger method works with the hourly (H1) or 4-hourly (H4) chart. This means that each candle on the chart represents 1 hour or 4 hours of price movement respectively.
We use the stochastic indicator for this strategy with these settings:
%K period = 10
%D period = 3
Slowing = 3
Price field = High/Low
MA method = Simple
Levels 20 and 80
%K = 100[(C − L10)/(H10 − L10)]
Where:
C = most recent closing price
L10 = low of the last 10 periods
H10 = high of the last 10 periods
%D = 3-period moving average of %K
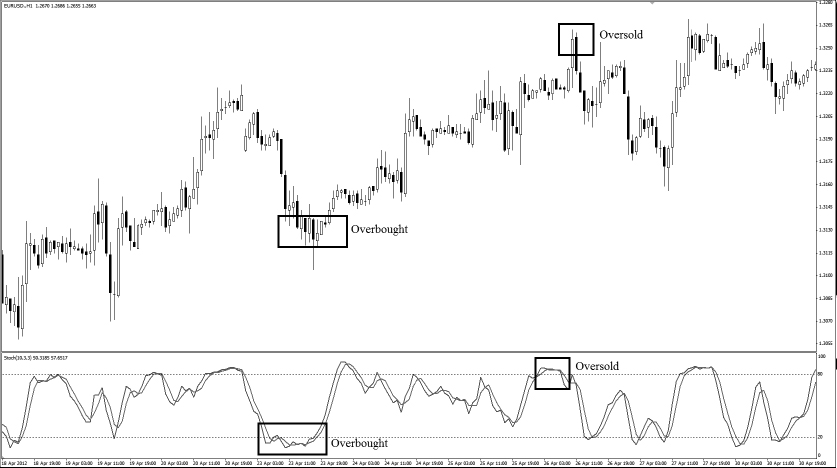
Stochastic is an oscillator that measures overbought and oversold conditions in the market.
Stochastic tells us when the market is overbought or oversold. When the stochastic lines are above 80, the market is overbought. When the stochastic lines are below 20, the market is oversold. As a general rule of thumb, oversold gives us a buy signal, and overbought gives us a sell signal.
Looking at the chart in Figure 8.26, you can see that the stochastic has been showing overbought and oversold conditions respectively. Based on this information, because the market was overbought for such a long period of time, we expect the price to go down soon.
FIGURE 8.26 Illustration of Stochastic Indicator
Source: Created with FX Primus Ltd, a PRIME Mantle Corporation PLC company. All rights reserved.
That is the basics of the stochastic. Many traders use the stochastic in different ways, but the main purpose of the indicator is to show us where the market is overbought and oversold.
This strategy is suitable for all currency pairs listed on the broker’s platform, especially the seven major currency pairs of:
The power ranger strategy is based on the concept that a range will form after the market finishes trending. We use the stochastic to give us an indication of a possible range formation. We also rely on the current market momentum to tell us when to go long or short. If the market is moving in an uptrend, we look to go long in the range. The entry is determined by the oversold region (below level 20) of the stochastic.
If the market is moving in a downtrend, we look to go short in the range. The entry is determined by the overbought region (above level 80) of the stochastic. We use the most recent high and low to determine the possible resistance and support of the range.
This strategy has two profit targets, and we take the first profit target within the range. The second profit target is located beyond the range in anticipation of a breakout opportunity.
We use EUR/USD on the H1 time frame to illustrate a long trade. Here are the steps to execute the power ranger strategy for long:
FIGURE 8.27 Draw Uptrend Line Based on Series of Higher Highs and Higher Lows
Source: Created with FX Primus Ltd, a PRIME Mantle Corporation PLC company. All rights reserved.
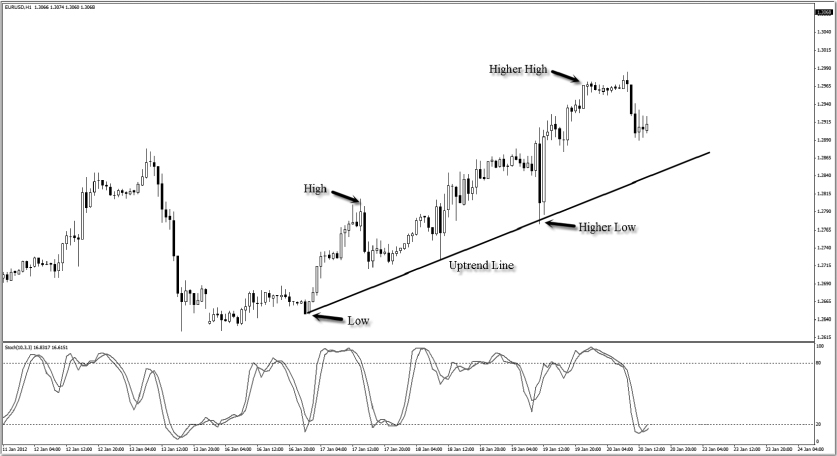
FIGURE 8.28 On the Stochastic, Look for %K and %D to Go Above Level 20 (Oversold)
Source: Created with FX Primus Ltd, a PRIME Mantle Corporation PLC company. All rights reserved.
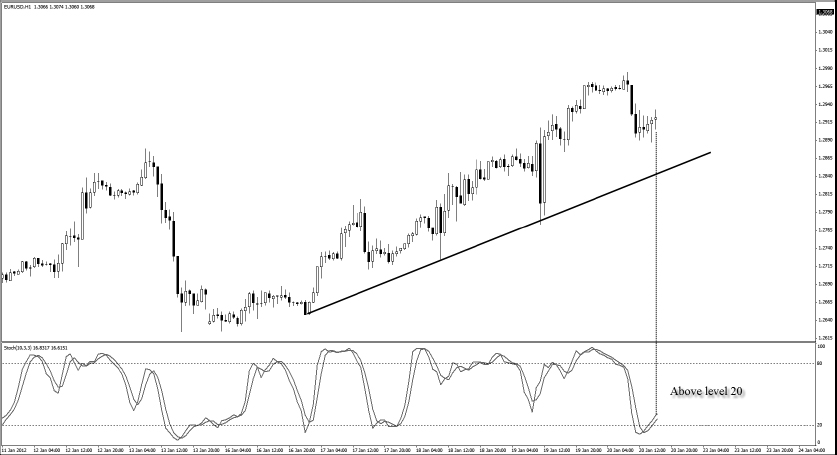
FIGURE 8.29 Set Stop Loss and Profit Targets
Source: Created with FX Primus Ltd, a PRIME Mantle Corporation PLC company. All rights reserved.

From the long example in Figure 8.30:
FIGURE 8.30 Trade Hits Profit Targets
Source: Created with FX Primus Ltd, a PRIME Mantle Corporation PLC company. All rights reserved.
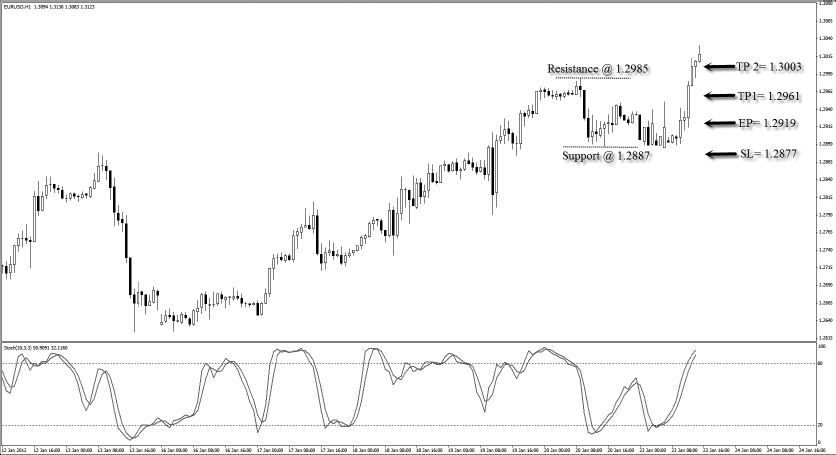
The risk for this trade is 42 pips, and the reward is 84 pips if both targets are hit. The risk to reward ratio is 1:2, which yields a tidy 6% return if we take a 3% risk.
We use AUD/USD on the H1 time frame to illustrate a short trade. Here are the steps to execute the power ranger strategy for short:
FIGURE 8.31 Draw a Downtrend Line Based on a Series of Lower Highs and Lower Lows
Source: Created with FX Primus Ltd, a PRIME Mantle Corporation PLC company. All rights reserved.
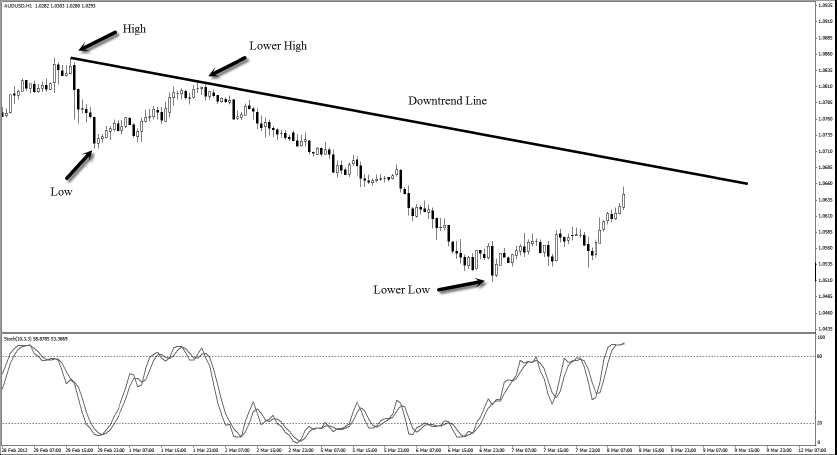
FIGURE 8.32 On the Stochastic, Look for %K and %D to Go Below Level 80 (Oversold)
Source: Created with FX Primus Ltd, a PRIME Mantle Corporation PLC company. All rights reserved.
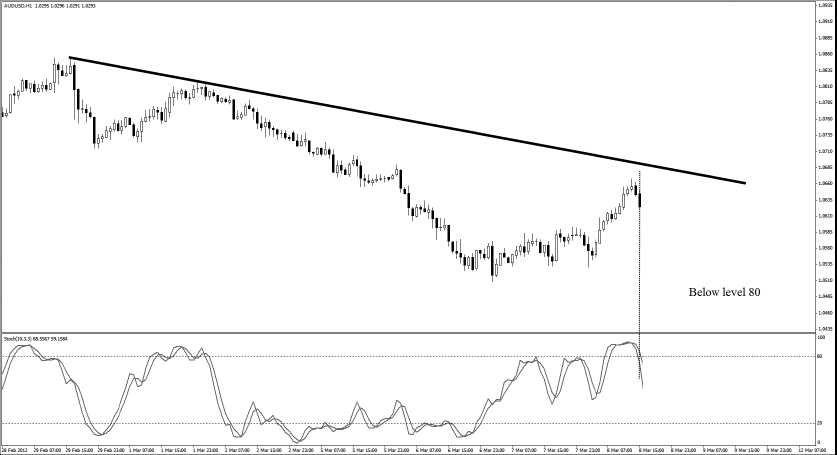
FIGURE 8.33 Set Stop Loss and Profit Targets
Source: Created with FX Primus Ltd, a PRIME Mantle Corporation PLC company. All rights reserved.
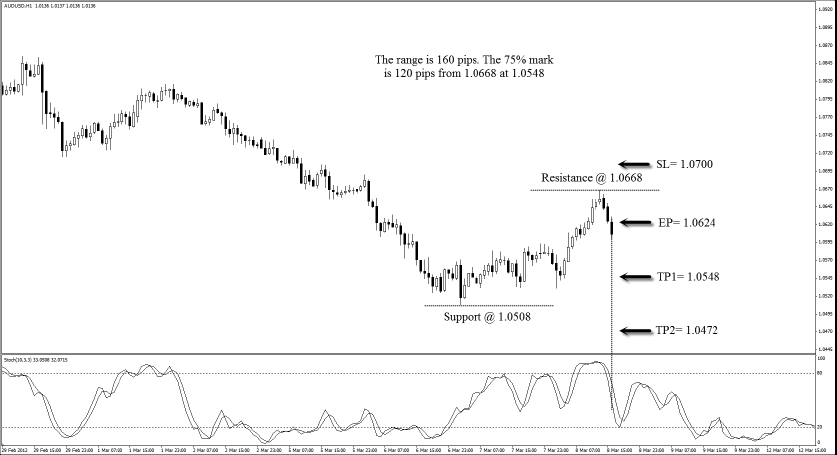
From the short example in Figure 8.34:
FIGURE 8.34 Trade Hits Profit Targets
Source: Created with FX Primus Ltd, a PRIME Mantle Corporation PLC company. All rights reserved.
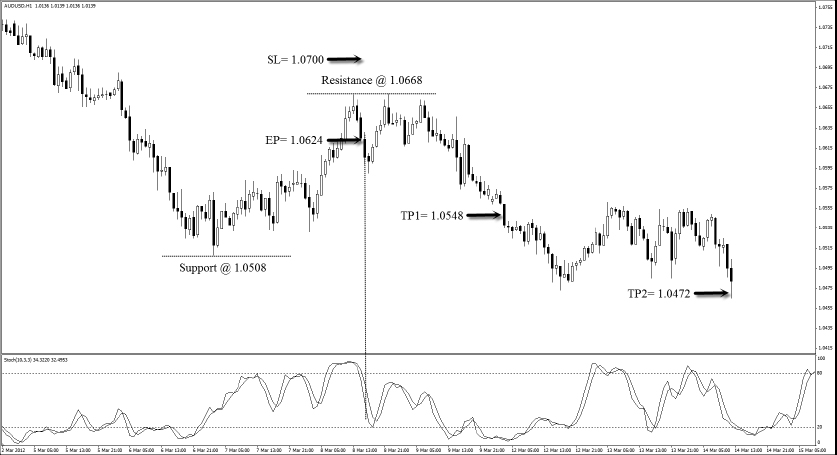
The risk for this trade is 76 pips, and the reward is 152 pips if both targets are hit. The risk to reward ratio is 1:2, which yields a tidy 6% return if we take a 3% risk.
This is an awesome range strategy as it allows us to take a range trade in the early stages of formation. The bonus is that it also allows us to take advantage of a second profit target in the event prices break out of a range and move into an early trend.
It doesn’t mean that you should go long whenever the stochastic is at the oversold region or go short whenever the stochastic is at the overbought region. If you do so, you may end up selling on an uptrend or buying on a downtrend. Going against momentum in this way can be risky.
Always determine the momentum of the market first before deciding whether to look for the overbought or oversold region of the stochastic. In an uptrend, look for the oversold region. In a downtrend, look for the overbought region. In this way, you will be trading along with the market momentum and putting yourself in an advantageous position.
Determining the momentum of the market first prevents us from blindly trading the signal given by the stochastic.
In the previous strategy, we explored a technique that helps us to anticipate a range with the help of the stochastic indicator and also trade it in the early stages of formation. The pendulum strategy comes to the rescue in the later stages of a range formation. In other words, we can still trade the range after it has been formed.
You don’t need any indicators for this strategy, and you can use it to trade a range for as long as the market is swinging back and forth within the range like a pendulum.
The pendulum method works with the hourly (H1) or 4-hourly (H4) chart. This means that each candle on the chart represents 1 hour or 4 hours of price movement respectively.
No indicators are used for this strategy.
This strategy is suitable for all currency pairs listed on the broker’s platform, especially the seven major currency pairs of:
The pendulum in motion swings back and forth because the force of gravity is pulling it back to the vertical position every time it swings away from it. The pendulum reaches an optimal height before it starts to fall back. However, if the swinging force is too great, the string holding the pendulum will snap, and the pendulum will fly off.
The ranging market acts in a similar fashion to the pendulum. Every time prices pull away from the midpoint of the range toward the support or resistance, market forces will pull it back towards the mid-point of the range. However, when the market gathers enough momentum, prices will break the support or resistance of the range and move into a trend.
In this strategy, we wait for the pendulum to reach its optimal height and fall before we enter the trade. We do this by executing a trade only at the 10% mark after prices turn back from either support or resistance. The first target is set at the 50% mark of the range, and the second target is set at the 90% mark of the range.
We use the AUD/USD on the H4 time frame to illustrate a long trade. Here are the steps to execute the pendulum strategy for long:
FIGURE 8.35 Identify Resistance and Support
Source: Created with FX Primus Ltd, a PRIME Mantle Corporation PLC company. All rights reserved.
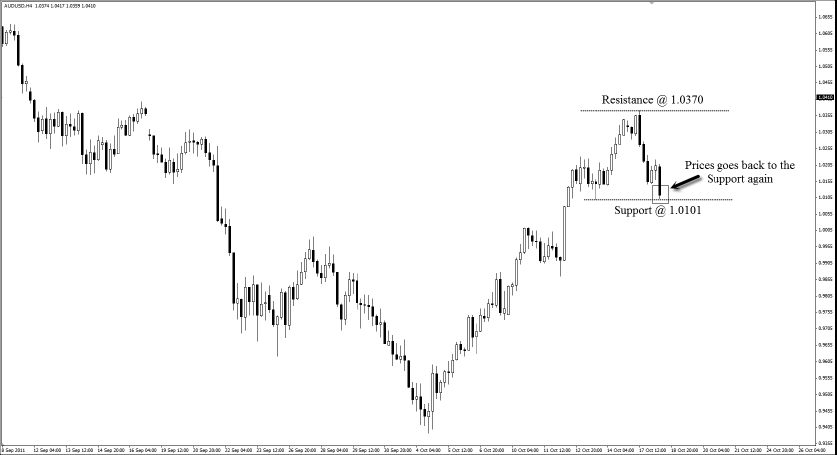
FIGURE 8.36 Enter When Price Bounces 27 Pips Above Support
Source: Created with FX Primus Ltd, a PRIME Mantle Corporation PLC company. All rights reserved.
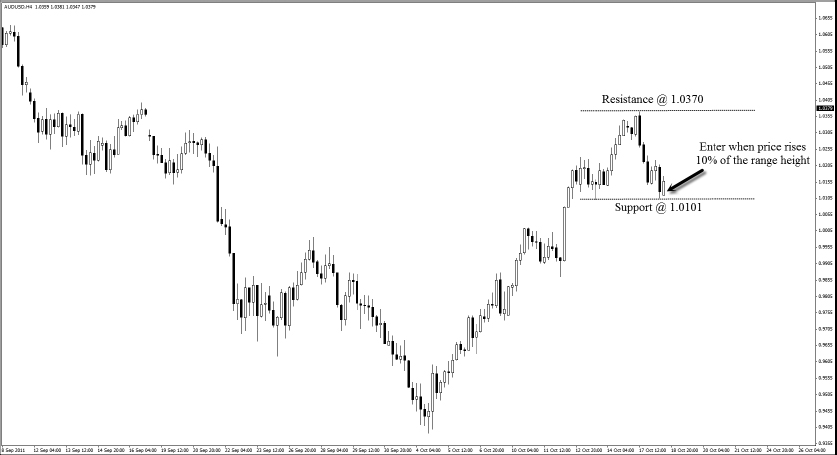
FIGURE 8.37 Set Stop Loss and Profit Targets
Source: Created with FX Primus Ltd, a PRIME Mantle Corporation PLC company. All rights reserved.
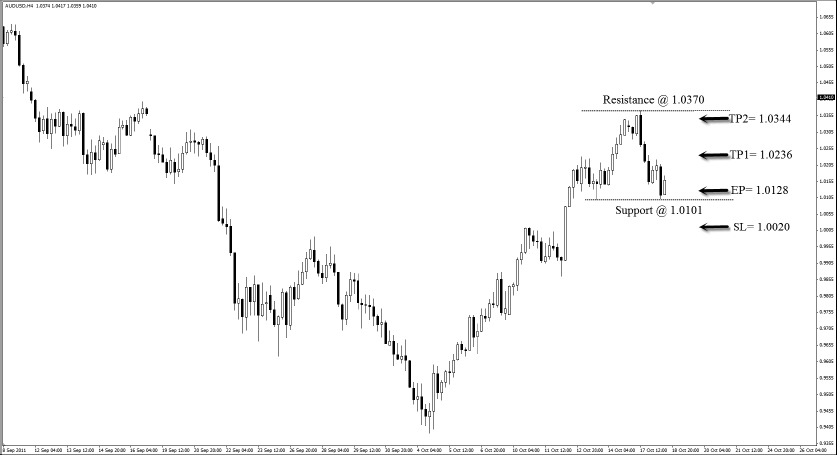
From the long example in Figure 8.38:
FIGURE 8.38 Trade Hits Profit Target
Source: Created with FX Primus Ltd, a PRIME Mantle Corporation PLC company. All rights reserved.
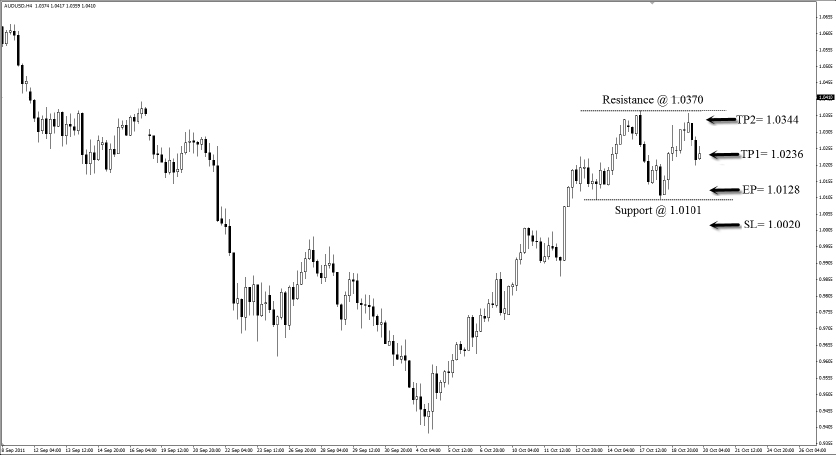
The risk for this trade is 108 pips, and the reward is 216 pips if both targets are hit. The risk to reward ratio is 1:2, which yields a tidy 6% return if we take a 3% risk.
We use the GBP/USD on the H4 time frame to illustrate a short trade. Here are the steps to execute the pendulum strategy for short:
FIGURE 8.39 Identify Resistance and Support
Source: Created with FX Primus Ltd, a PRIME Mantle Corporation PLC company. All rights reserved.
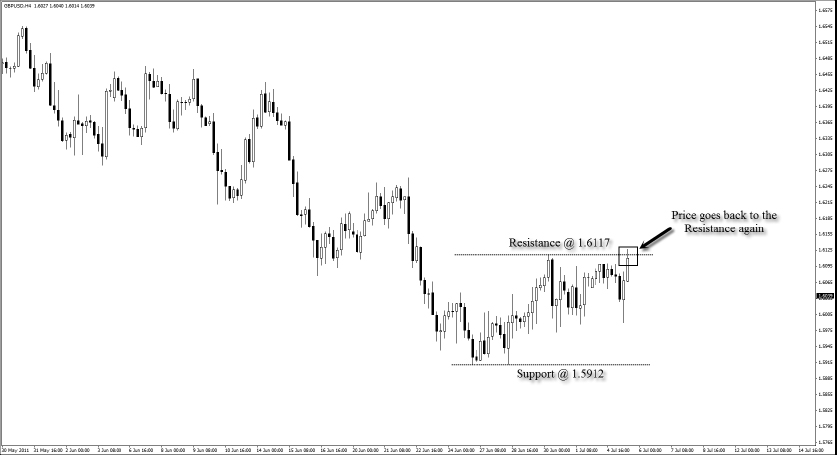
FIGURE 8.40 Enter When Price Bounces 21 Pips Below Resistance
Source: Created with FX Primus Ltd, a PRIME Mantle Corporation PLC company. All rights reserved.
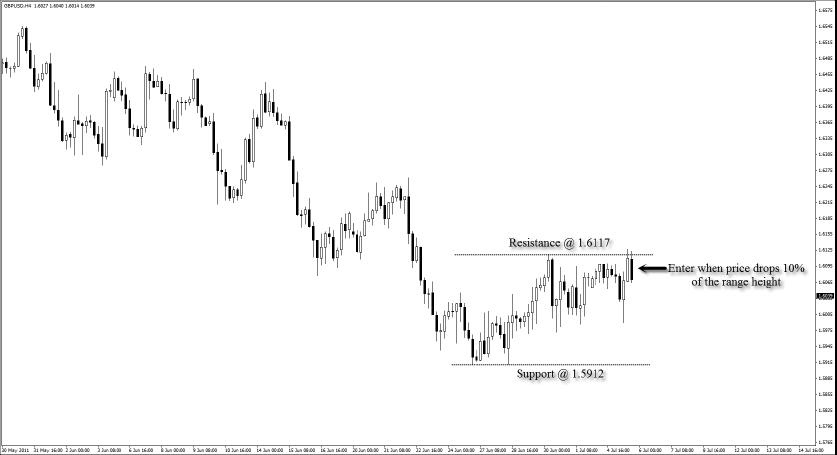
FIGURE 8.41 Set Stop Loss and Profit Targets
Source: Created with FX Primus Ltd, a PRIME Mantle Corporation PLC company. All rights reserved.
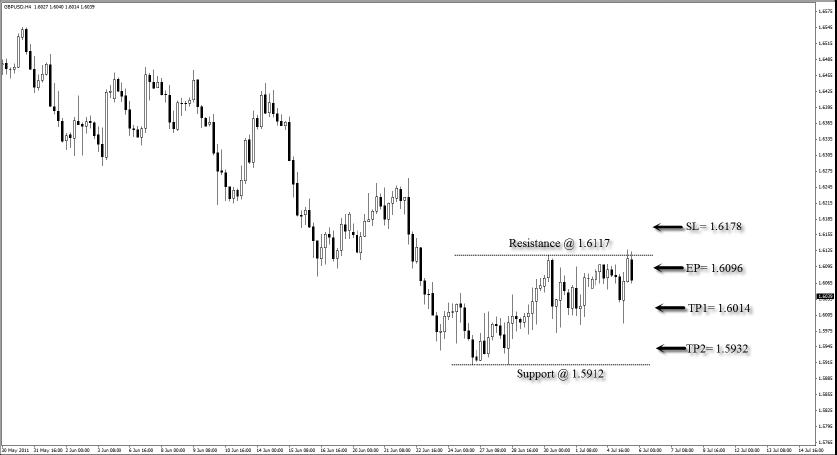
From the long example in Figure 8.42:
FIGURE 8.42 Trade Hits Profit Targets
Source: Created with FX Primus Ltd, a PRIME Mantle Corporation PLC company. All rights reserved.
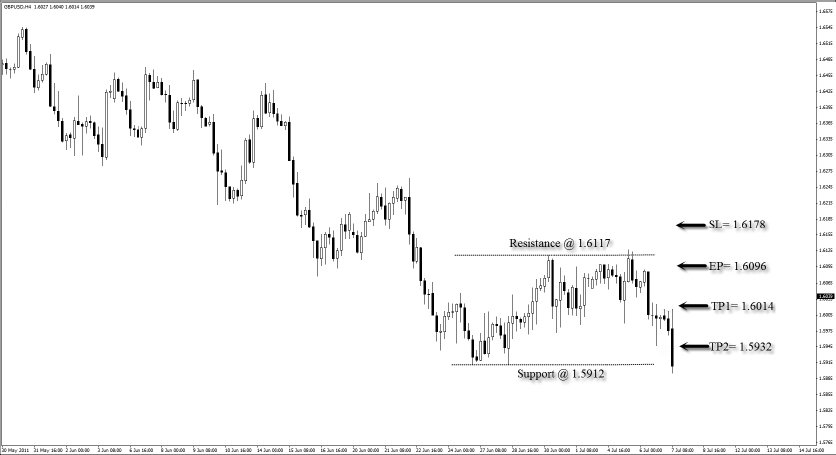
The risk for this trade is 82 pips, and the reward is 164 pips if both targets are hit. The risk to reward ratio is 1:2, which yields a tidy 6% return if we take a 3% risk.
This strategy is applicable as long as the market is swinging back and forth in a range. The power ranger strategy and the pendulum strategy work perfectly together. You can use the power ranger strategy to identify and trade the range in its early stage of formation, then apply the pendulum strategy to trade the later portion of the range.